Neural Loom
MAT 259, 2024
Shaw Xiao
Concept
My concept aims to visually explore and interpret how a deep learning model (AlexNet), understands and processes image data. Utilizing activation layer outputs extracted from the model for various images, I have created a 3D visualization that demonstrates the journey of image features through the model's layers. This interdisciplinary project offers an artistic perspective on the output layer views of image convolutional neural networks, providing an insight into the process of how these models perceive and analyze visual information.
Data Extraction
My methodology involved capturing intermediate outputs from each activation layer of AlexNet during the image classification process. Although the data is very large, I still tried to find a way to organize and present it, which is export it to multiple csv files.
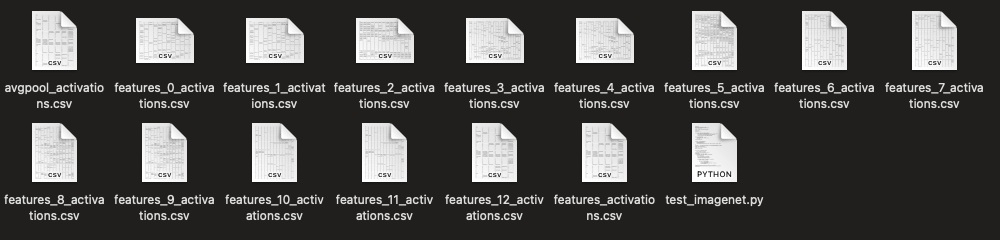
Also, since CSV is a two-dimensional data format, so I wanted to resize the data format of the CSV file to the structure of higher dimensional data, especially for a 4D tensor, so I processed and saved the data in the form of [batch_size, channels, height, width].
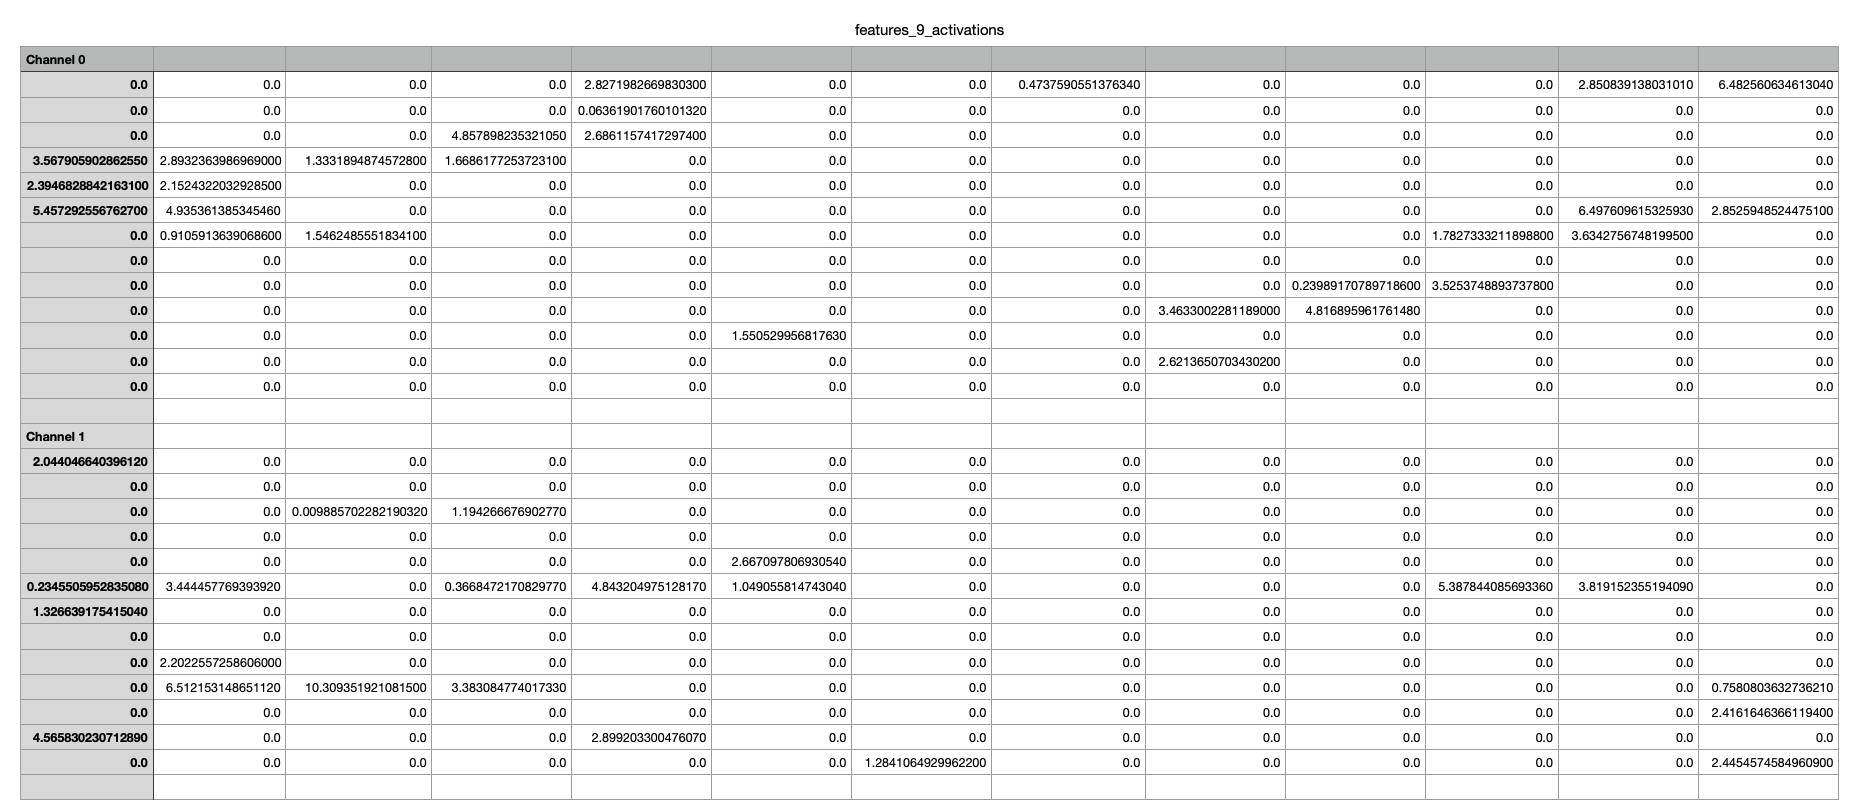
These values do not have a specific meaning, It just represents data generated by deep learning model when processing images, but I think the data pattern may have some changes when the model is processing different kinds of images. I'm also very curious about the different patterns of data for different images, so I'd like to present it in the form of a data visualization.
Also, since CSV is a two-dimensional data format, so I wanted to resize the data format of the CSV file to the structure of higher dimensional data, especially for a 4D tensor, so I processed and saved the data in the form of [batch_size, channels, height, width].
These values do not have a specific meaning, It just represents data generated by deep learning model when processing images, but I think the data pattern may have some changes when the model is processing different kinds of images. I'm also very curious about the different patterns of data for different images, so I'd like to present it in the form of a data visualization.
Process
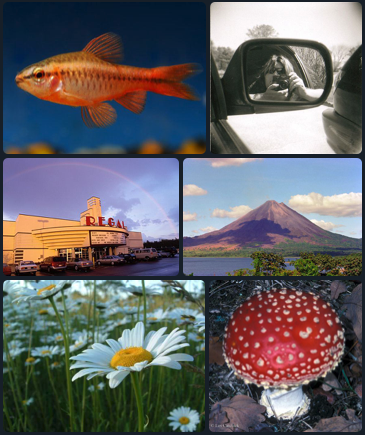
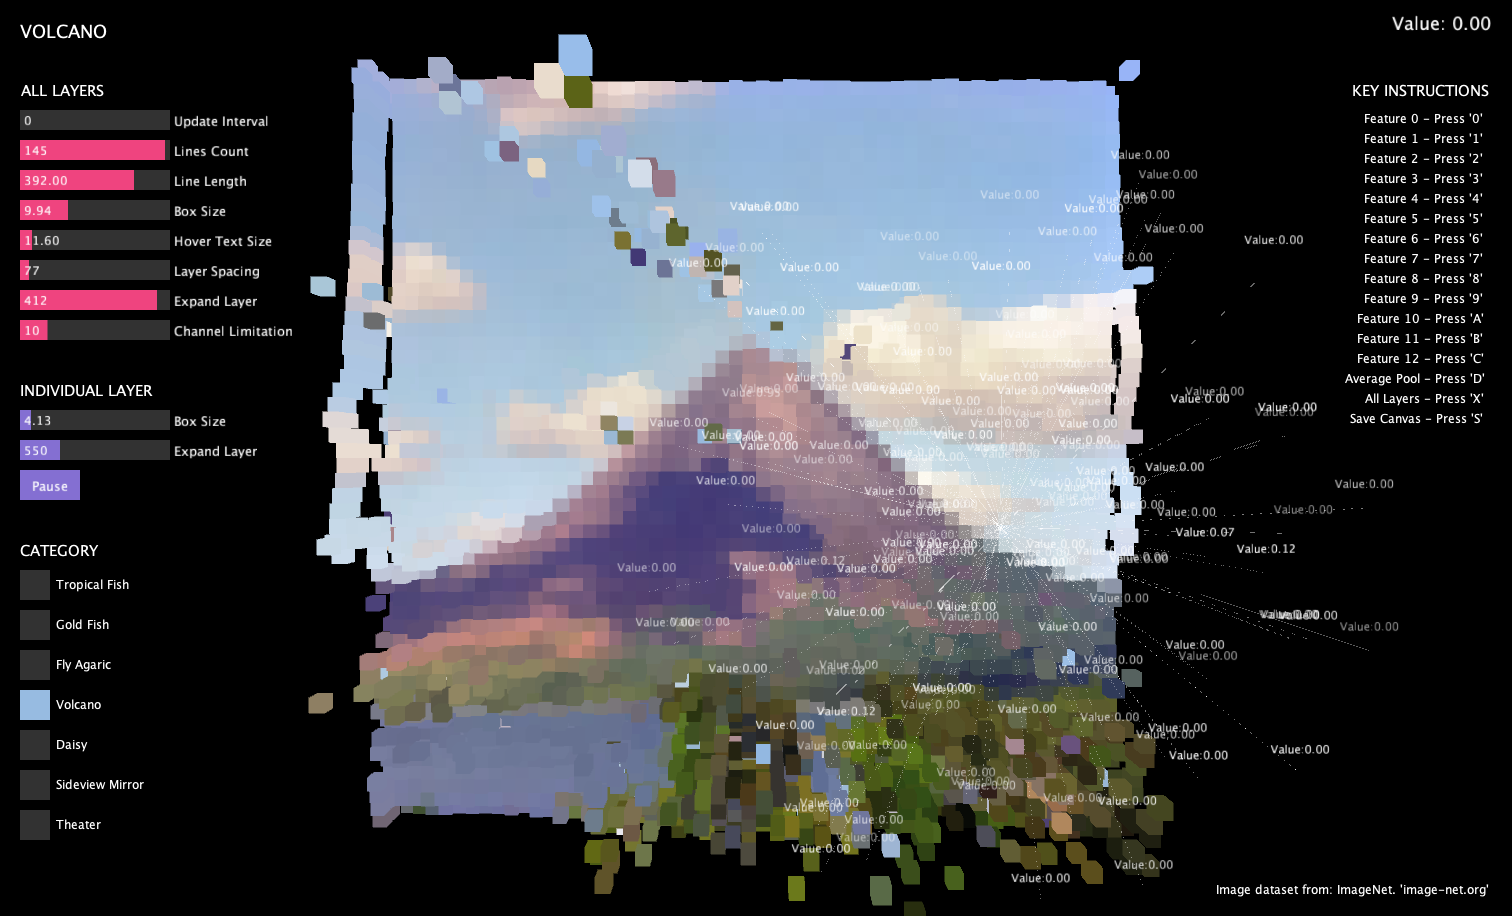
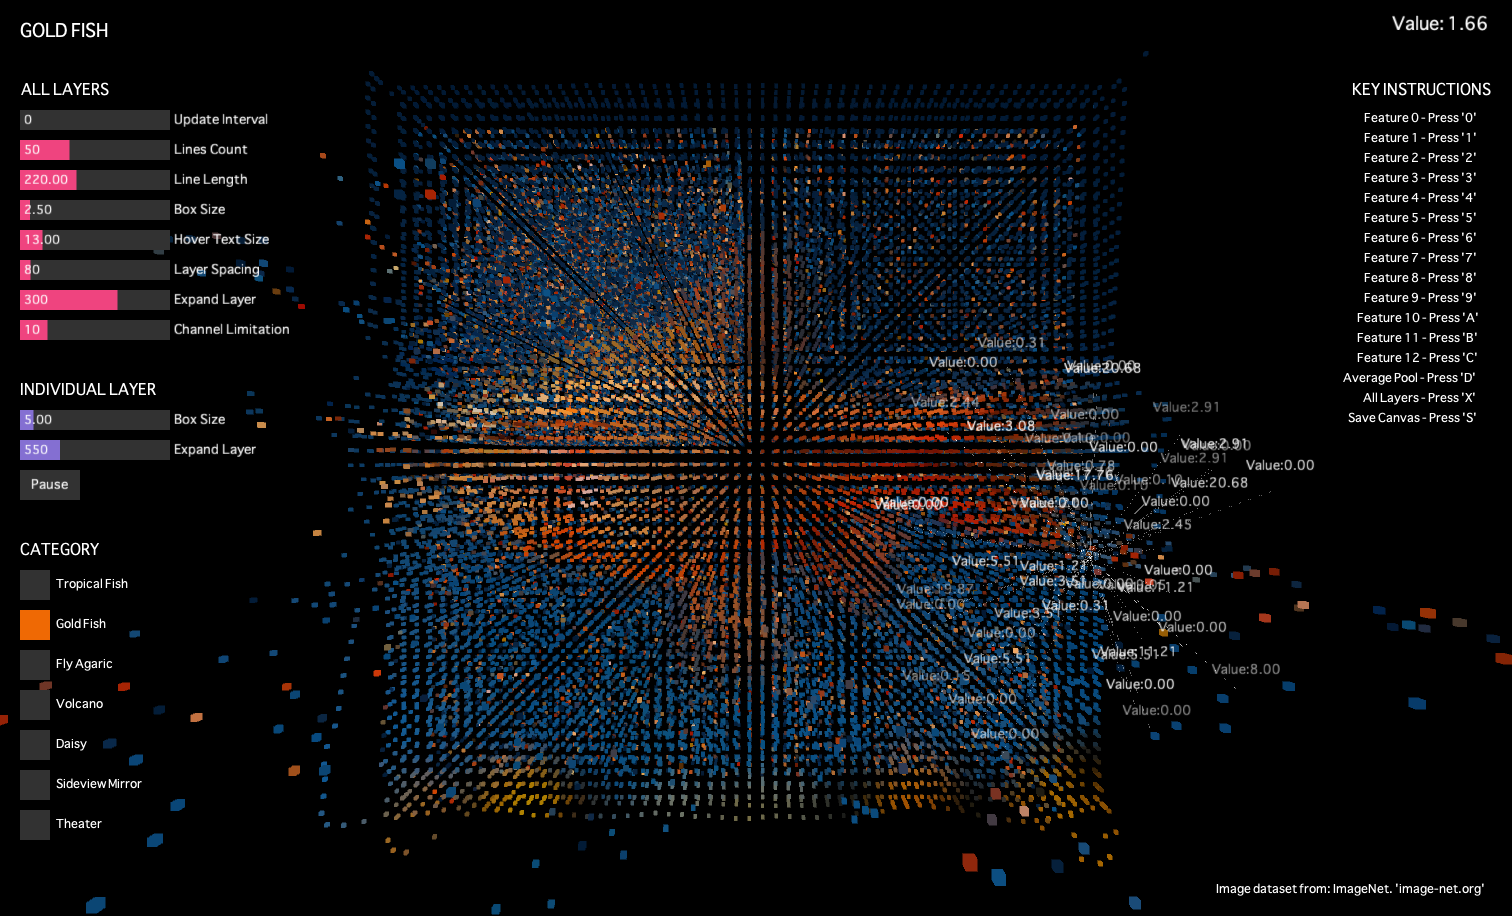
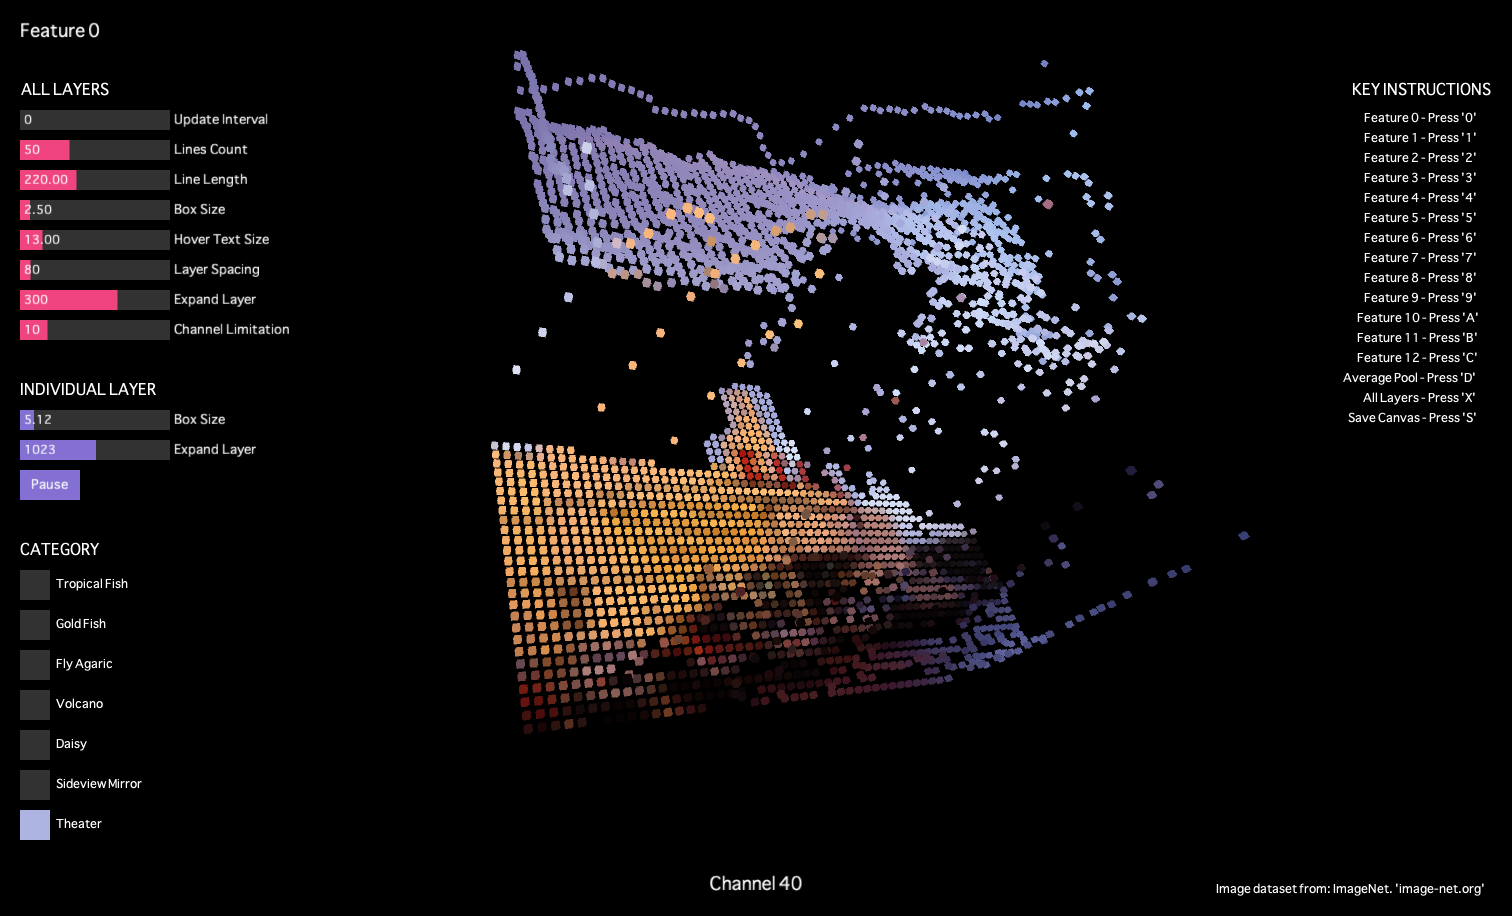
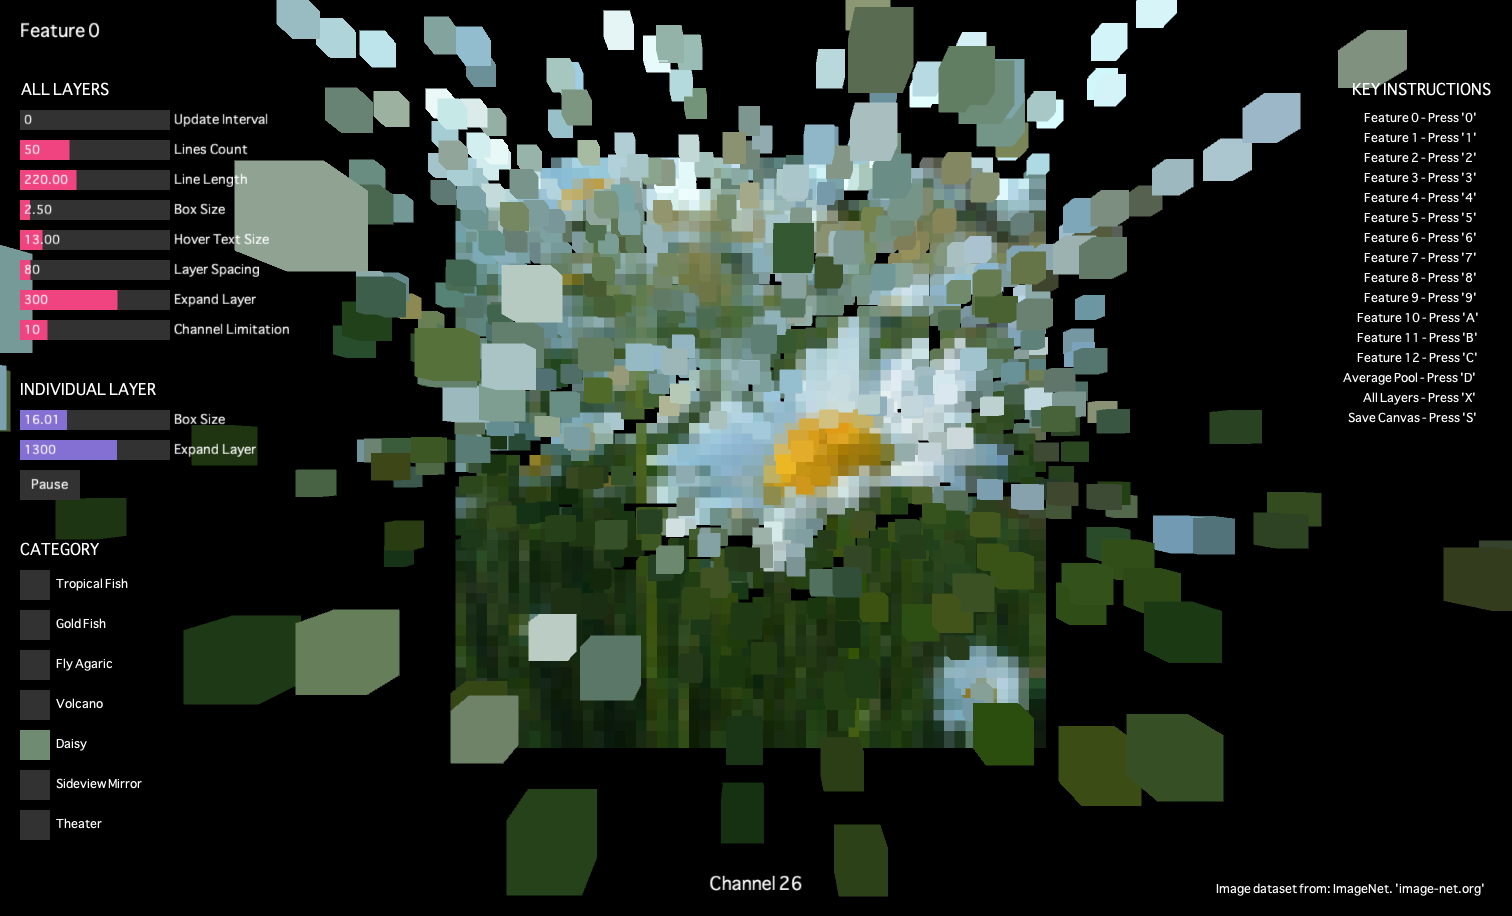
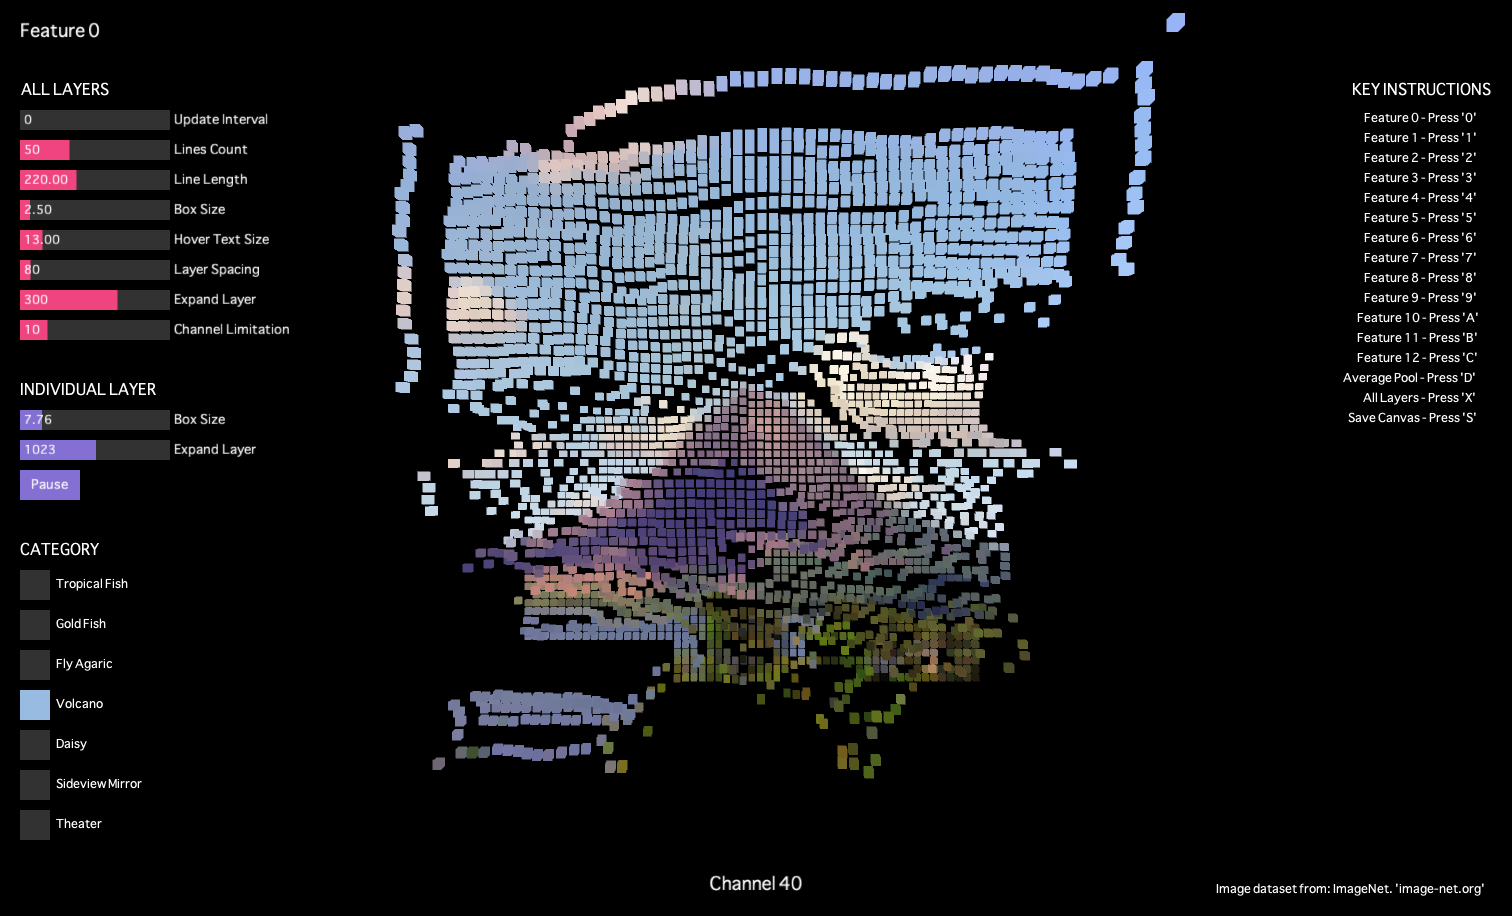
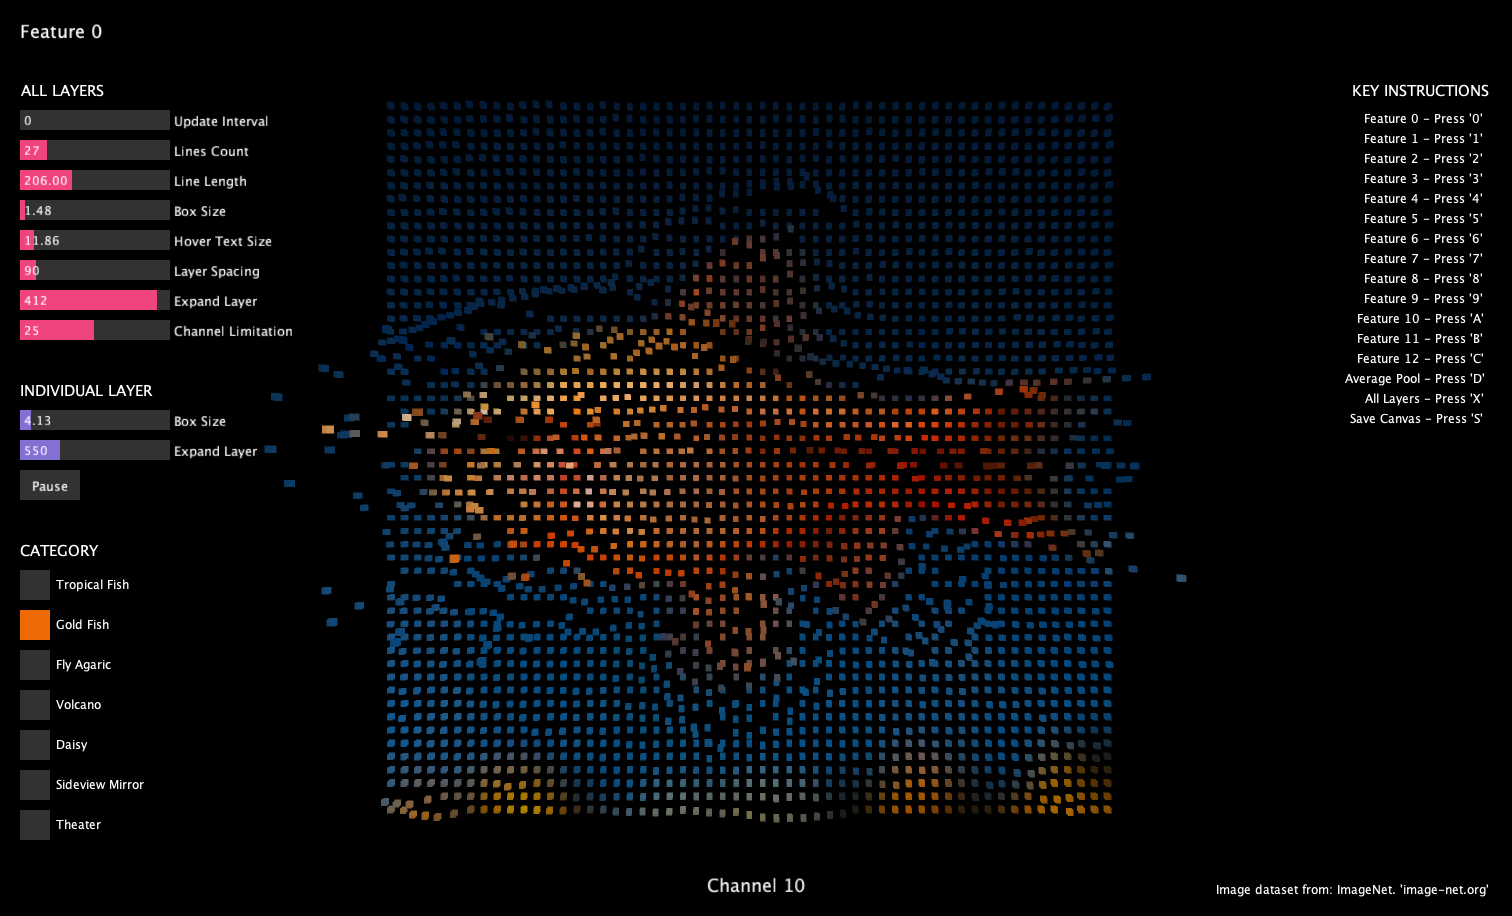
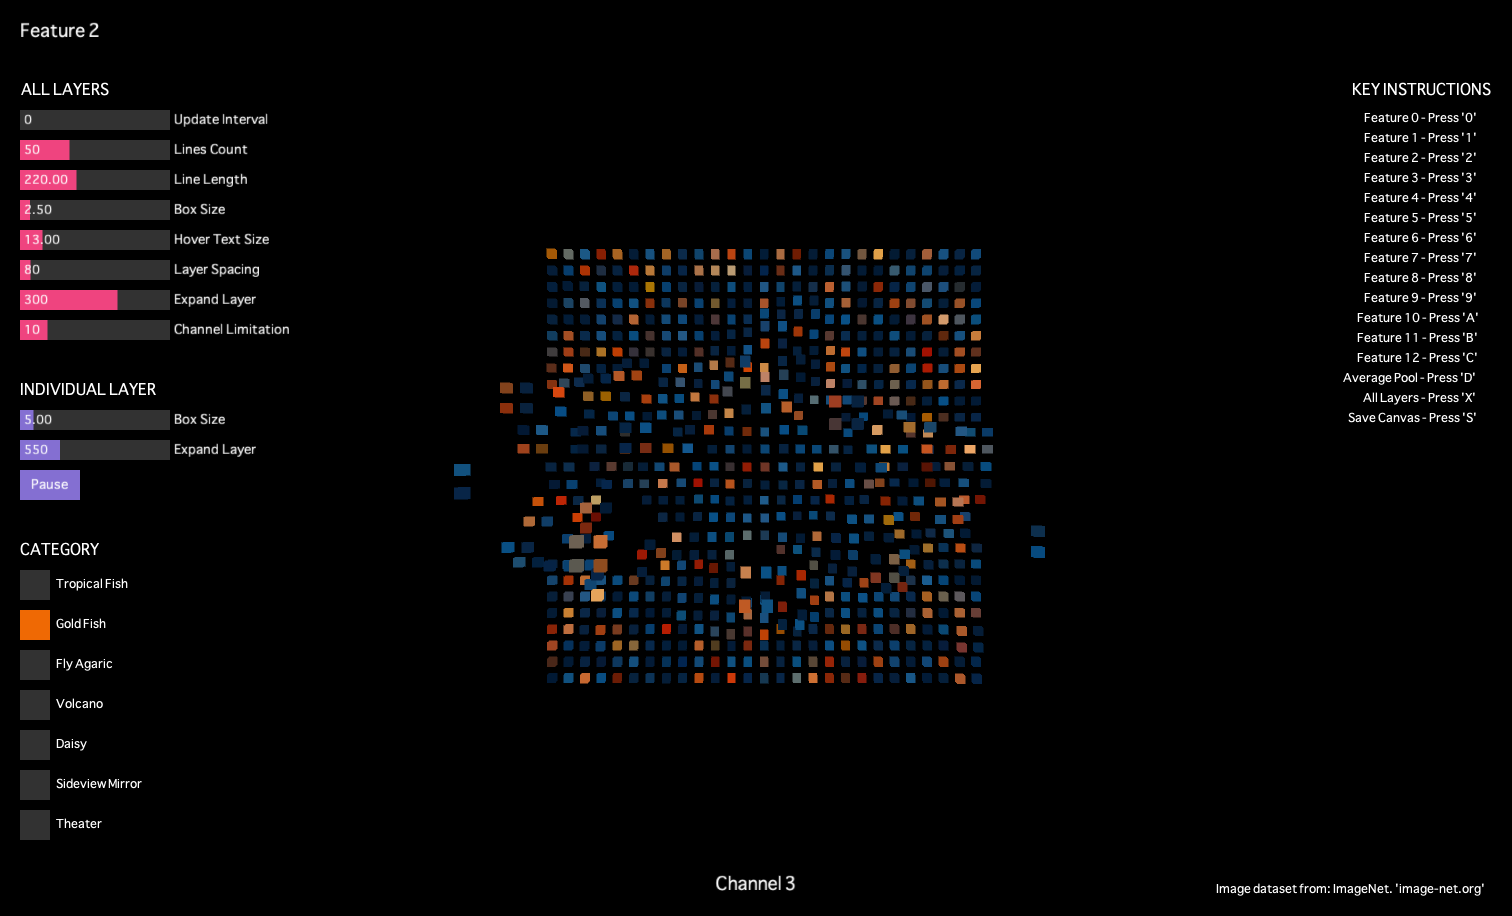
I picked 6 images from the different category image sets in ImageNet. They are labeled as Goldfish, Car Sideview Mirror, Theater, Volcano, Daisy, and Fly Agaric. (These labels are not the original categories as presented in ImageNet, where categories are typically identified by numbers. To enhance clarity, I have assigned descriptive names to these categories.)
Each image's output data encompasses 14 activation layers, with the largest layer mapping out to 55 rows and 55 columns.
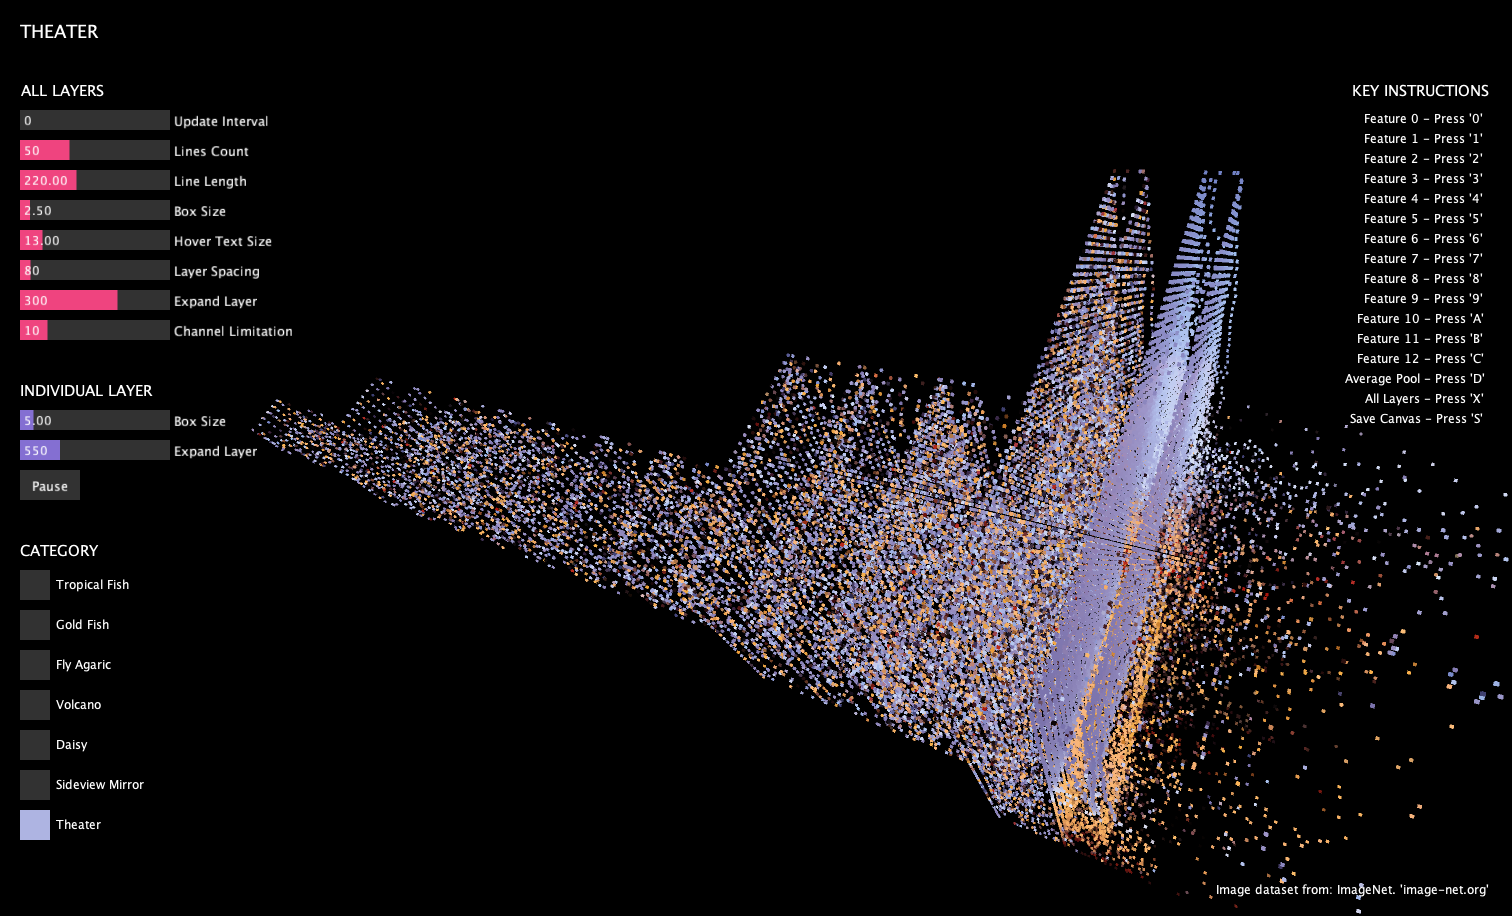
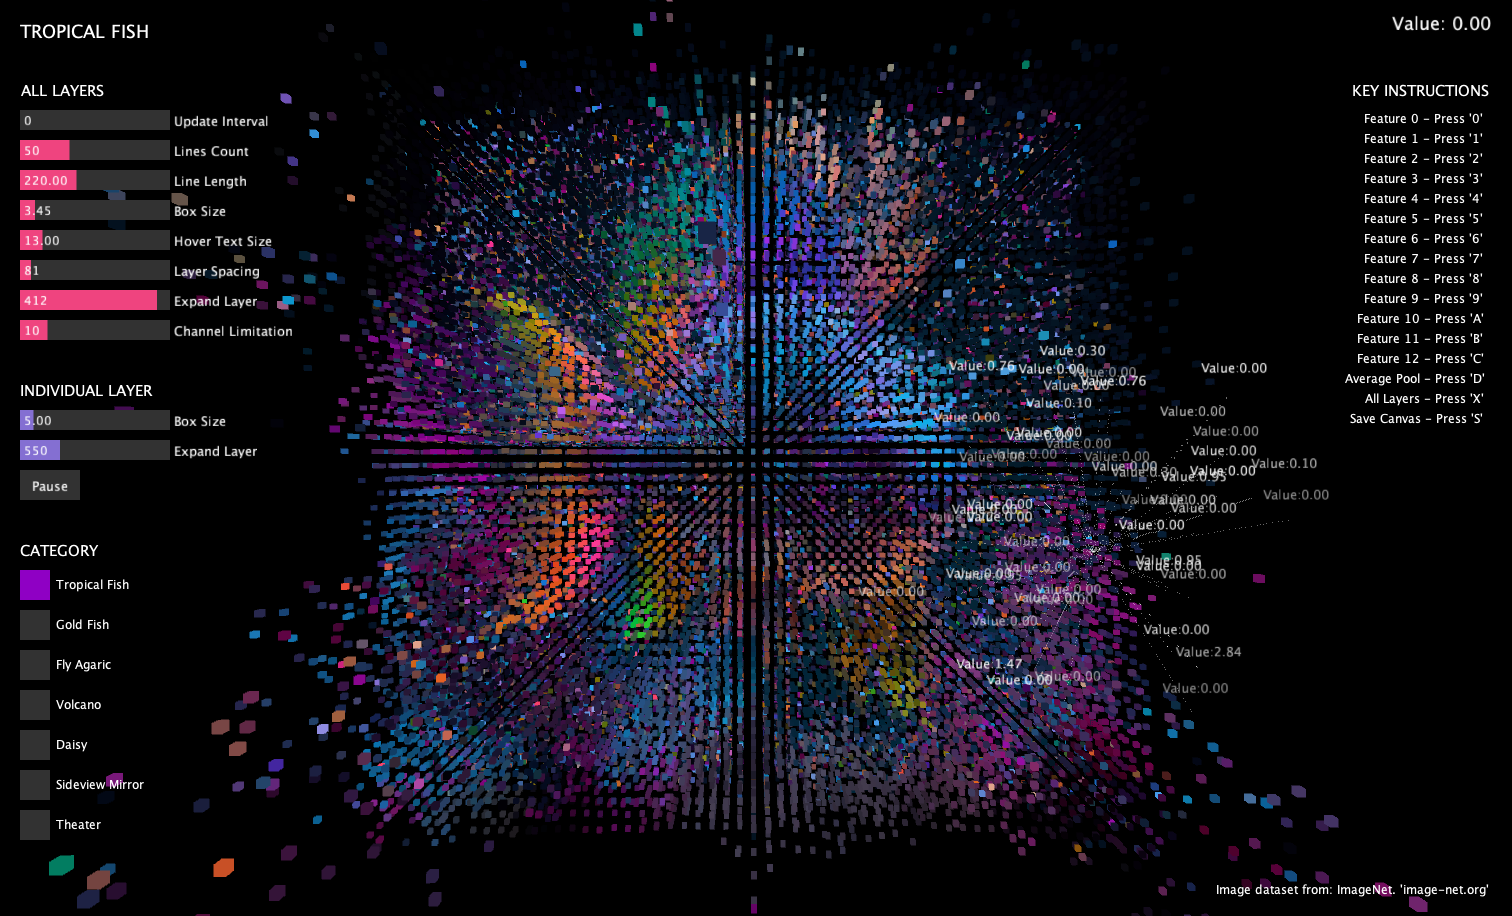
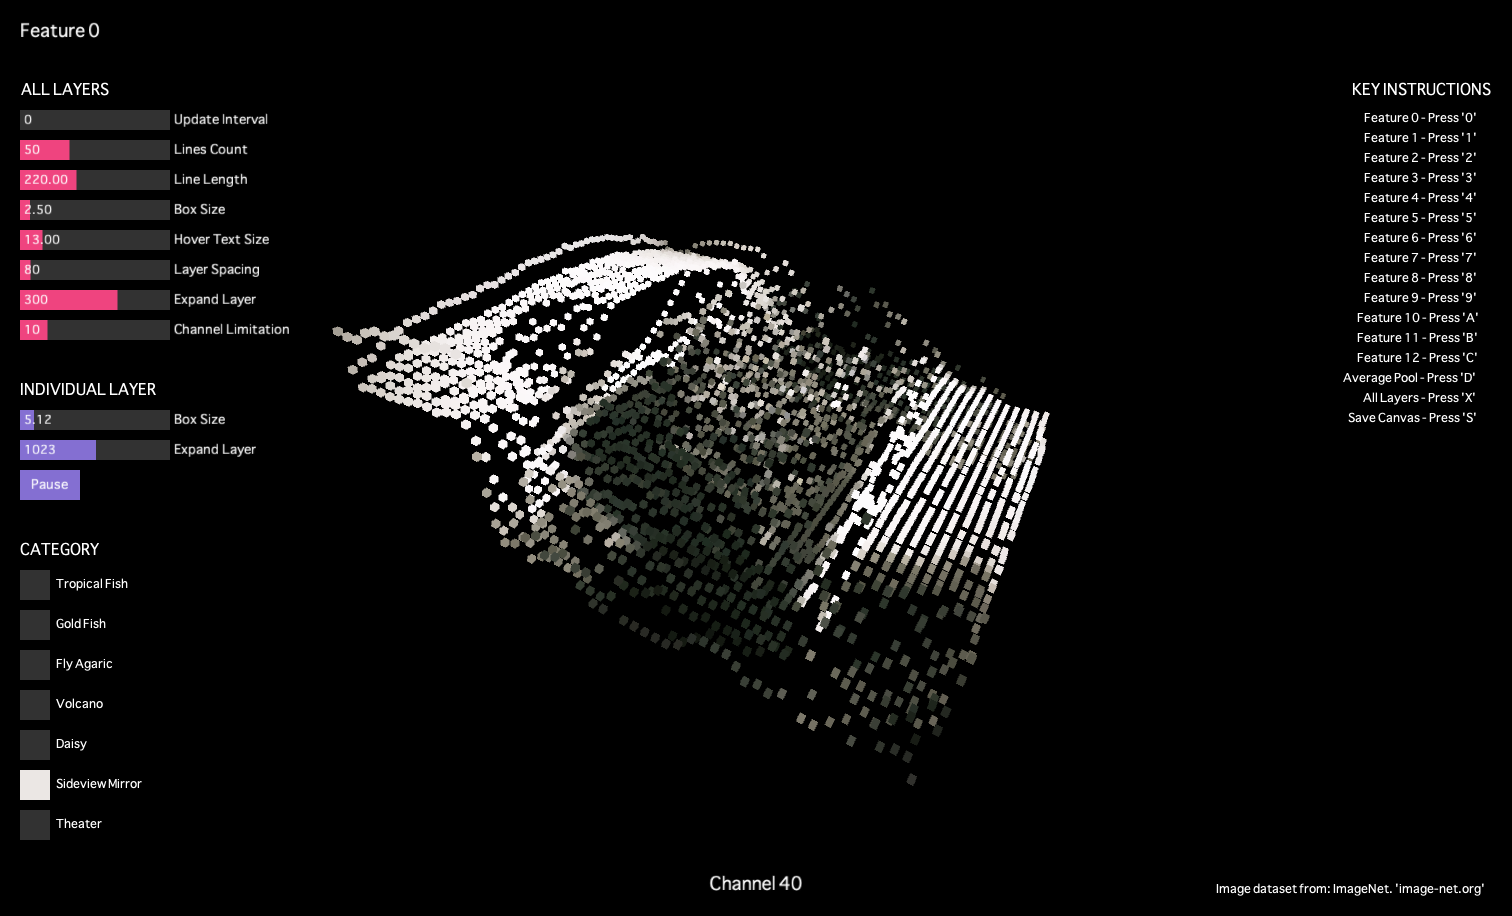
Every layer is composed of multiple channels, and visualization of specific channel layers can be toggled through keyboard inputs.
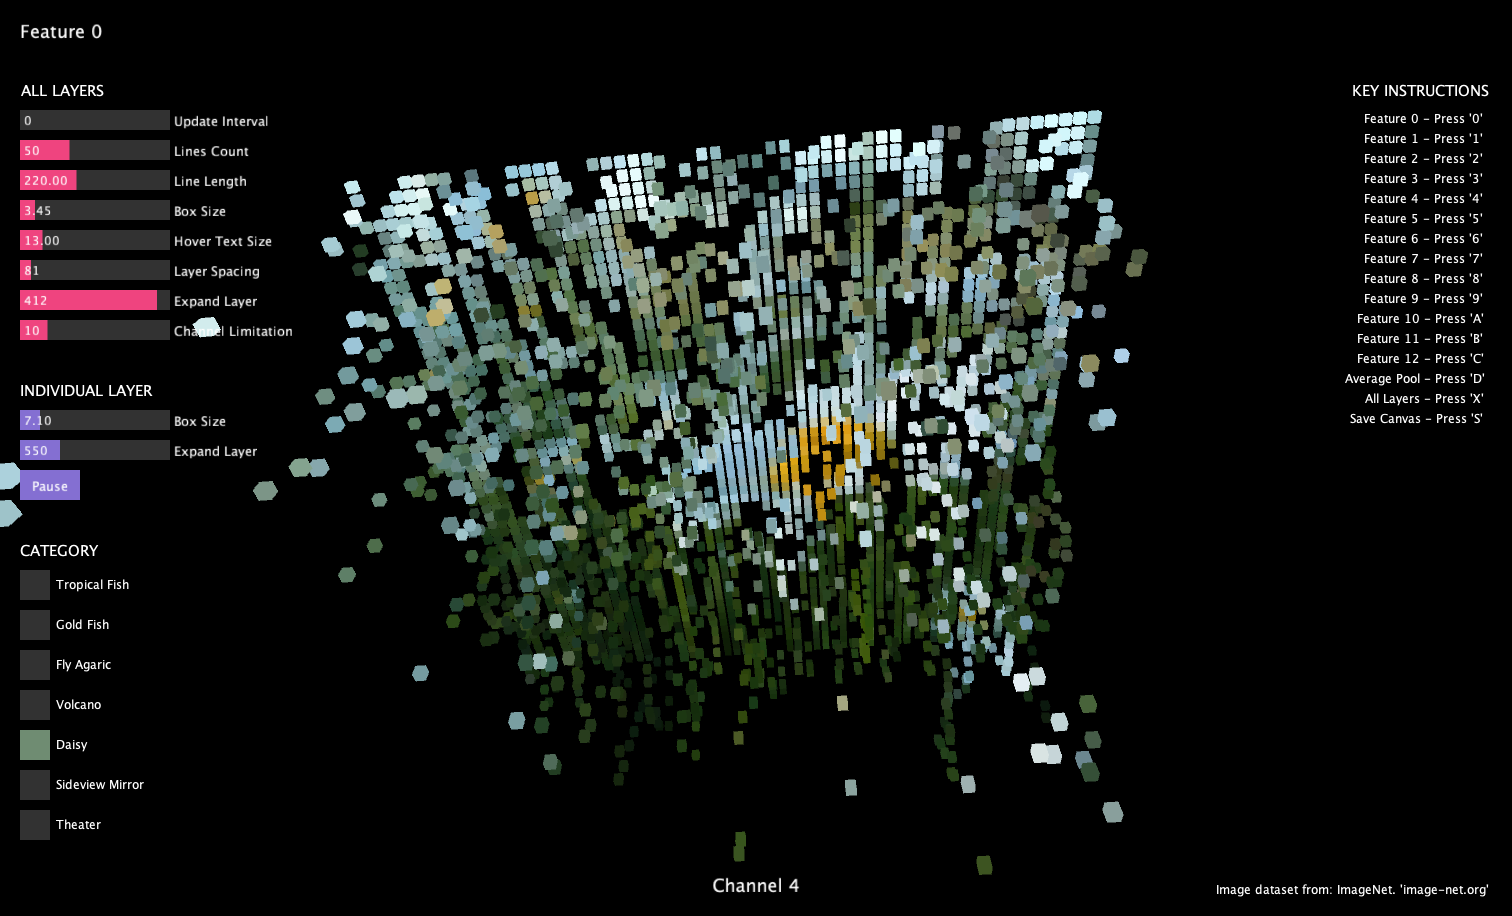
When the mouse hovers over a node, its value is shown in the upper right corner. A set of values displays at the end of lines radiate out in a circular pattern from the mouse cursor, indicate the nearest values to the current mouse position, within a range of 1 to 150.
Using slider control to adjust the node cubes' size, making the original image more clear when the cubes are enlarged.
Each image's output data encompasses 14 activation layers, with the largest layer mapping out to 55 rows and 55 columns.
Every layer is composed of multiple channels, and visualization of specific channel layers can be toggled through keyboard inputs.
When the mouse hovers over a node, its value is shown in the upper right corner. A set of values displays at the end of lines radiate out in a circular pattern from the mouse cursor, indicate the nearest values to the current mouse position, within a range of 1 to 150.
Using slider control to adjust the node cubes' size, making the original image more clear when the cubes are enlarged.
Final result
Video
We can notice the patterns that emerge as we explore different layers. These patterns represent the model recognize and interpret various aspects of the input image. So this project aims to make these abstract processes tangible, providing insights into how deep learning models 'see' and 'understand' the images.
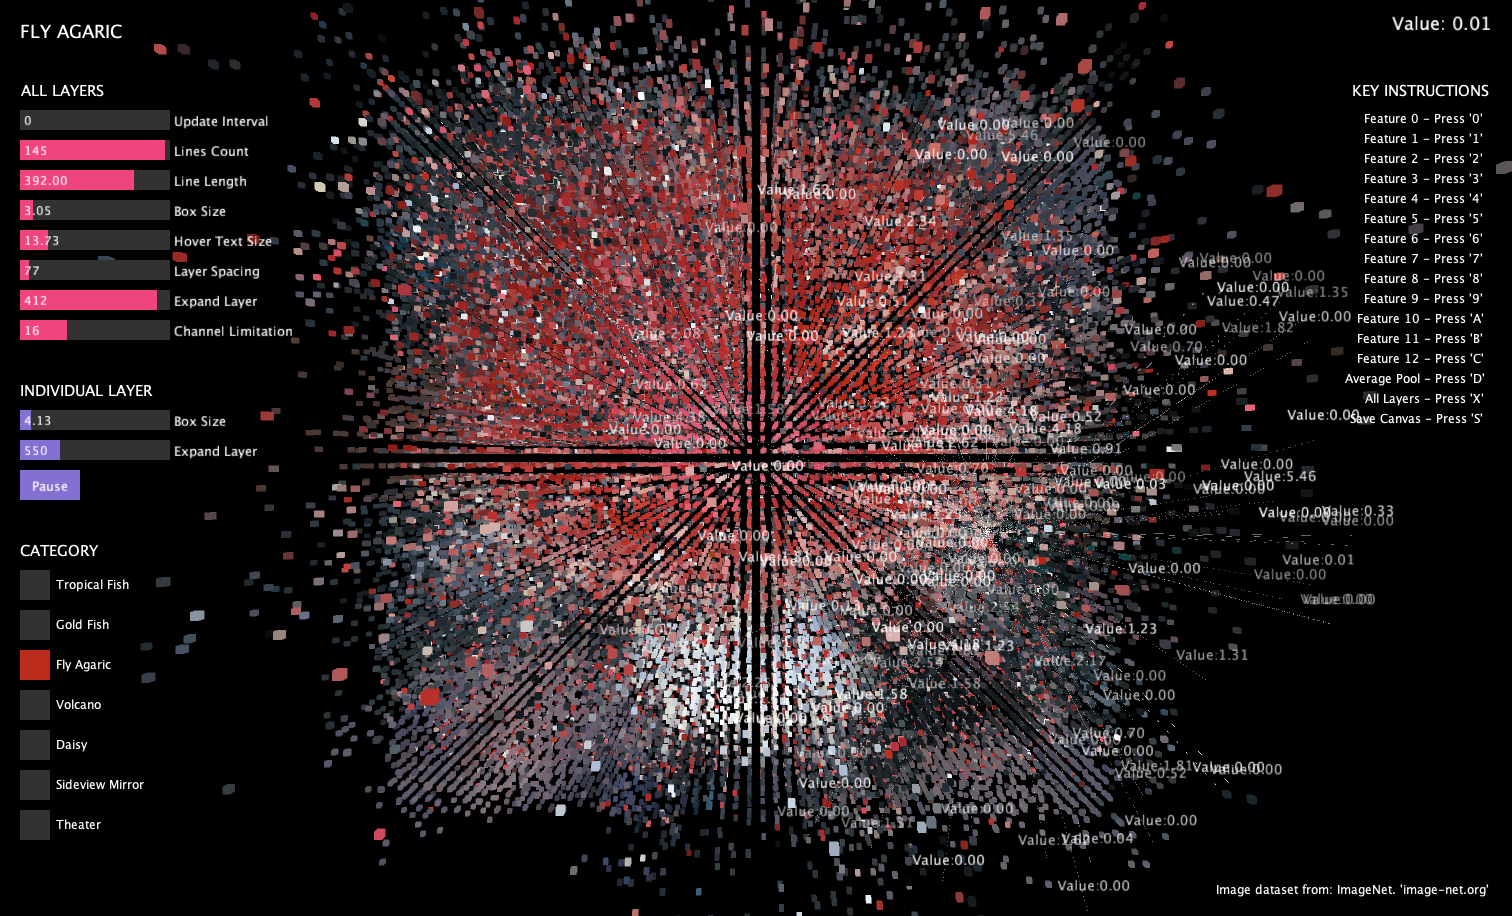
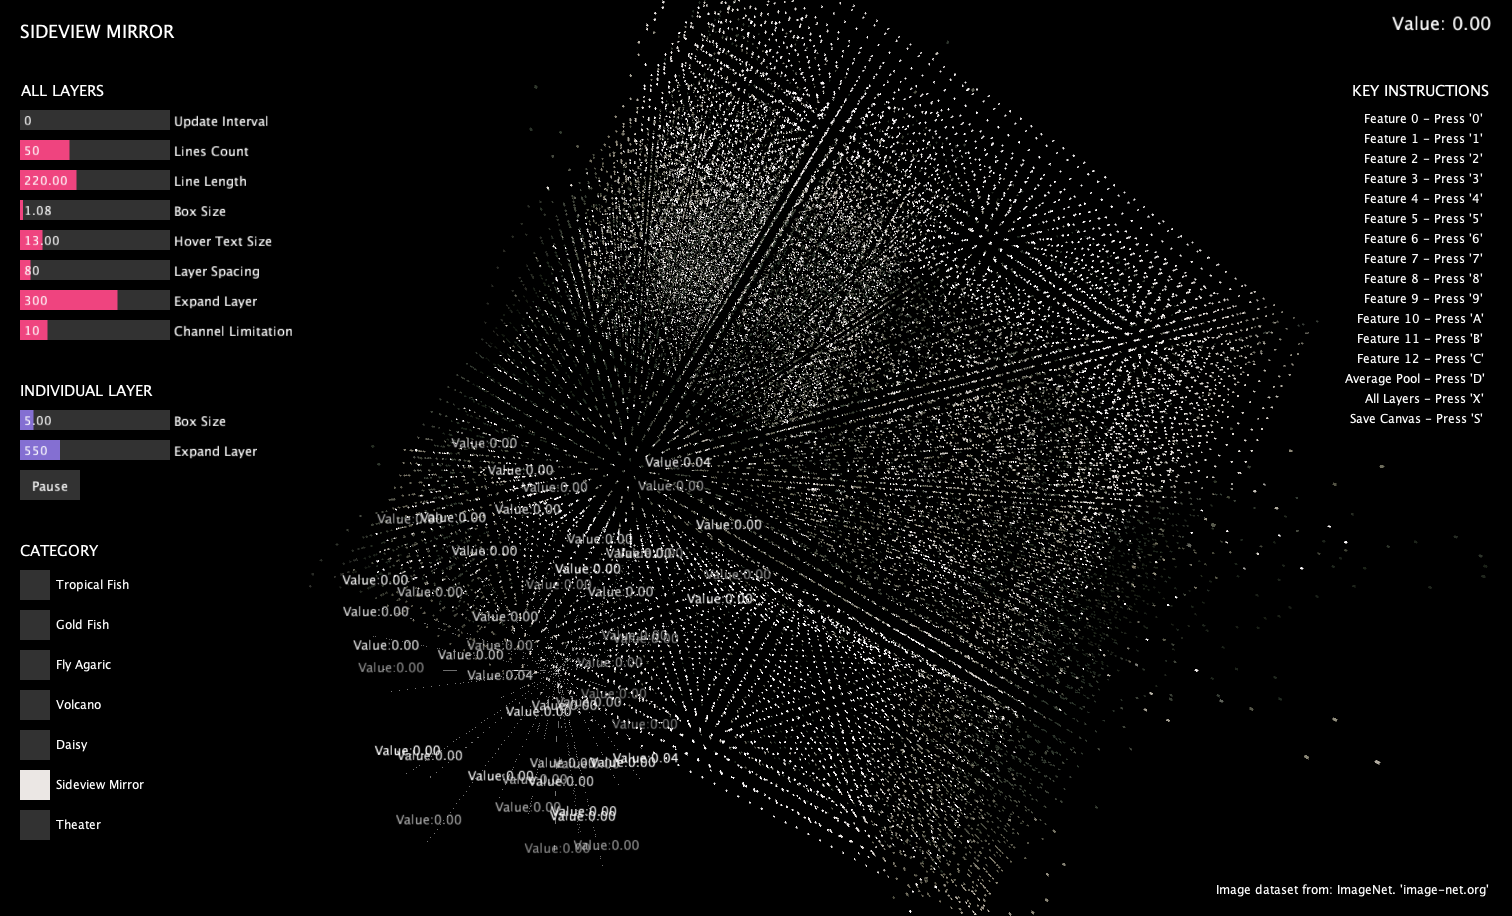
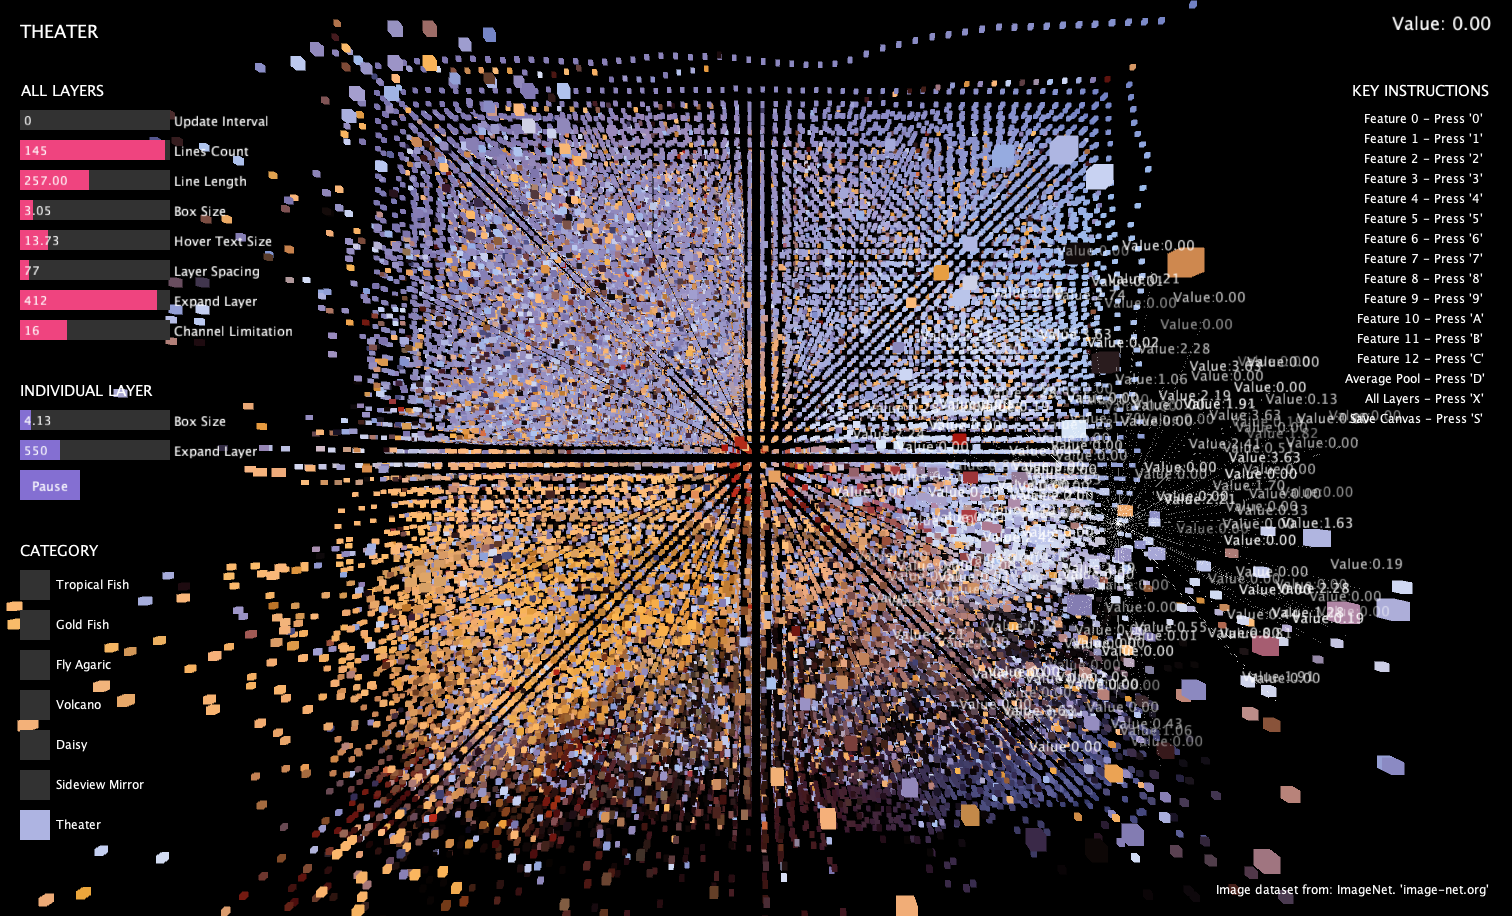
As we navigate through the layers, we might notice how the complexity of patterns changes. Early layers might capture features like edges and shapes, but deeper layers begin to represent more complex aspects of the images.
We can notice the patterns that emerge as we explore different layers. These patterns represent the model recognize and interpret various aspects of the input image. So this project aims to make these abstract processes tangible, providing insights into how deep learning models 'see' and 'understand' the images.
As we navigate through the layers, we might notice how the complexity of patterns changes. Early layers might capture features like edges and shapes, but deeper layers begin to represent more complex aspects of the images.
Code