Outer Rim - A Celestial Cartography of Exoplanets
MAT 259, 2016
Nefeli Manoudaki
Concept
Outer Rim offers a comprehensive visual representation of exoplanets, capturing their discovery timeline, physical properties, and orbital characteristics in a minimalistic spherical model. Looking through the online resources provided a timeline approach seemed like an interesting path to approach. Some important links are: The general website of the exoplanets:
https://exoplanets.nasa.gov/
Their visualization of the exoplanets in the Milky Way:
https://exoplanets.nasa.gov/eyes-on-exoplanets/
Their Historic timeline:
https://exoplanets.nasa.gov/alien-worlds/historic-timeline/#first-planetary-disk-observed .
Query
The NASA Exoplanet Archive serves as a comprehensive repository of data on all known exoplanets, those planets orbiting stars beyond our solar system, compiled from NASA’s space missions, terrestrial observatories, and various other sources. It provides a spectrum of detailed information, including but not limited to, each planet’s designation, mass, size, orbital distance, and period, along with key physical traits. Additionally, the archive encompasses data on the parent stars, cataloging aspects like nomenclature, mass, and dimensions. Continuously updated to reflect new discoveries, this archive stands as an essential tool for astronomers and researchers delving into the study and patterns of exoplanets across the Milky Way.The connection to their API is available to everyone and these are this is the language for the query:
https://exoplanetarchive.ipac.caltech.edu/docs/program_interfaces.html.
I decided to use their online archive database, where you can select and filter and export through their archive. This is the link: This is the archive online where you can select and extract most of the data:
https://exoplanetarchive.ipac.caltech.edu/cgi-bin/TblView/nph-tblView?app=ExoTbls&config=PS&constraint=default_flag=1&constraint=disc_facility+like+%27%25TESS%25%27
There was a lot of cleaning that needed to be done manually.
I decided to extract a table with this data:
name(Name of the planet as per given by NASA), distance (distance of the planet from earth in light years), stellar_magnitude (Brightness of the planet, the brighter the planet the lower number is assigned to the planet), planet_type (Type of the planet, these types are derived from our solar system planets),
discovery_year(Year in which planet got discovered), mass_multiplier (mass multiplier of the planet with mass_wrt planet), mass_wrt (mass of the planet in comparison with the mass of planets of our solar system), radius_multiplier (radius multiplier of the planet with radius_wrt planet), radius_wrt (radius of the planet in comparison with the radius of planets of our solar system),
orbital_radius(Orbital radius of planets orbiting around their sun (in AU)), orbital_period (Time in years taken by those planets to complete 1 orbit of their star), eccentricity (eccentricity basically tells how circular is the orbitting path), detection_method(Method used by NASA to find that exoplanet).
Preliminary sketches
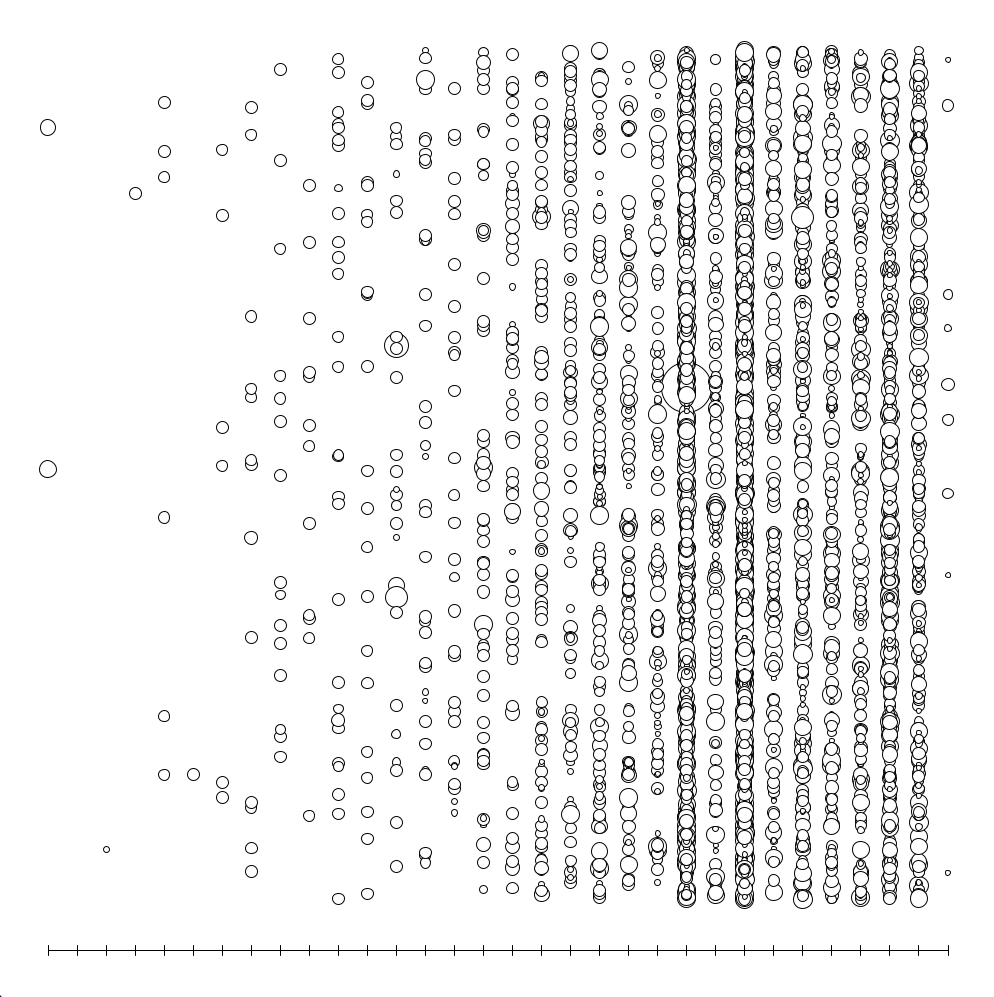
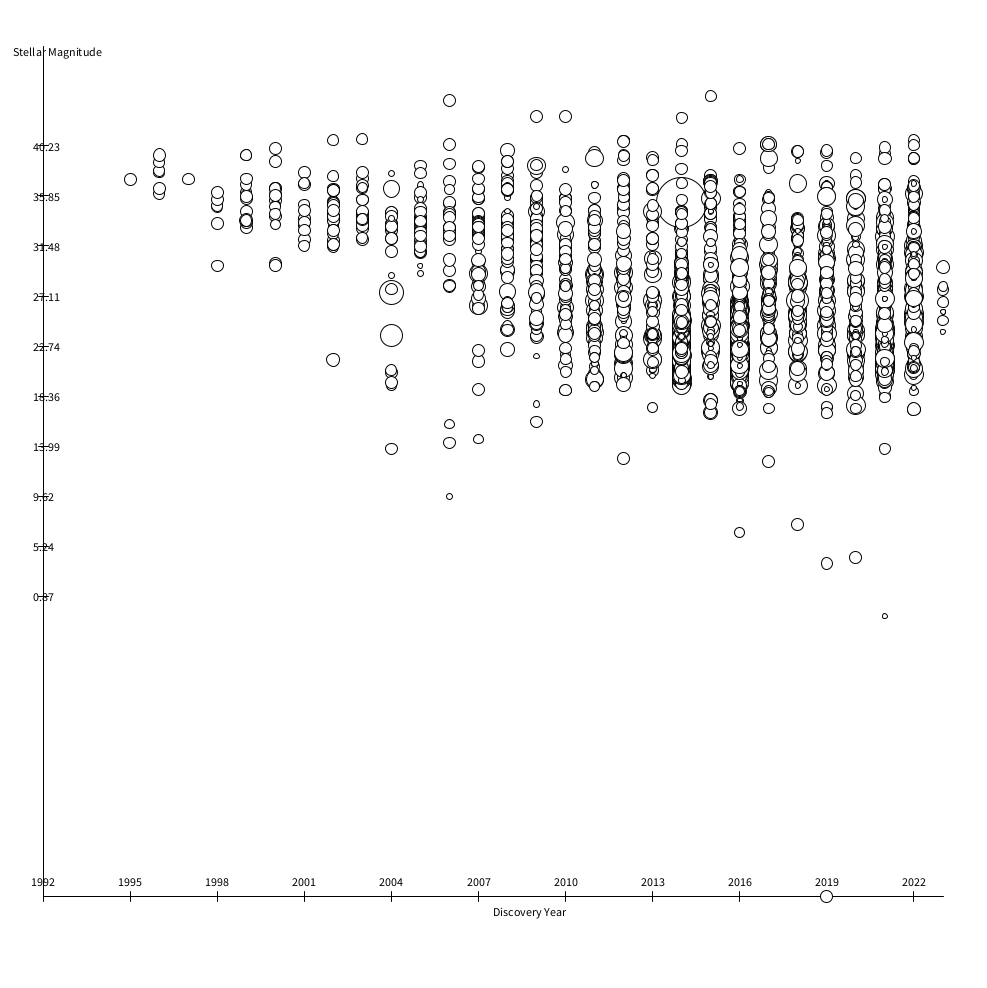
The initial phase of ideation involved generating sketches that spatially arranged exoplanets based on their discovery year and randomly on the Y-axis. These sketches served as the conceptual foundation, aiding in visualizing the distribution and relational dynamics of exoplanets before progressing to the 3 dimensional distribution.
Process
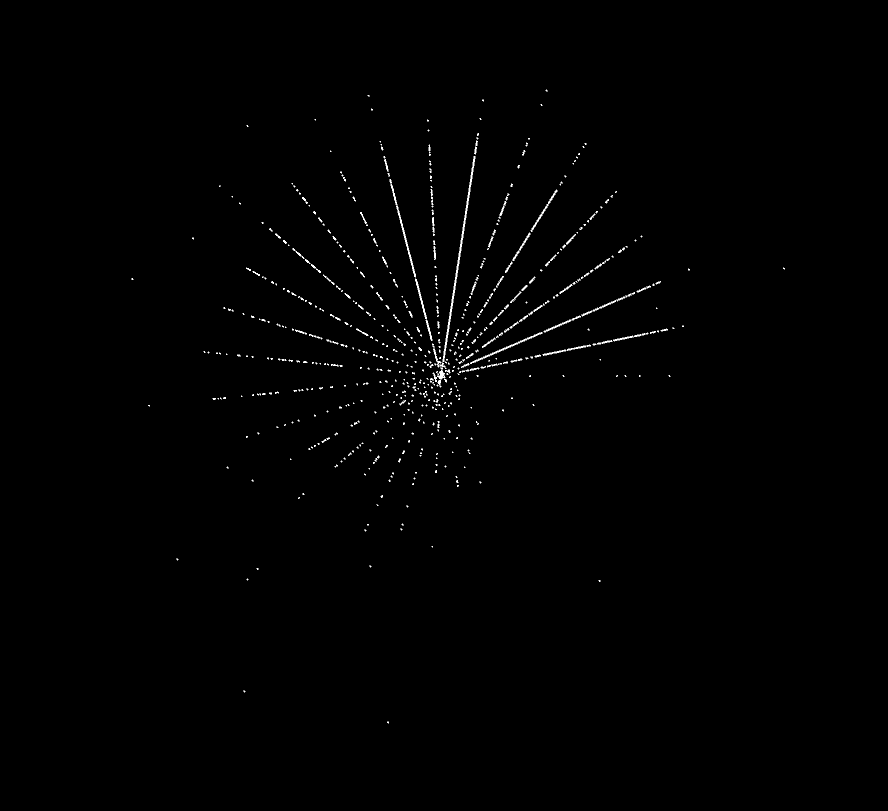
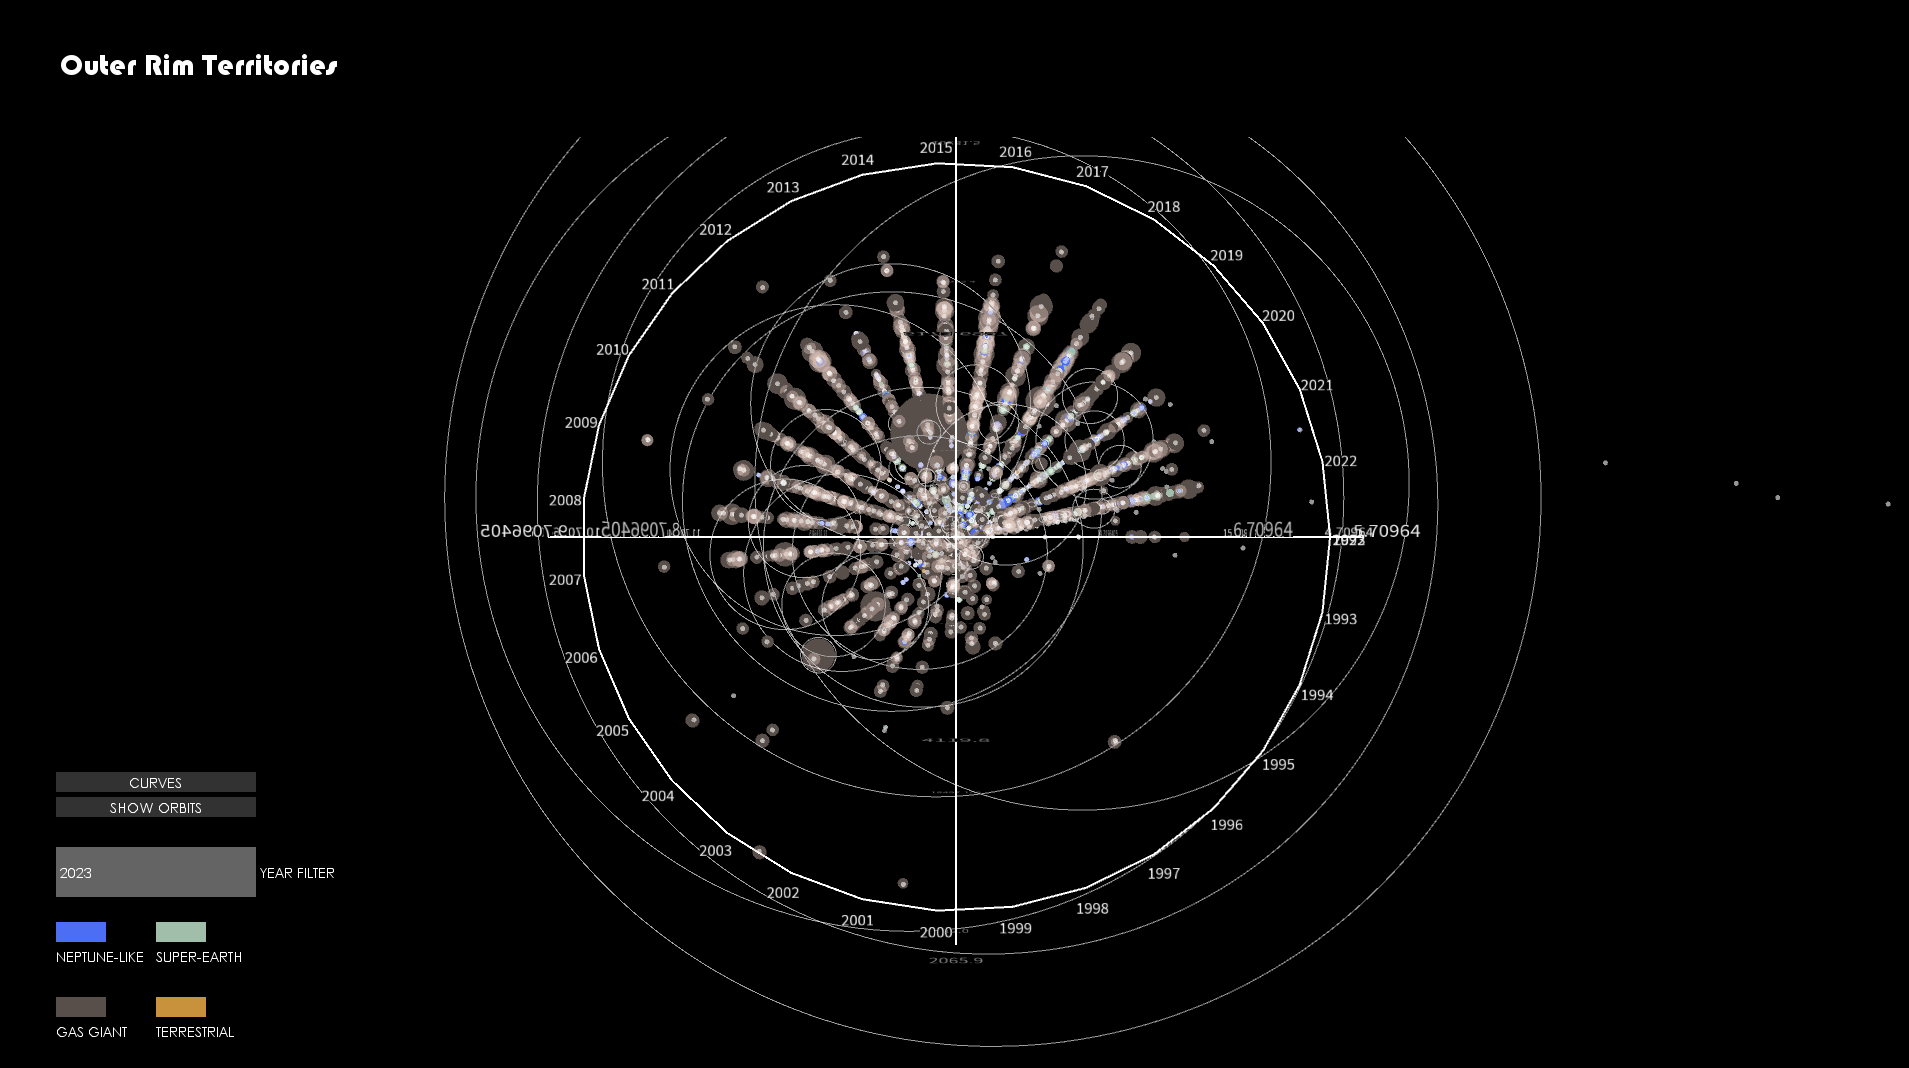
Transitioning from ideation to execution, the project's scope evolved into a spherical 3D visualization capturing the essence of exoplanetary discovery over time. It contextualizes each planet within the Milky Way, accounting for their discovery year, stellar magnitude, and the light-years distancing them from Earth.
The construction of the final visualization was an iterative process, incrementally integrating additional layers of data. This included the representation of exoplanet types through a color-coded system and the comparative scale of planetary radii represented as stroke weights. Orbits were depicted as circles, their radii indicating the exoplanets' orbital paths around their stars, with eccentricity hinting at the orbit's circularity.
The orbital period was also incorporated, reflecting the time taken for a complete orbit around the star.
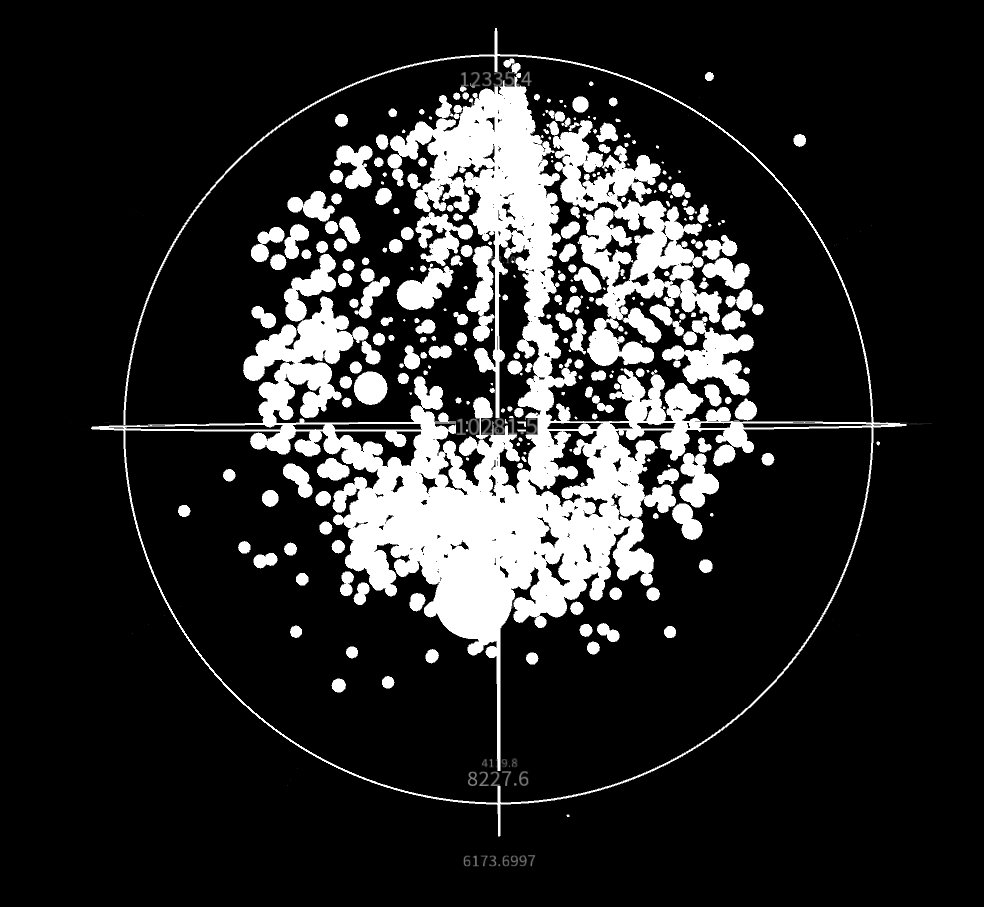
Final result
The "Outer Rim" visualization culminates in a dynamic interface that enables users to delve into the expanse of exoplanetary discoveries. This interactive model allows for the filtering of planets by type, offering a tailored view into the variety of planetary bodies that inhabit our galaxy.
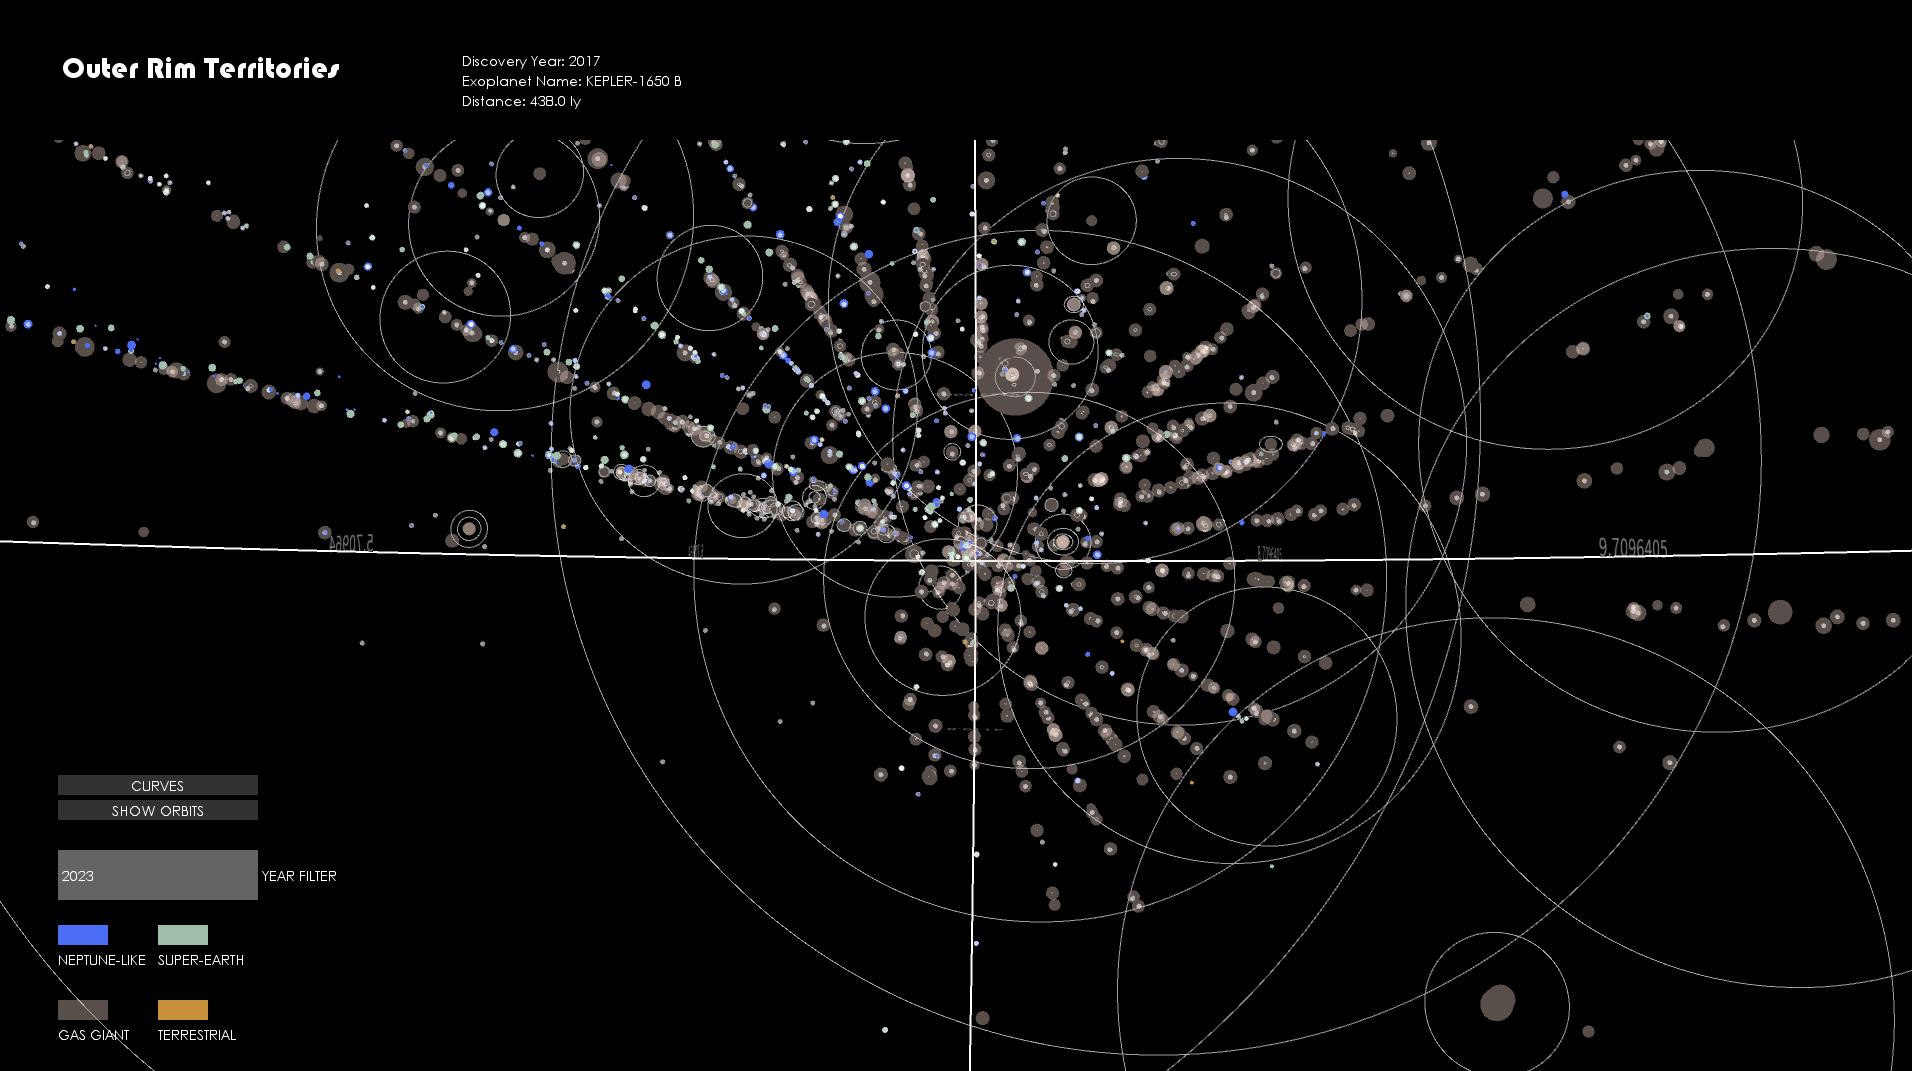
Orbit circles, delineating the paths of these celestial entities around their stars, can be toggled on or off, providing a clearer perspective of their cosmic trajectories. Additionally, the interface incorporates fundamental axes that represent key celestial metrics, which users can choose to display for a comprehensive understanding of the spatial distribution.
Interactive elements enhance the user experience further: hovering over any exoplanet reveals its name, year of discovery, and its light-year distance from Earth, inviting an engaging exploration that connects the observer directly with the data. This feature enriches the narrative of each planet, bridging the gap between astronomical data and personal discovery.
Through these interface capabilities, "Outer Rim" not only visualizes but also vivifies the silent ballet of exoplanets, making the cosmic scale both accessible and enlightening.
Code