User-created friendship bracelet patterns on BraceletBook.com
MAT 259, 2023
Yanchen Lu
Concept
For this project, I want to analyze the user-created patterns on a popular make community forum BraceletBook.com, by visualizing the pattern data in a 3D space.
The relationships between the number of strings, number of colors used in a pattern, the numbers of rows aka the length of the pattern, as well as contributor identities (users who uploaded patterns) are what I want to explore.
The relationships between the number of strings, number of colors used in a pattern, the numbers of rows aka the length of the pattern, as well as contributor identities (users who uploaded patterns) are what I want to explore.
Query
I scraped webpage data from BraceletBook.com using BeautifulSoup. The webscraping code is included in `scrape.py` in the source code zipfile.
The resulting dataset contains pattern data from the creation of the website to Mar. 6th, 2023. The CSV has around 63K+ rows.
The dataset has the following information:
- id (int)
- pattern_url (string)
- preview_url_list (list of string), [preview_url, preview_urlx2, preview_urlx3]
- dimensions (list of int), [cols, rows]
- num_strings (int)
- num_colors (int)
- contributor_name (string)
- contributor_url (string)
Preliminary sketches
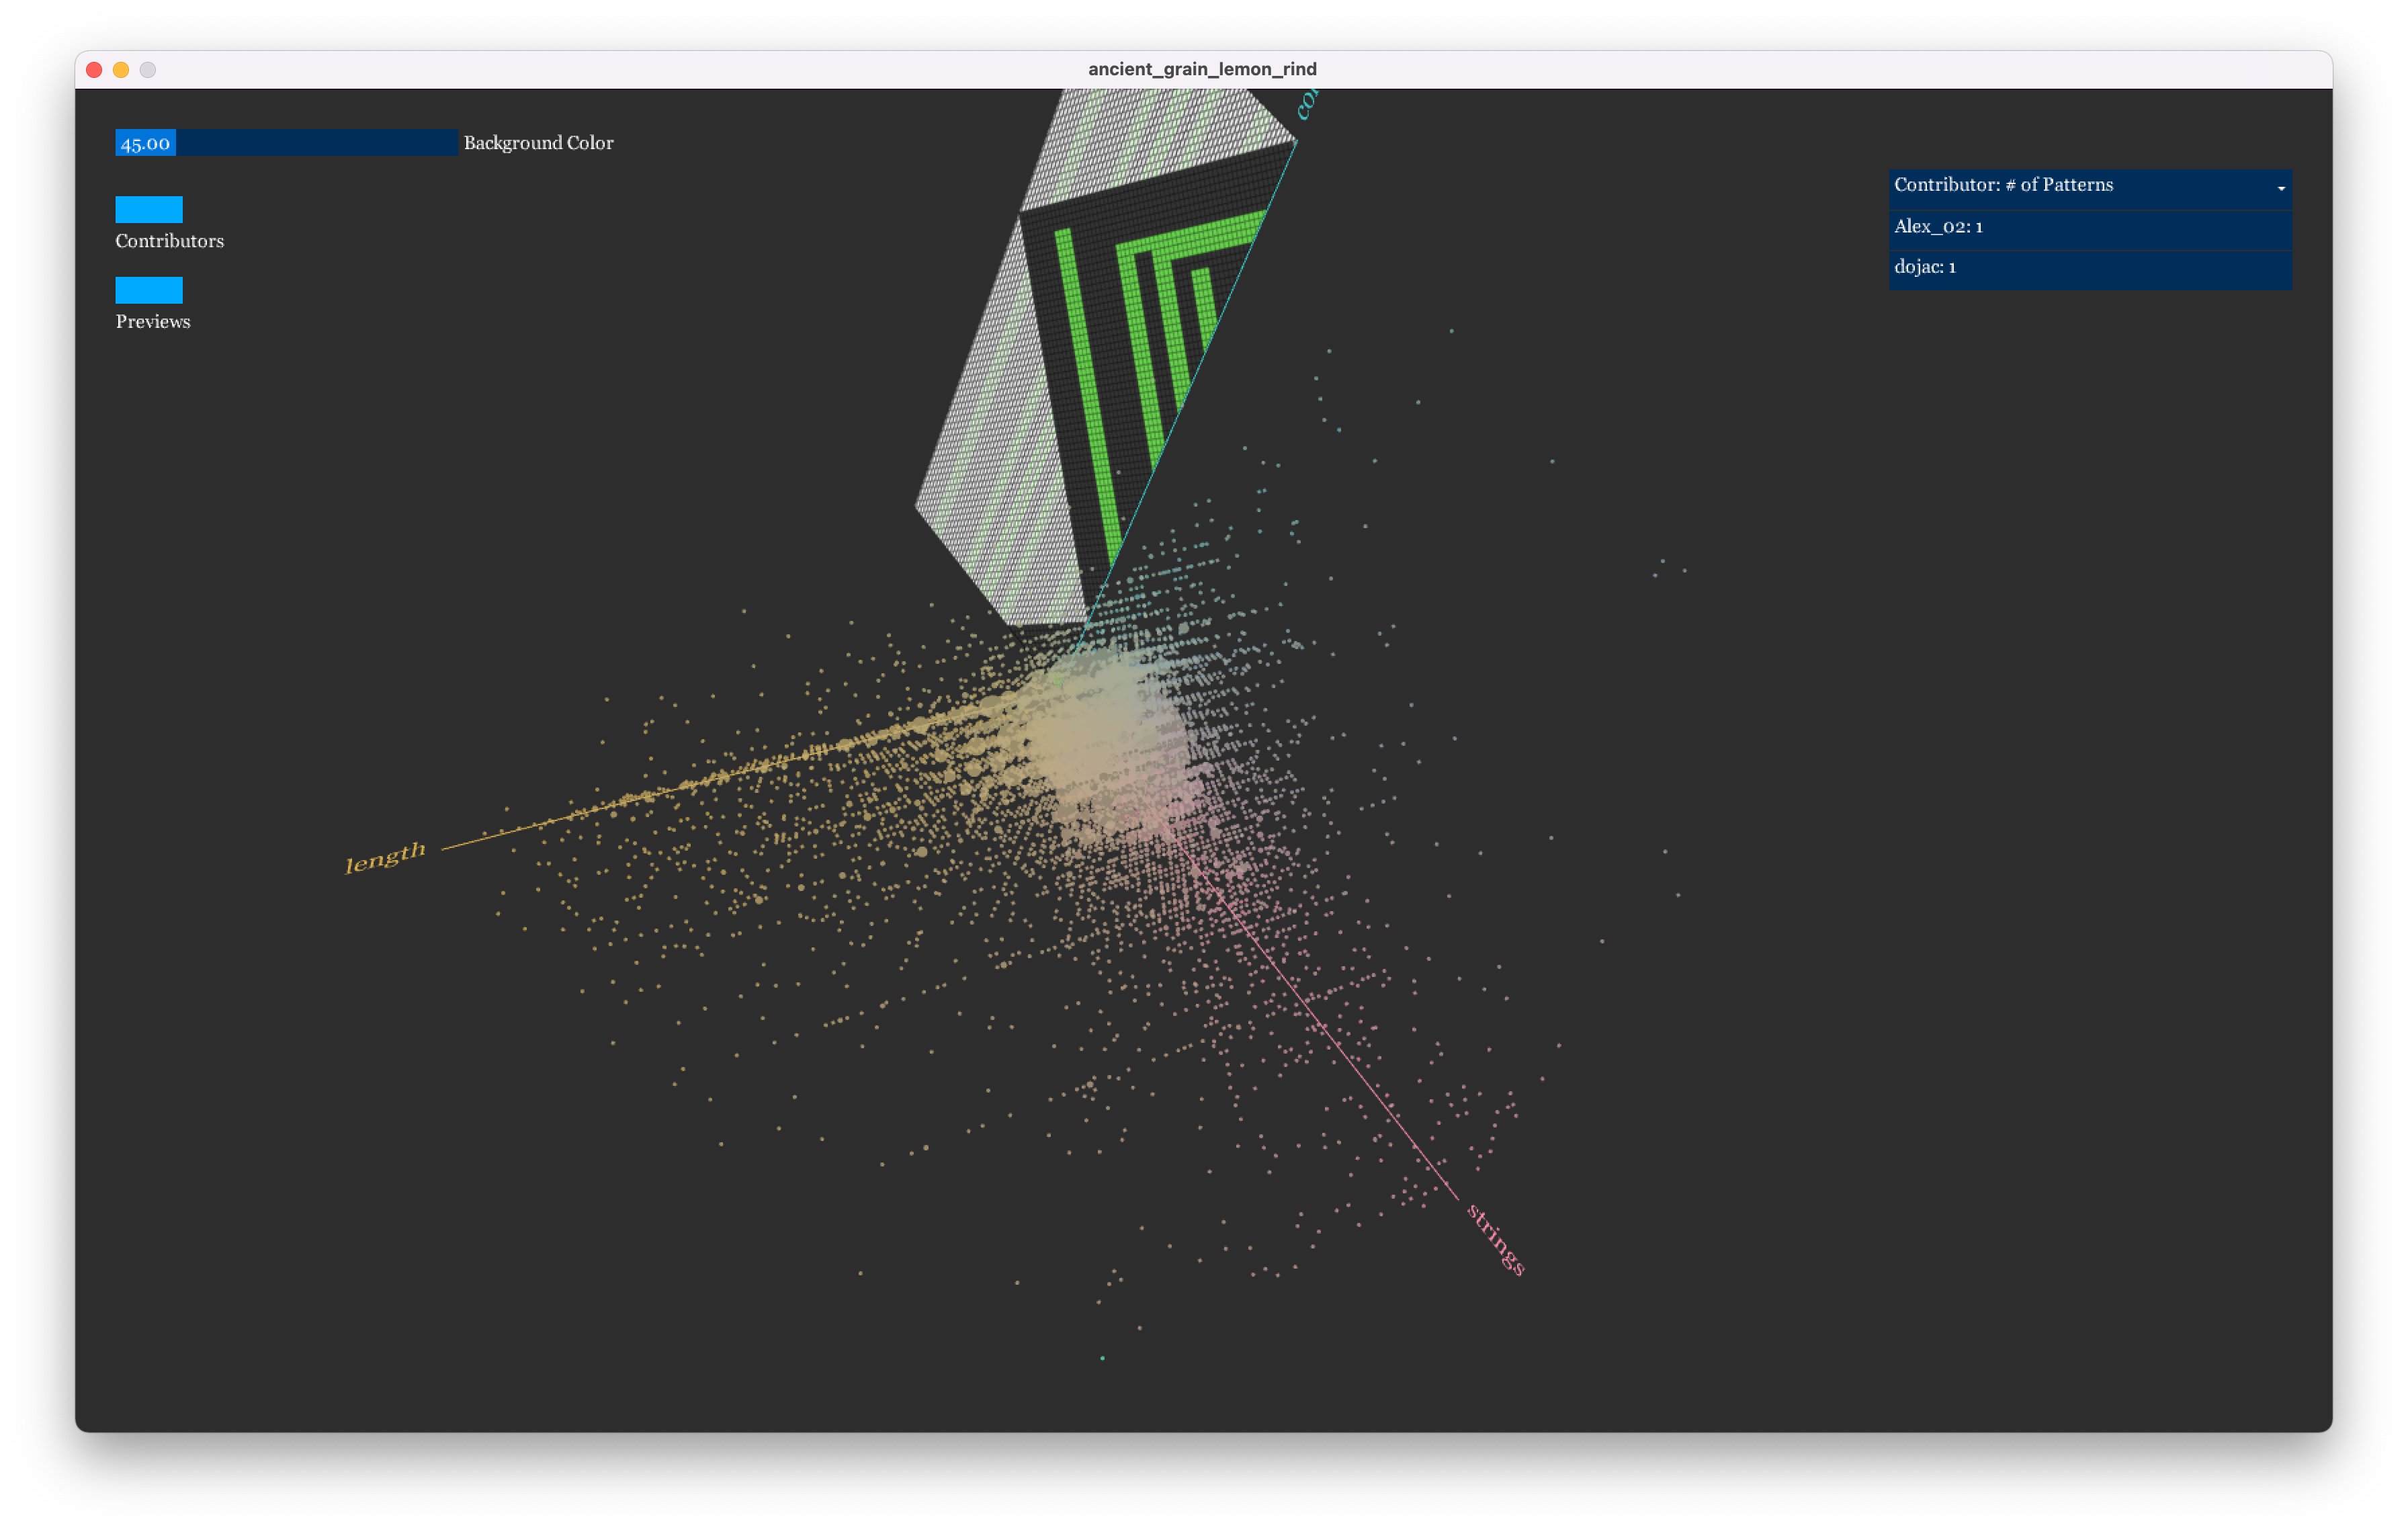
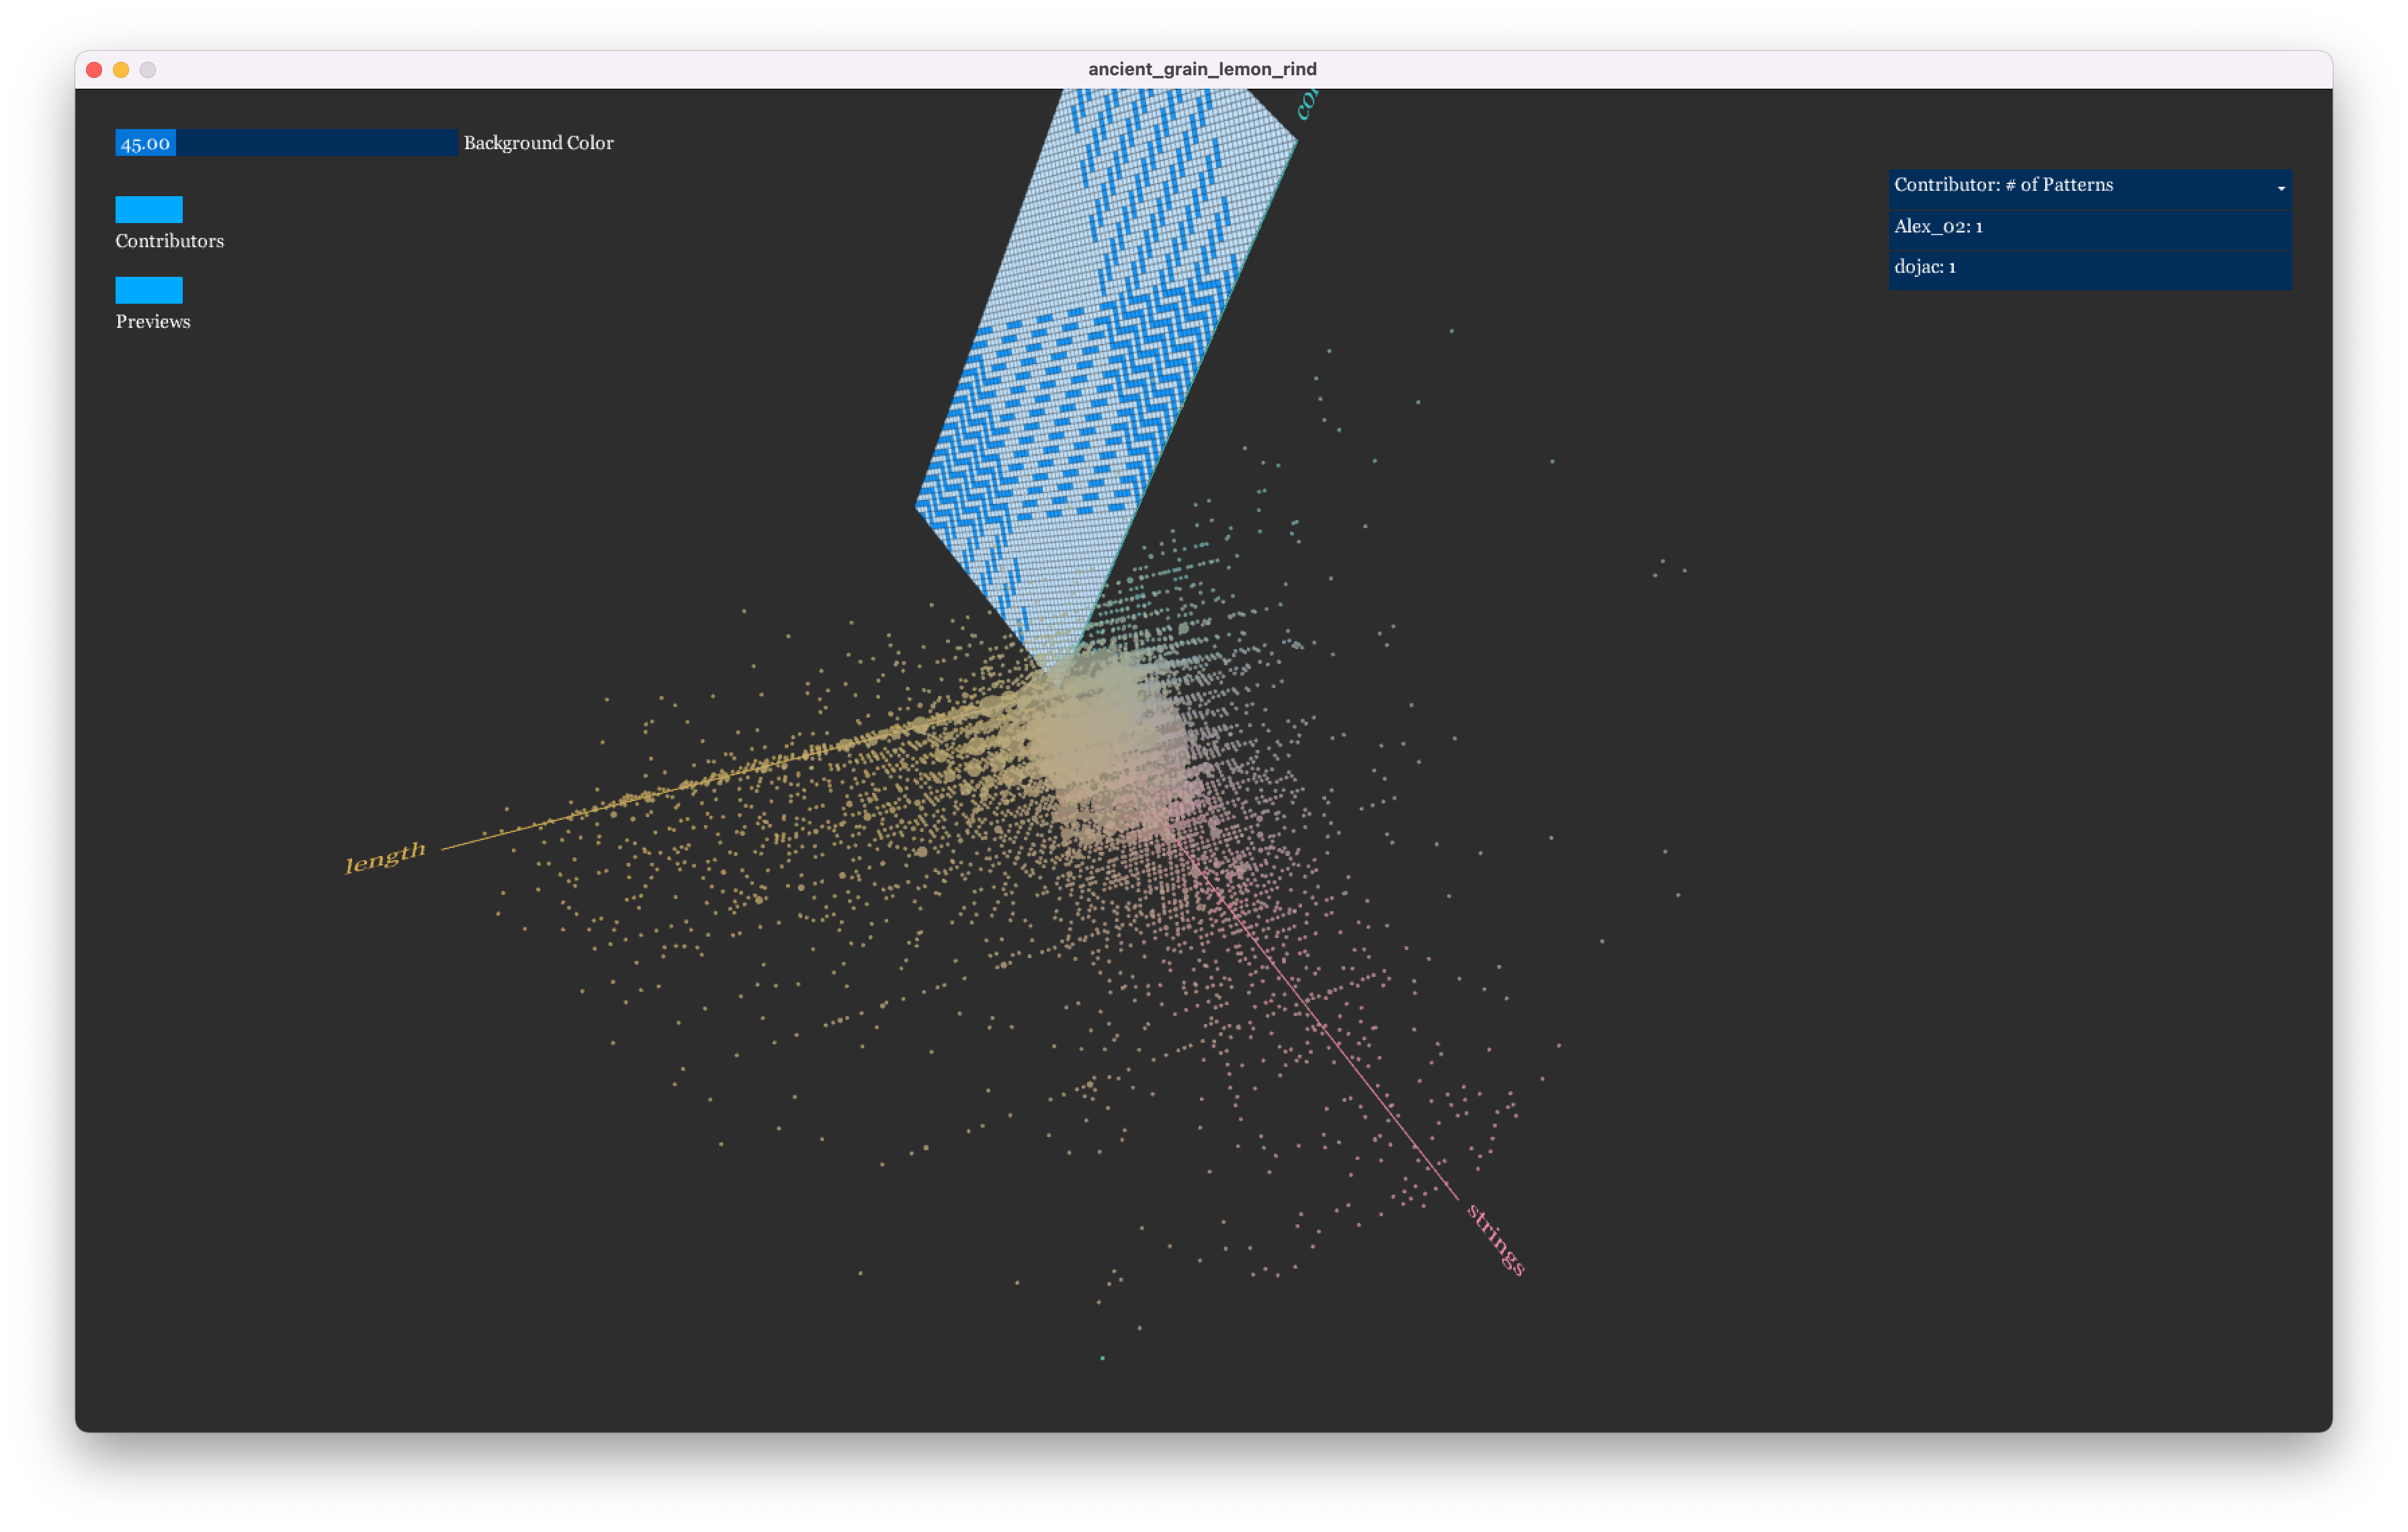
I first plotted all the datapoints in the 3D space using the dimensions of the patterns, with num_strings as the x-axis, num_colors as the y_axis, and rows as the z_axis.
Since there are significant overlaps between data points at the same coordinates, I decided to change the strokeWeight aka size of each point depending on the number of points located at its coordinates.
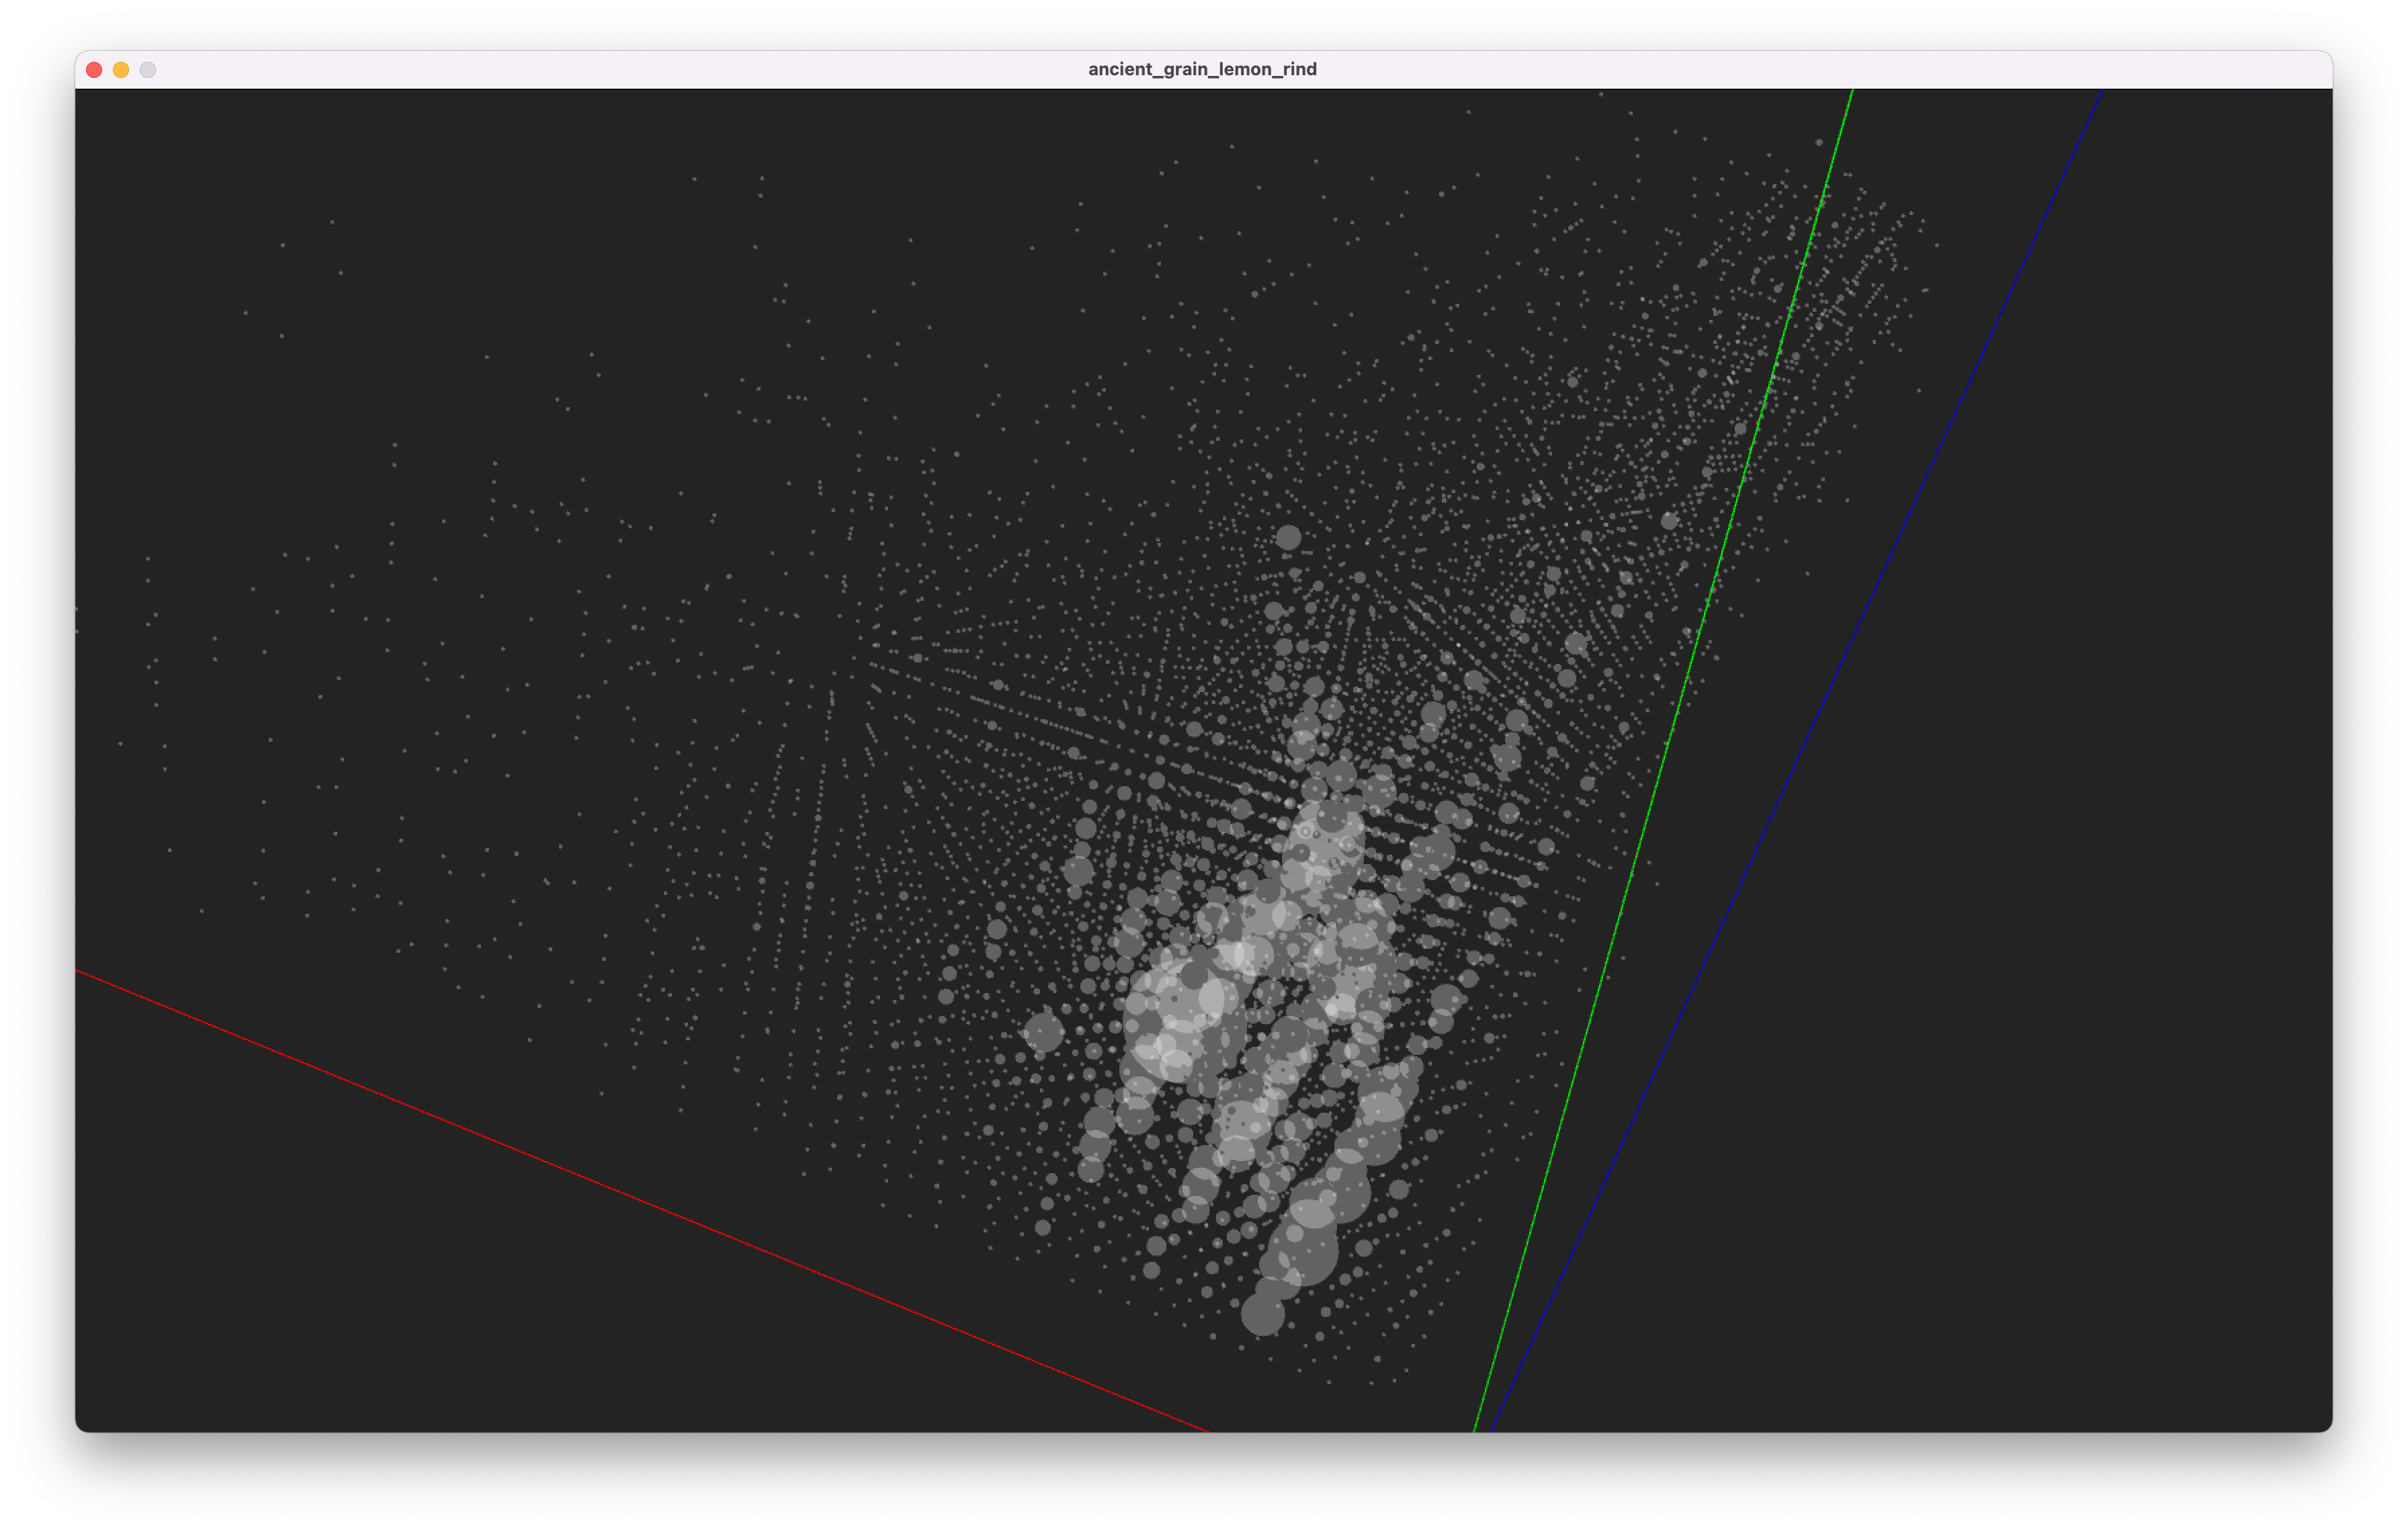
Since there are significant overlaps between data points at the same coordinates, I decided to change the strokeWeight aka size of each point depending on the number of points located at its coordinates.
Process
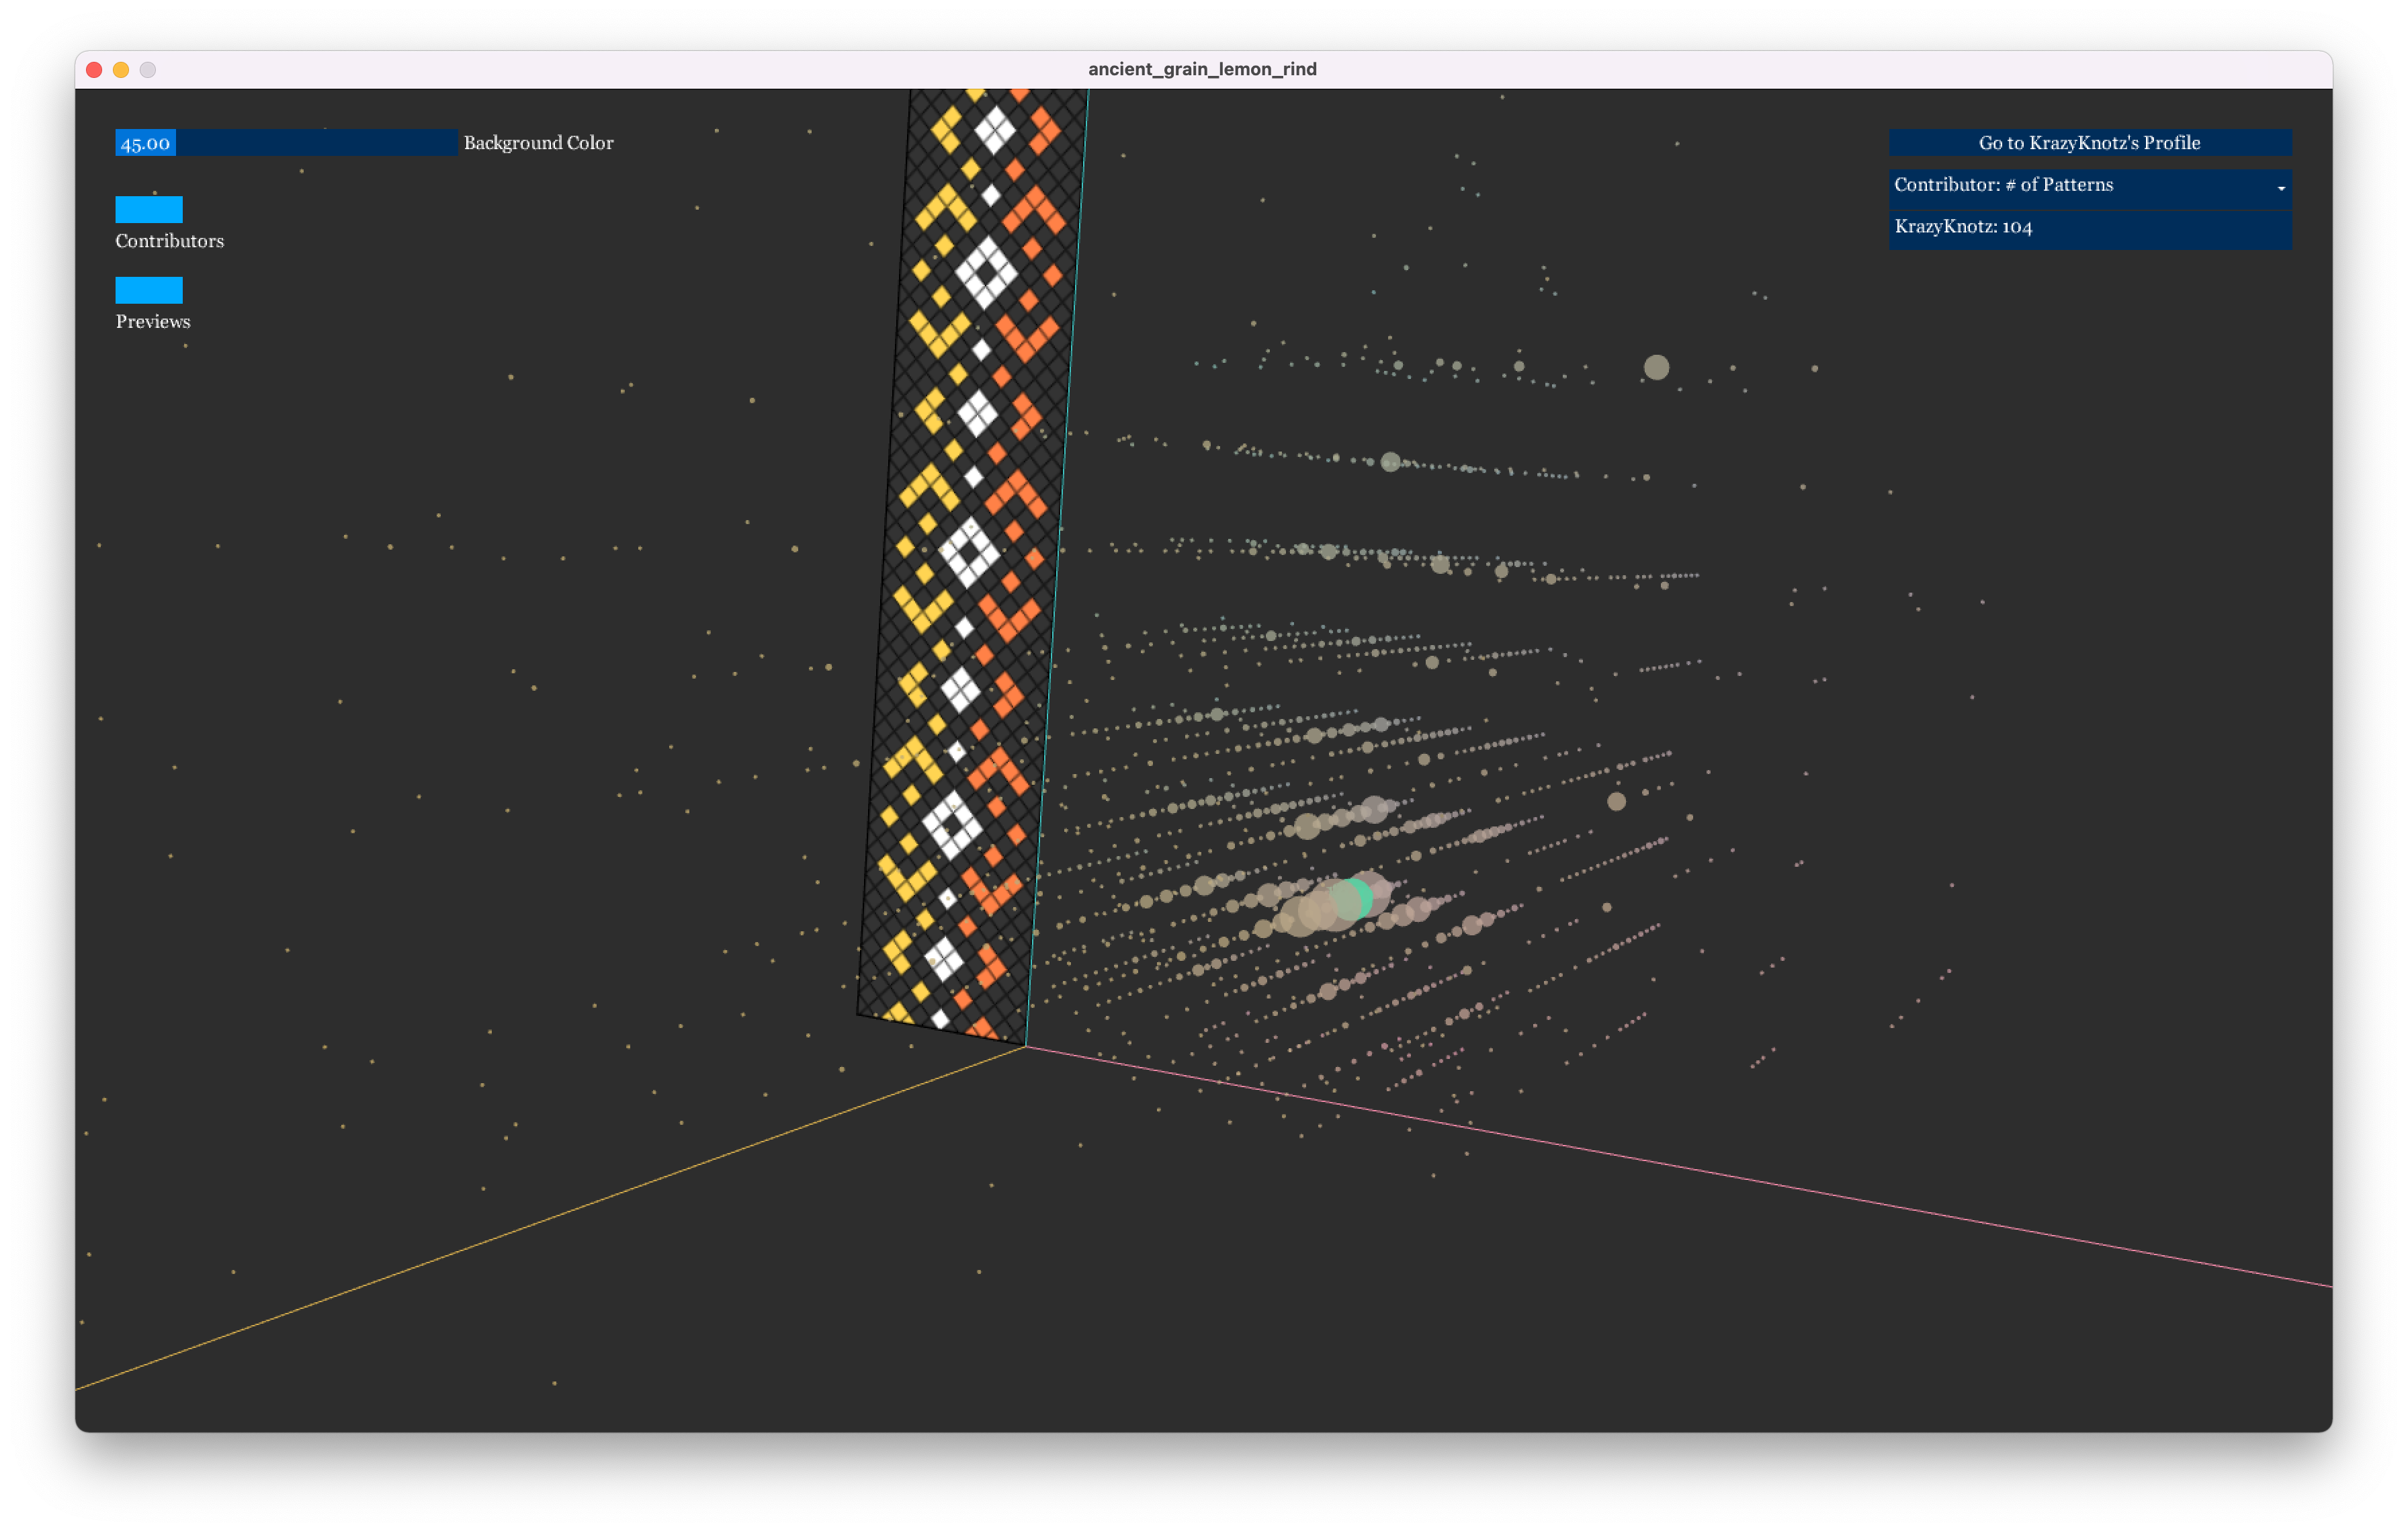
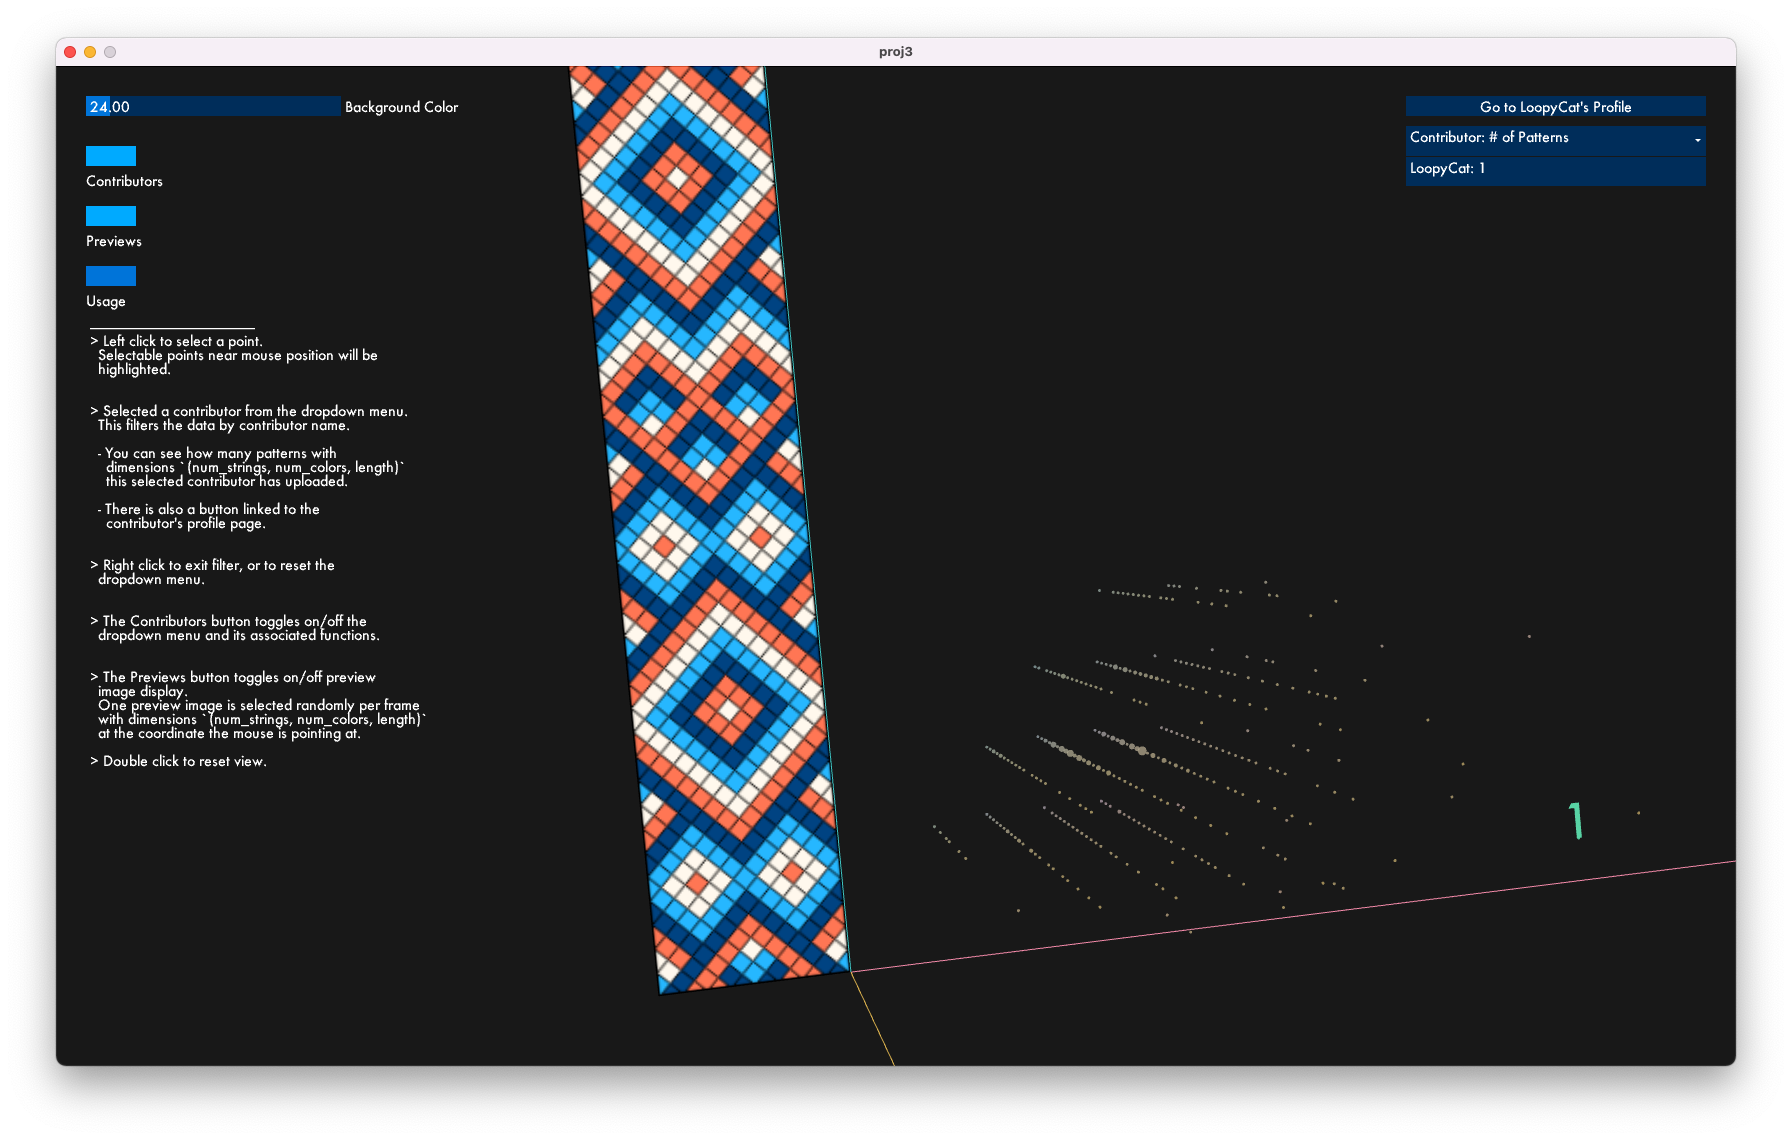
I listed contributors and the number of patterns they've uploaded to the website at the point the mouse is near/selecting, but it was very laggy. So I decided to move that information to the GUI instead.
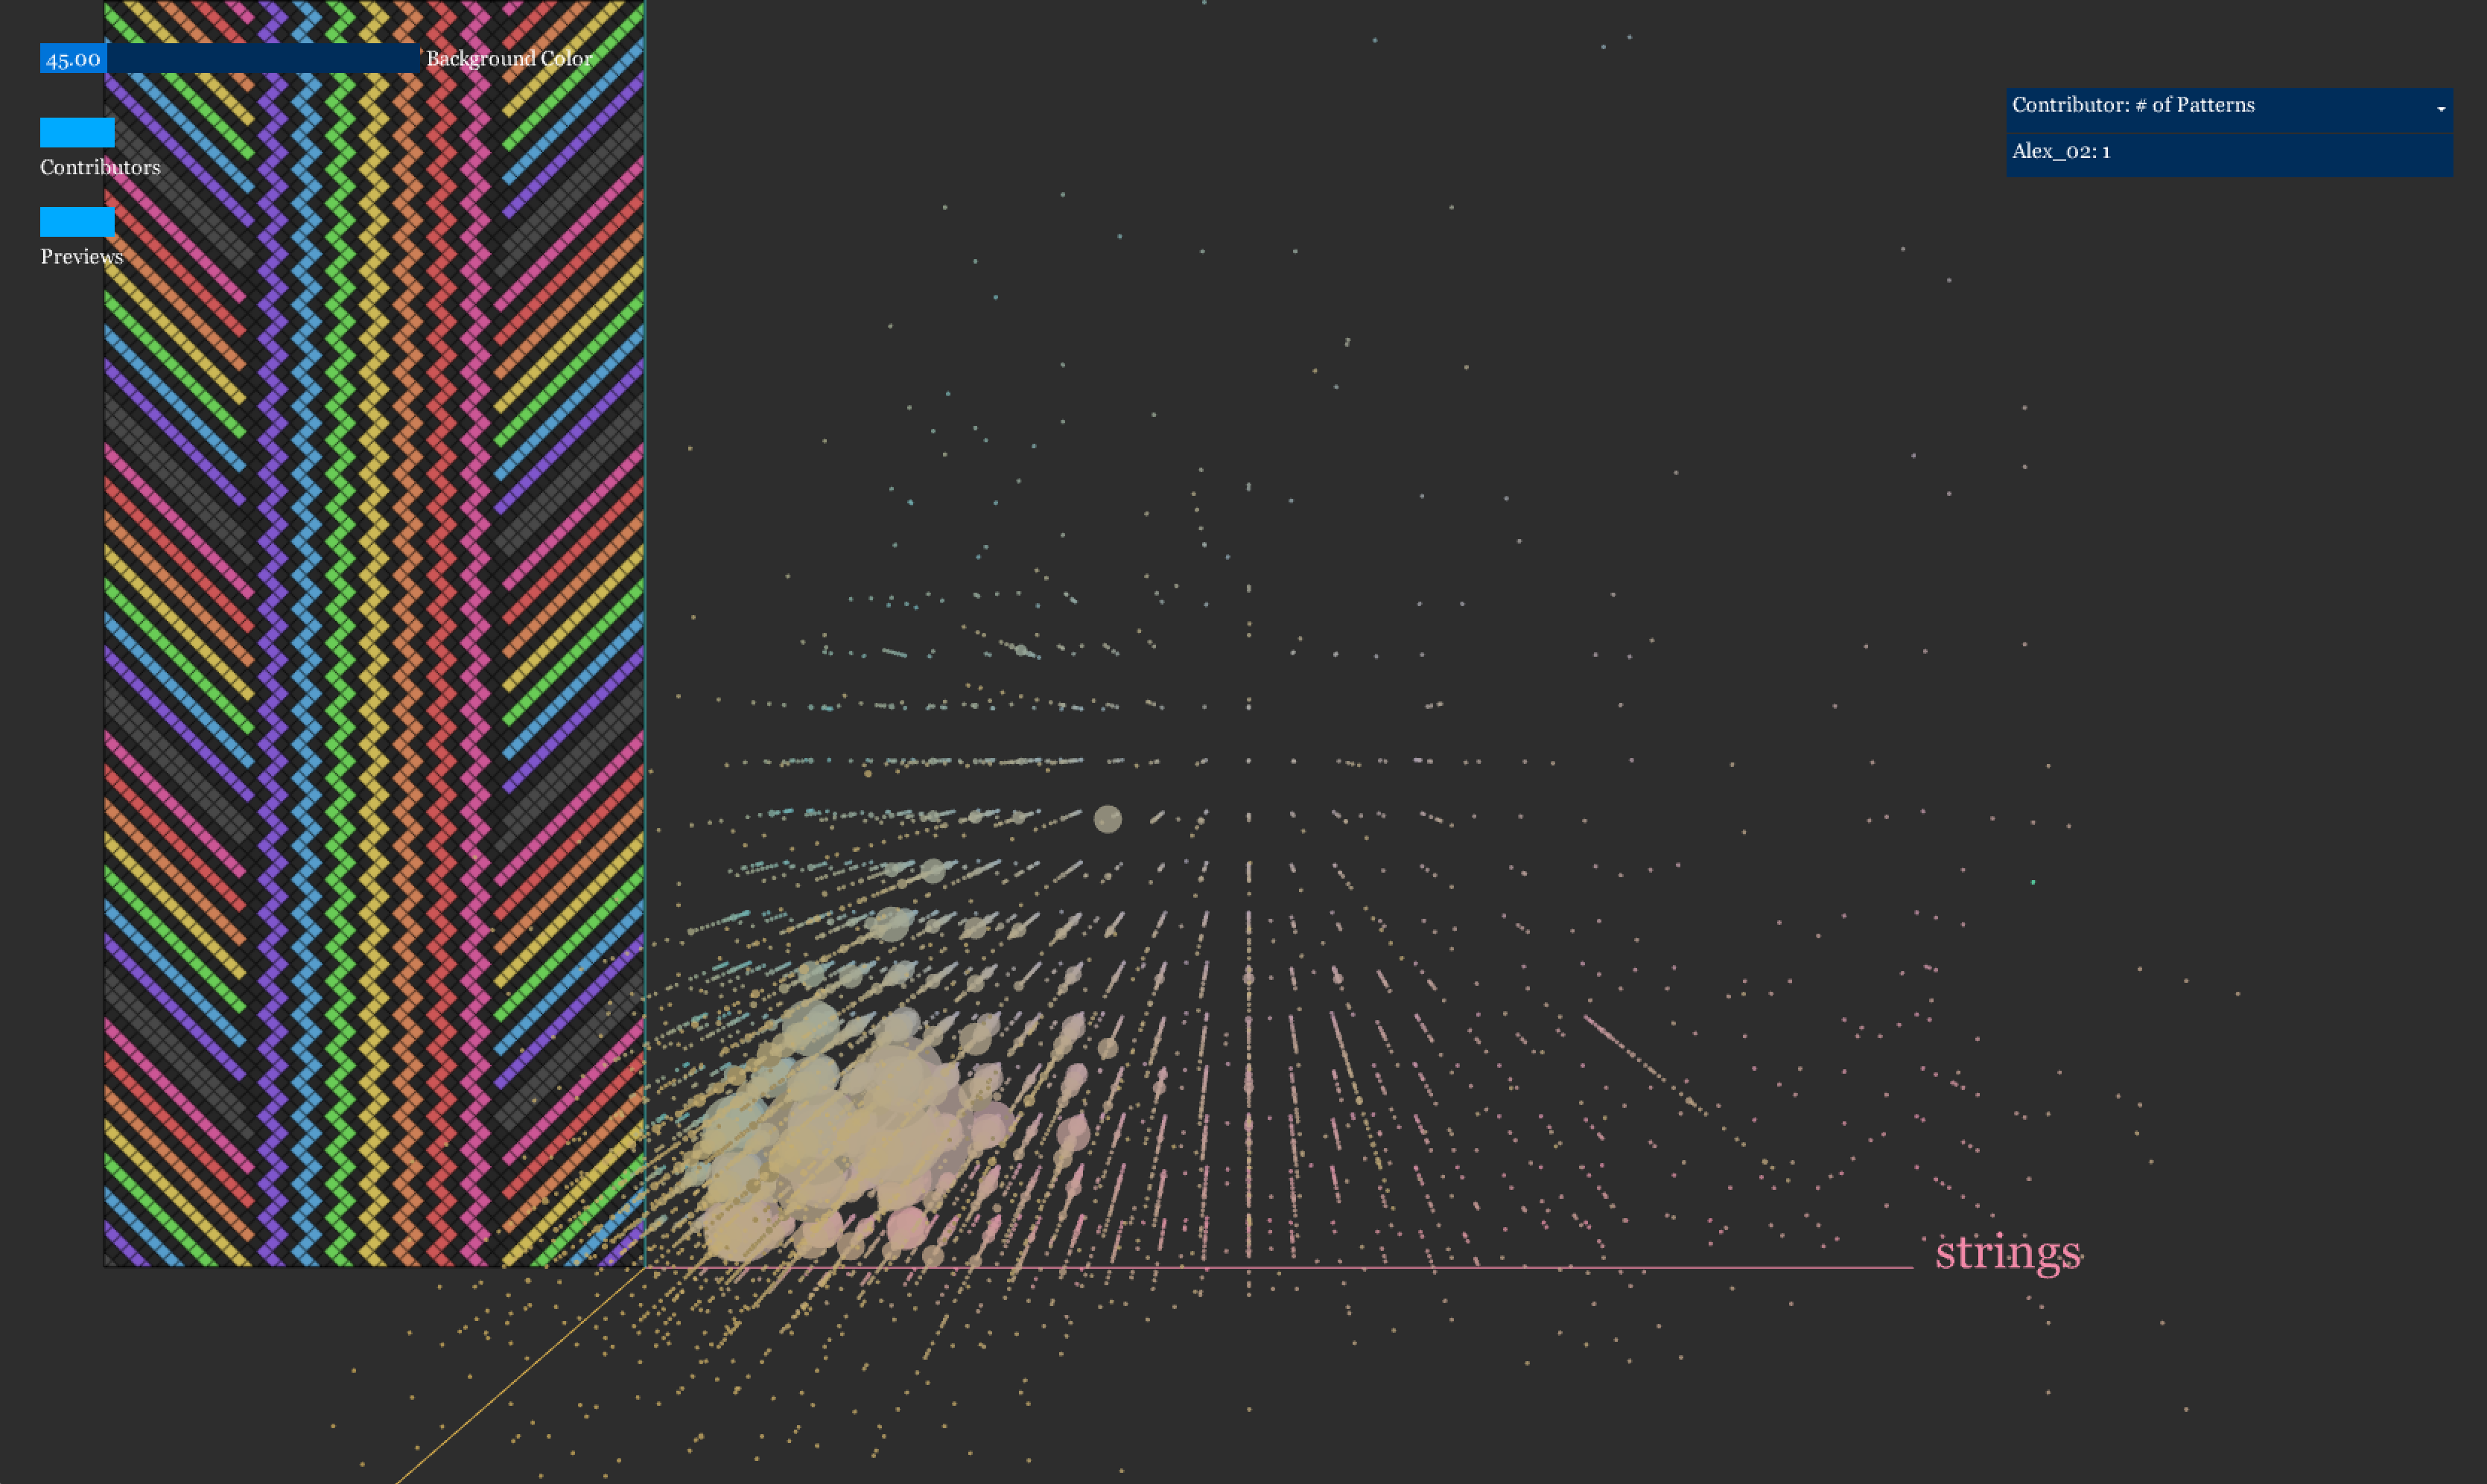
A list of patterns (at the selected point) was showed on the right side of the 3D space cube. However, loading images also made the program really laggy. Though when multiple patterns with the same dimensions are listed together, they are very beautiful.
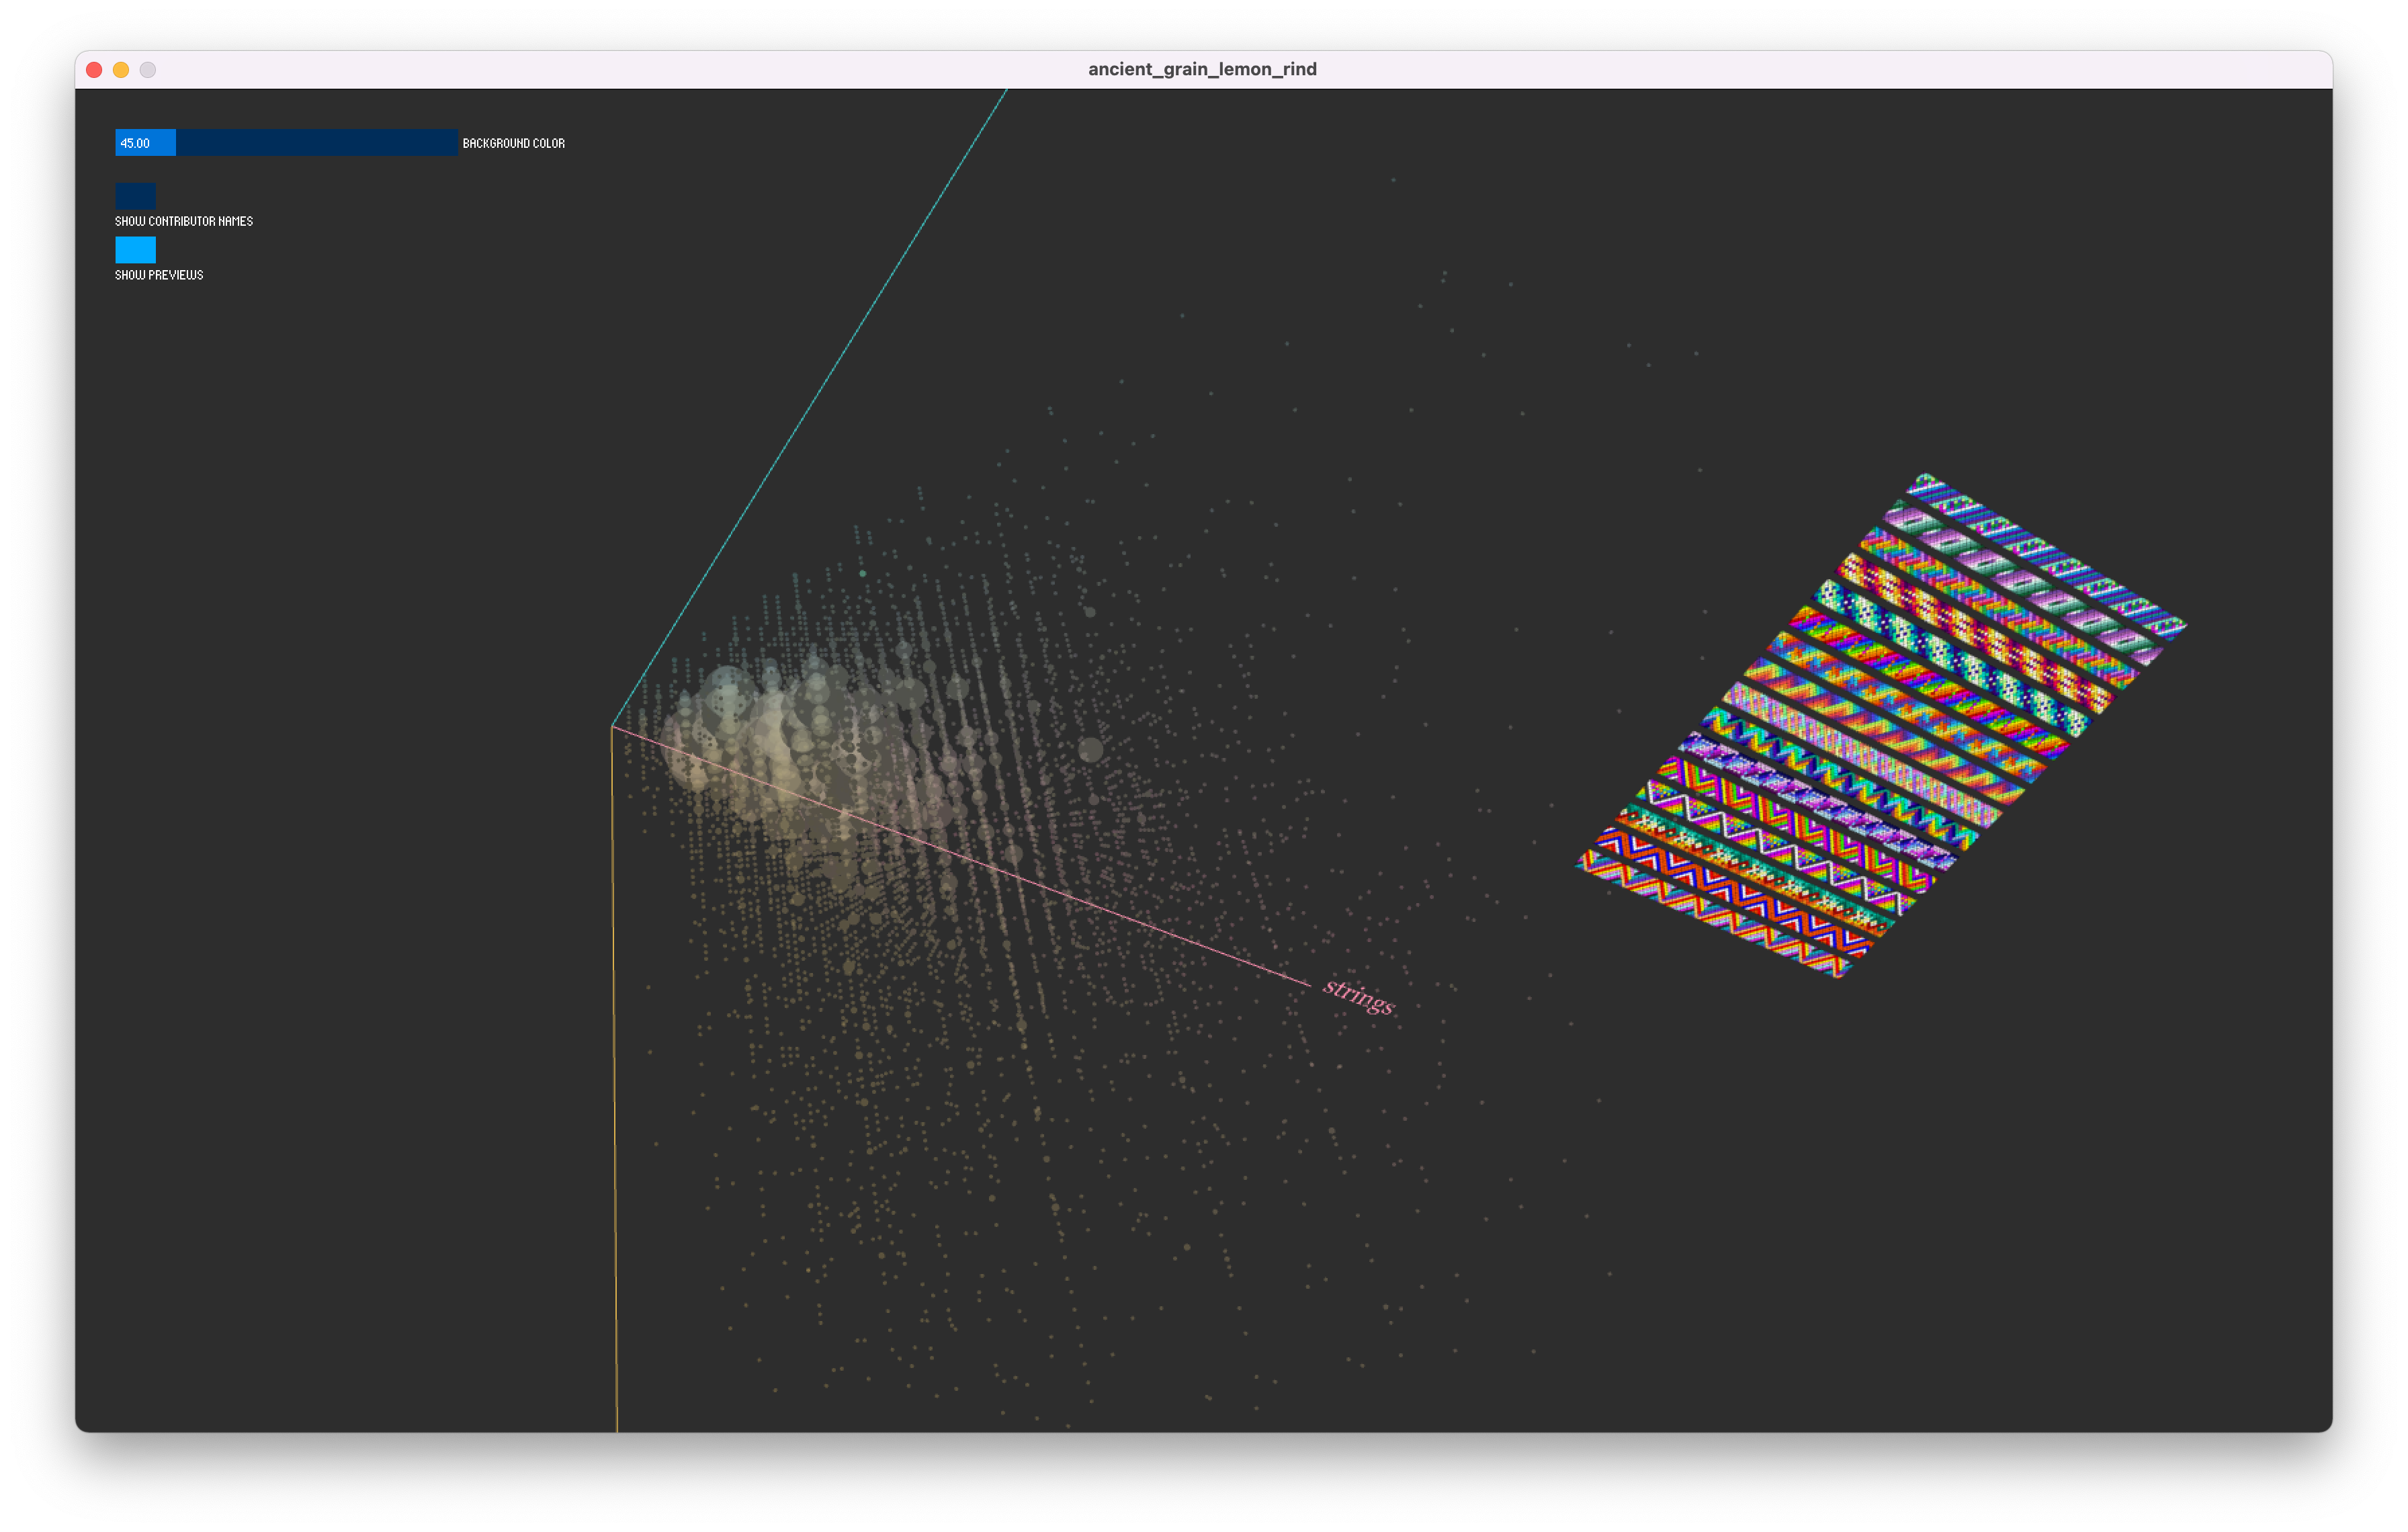
A list of patterns (at the selected point) was showed on the right side of the 3D space cube. However, loading images also made the program really laggy. Though when multiple patterns with the same dimensions are listed together, they are very beautiful.
Final result
The main issue of this project is the amount of overlapping datapoints and information at the same coordinates. It was rather difficult to extract individual information and represent them in the space and the GUI.
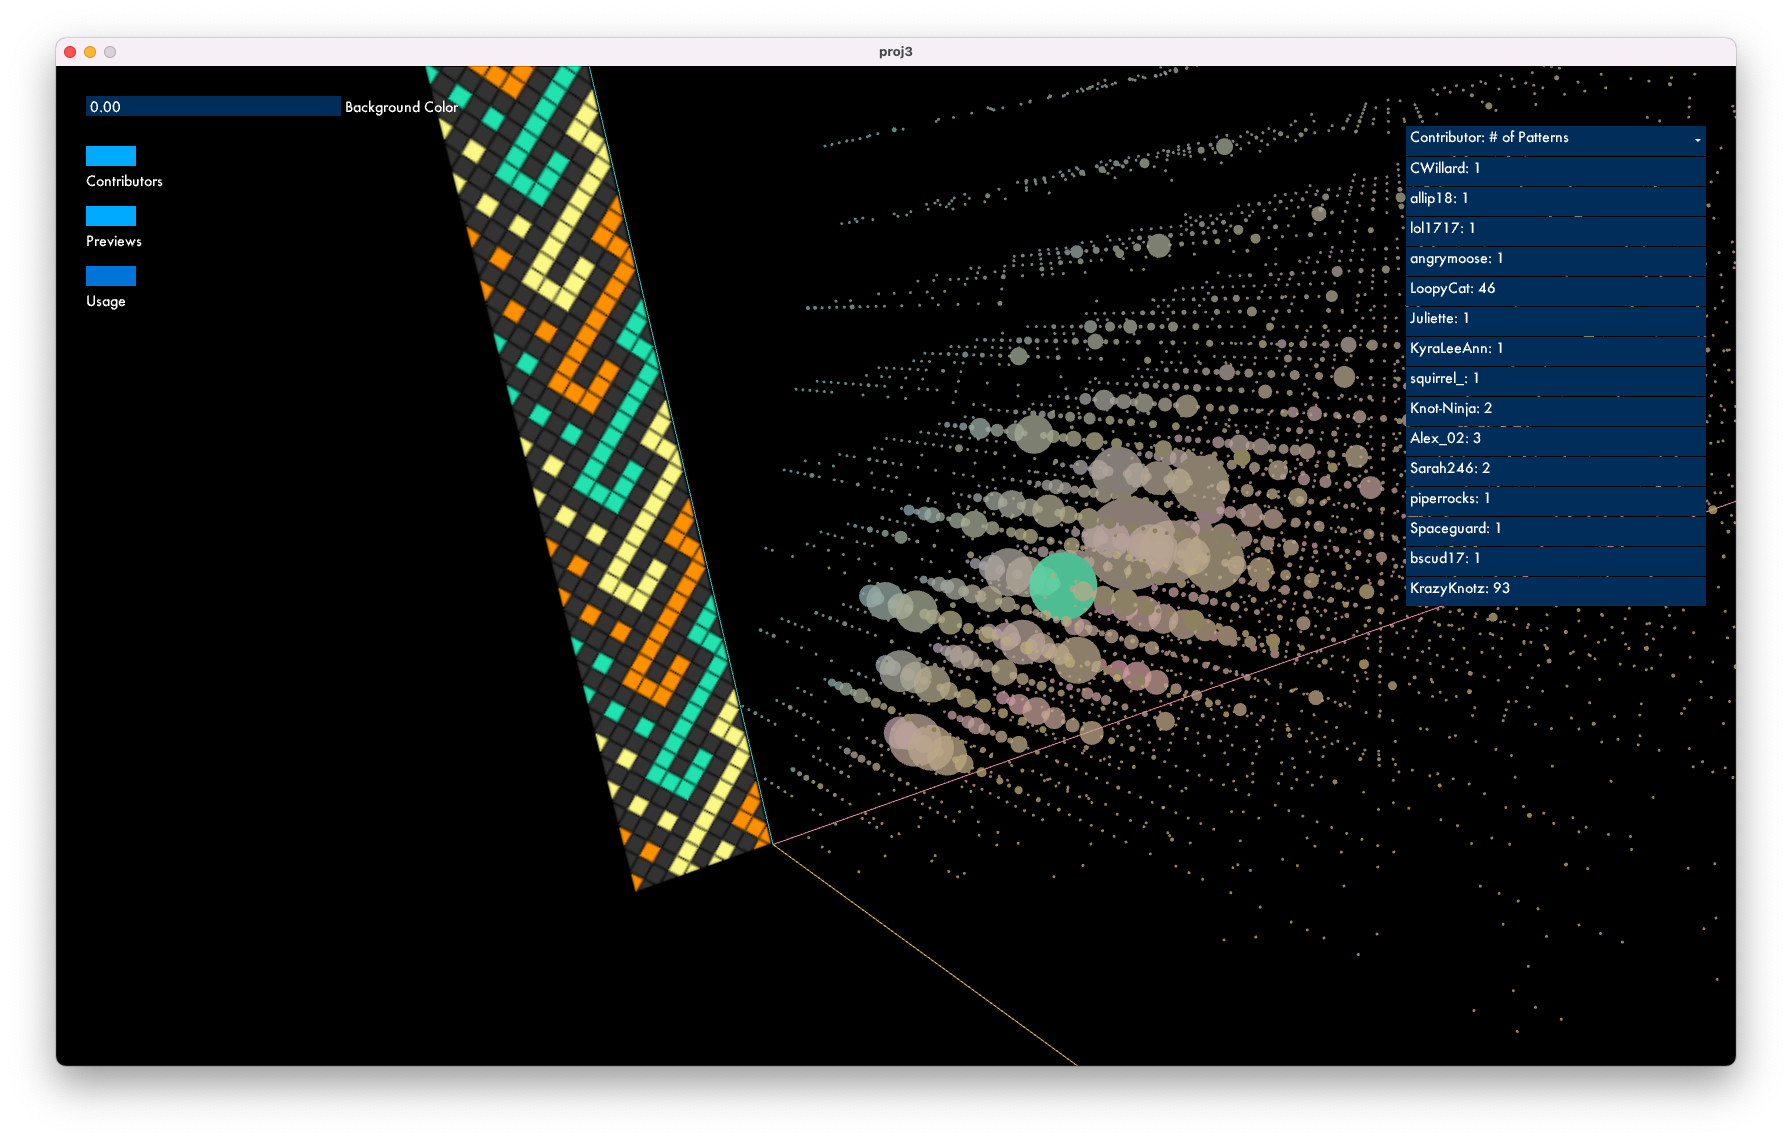
At each point in the space, there is a PatternCollection object that stores all patterns with dimensions `(num_strings, num_colors, length)`, and information of that pattern, such as contributor_name and pattern preview image's url.
To show contributors at each point, I used the ScrollableList from the controlP5 library.
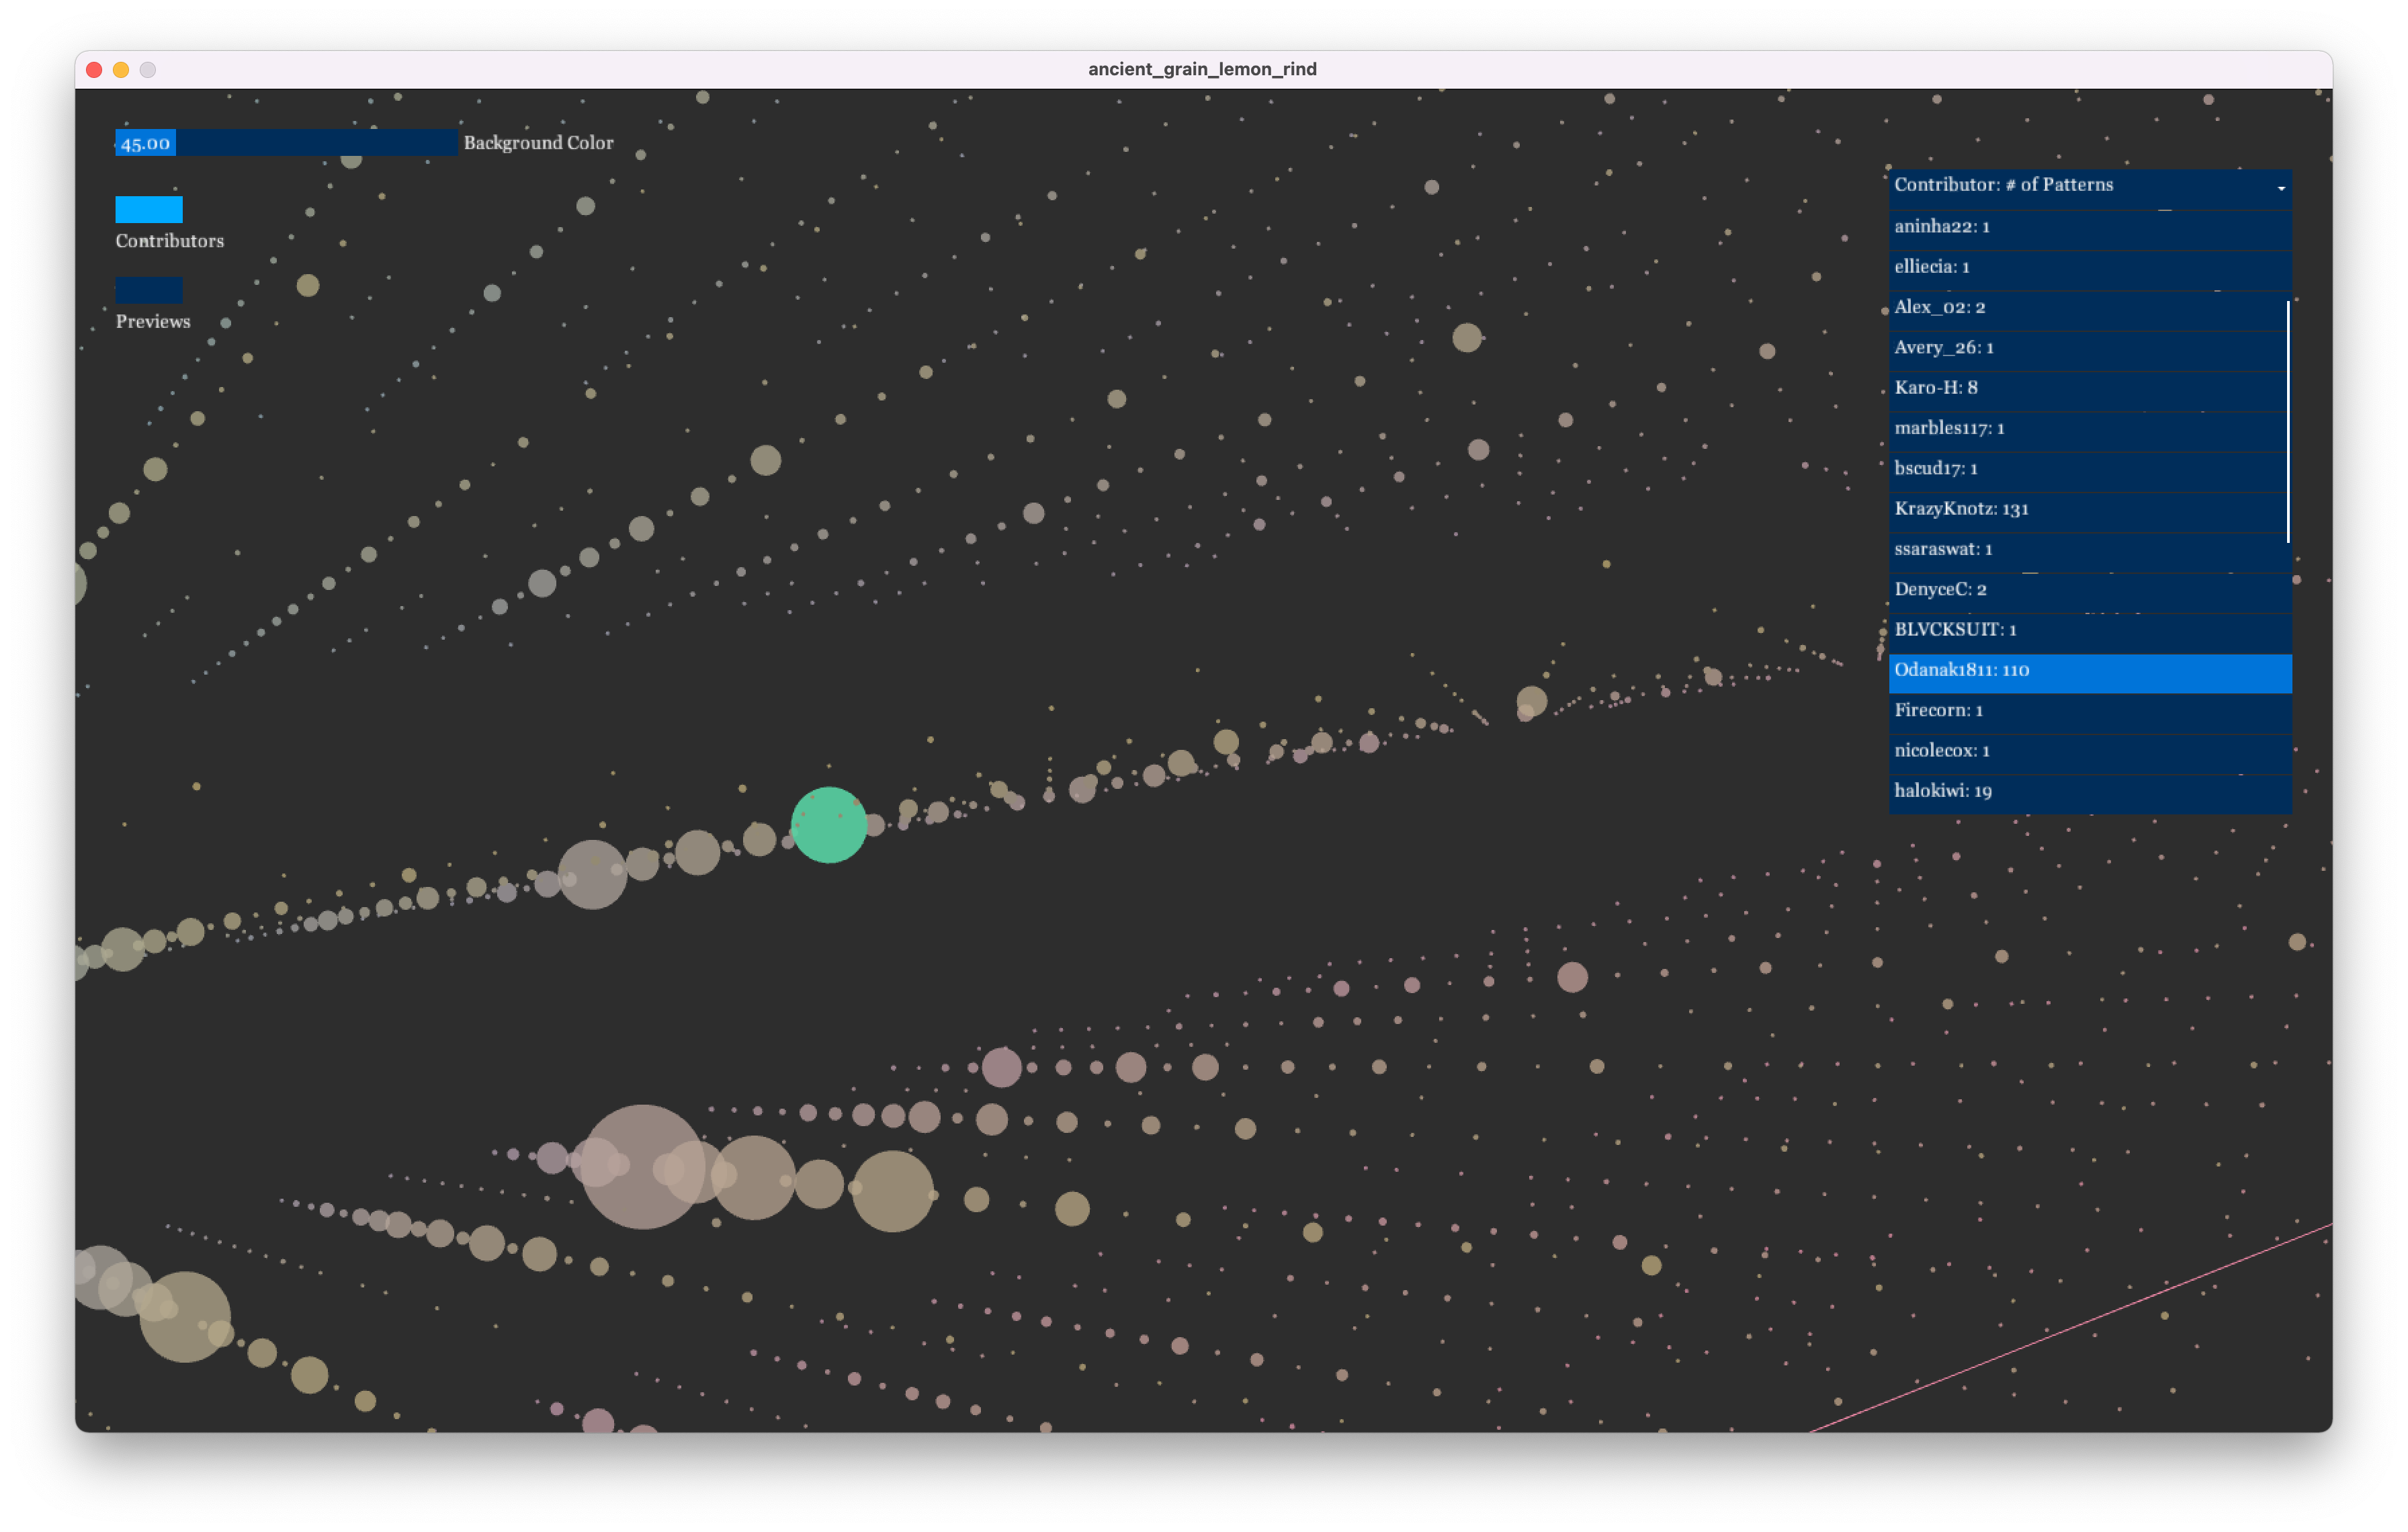
The user is able to select a single contributor from the menu, and view only that contributor's datapoints.
I also featured a button that links to the selected contributor's profile page.
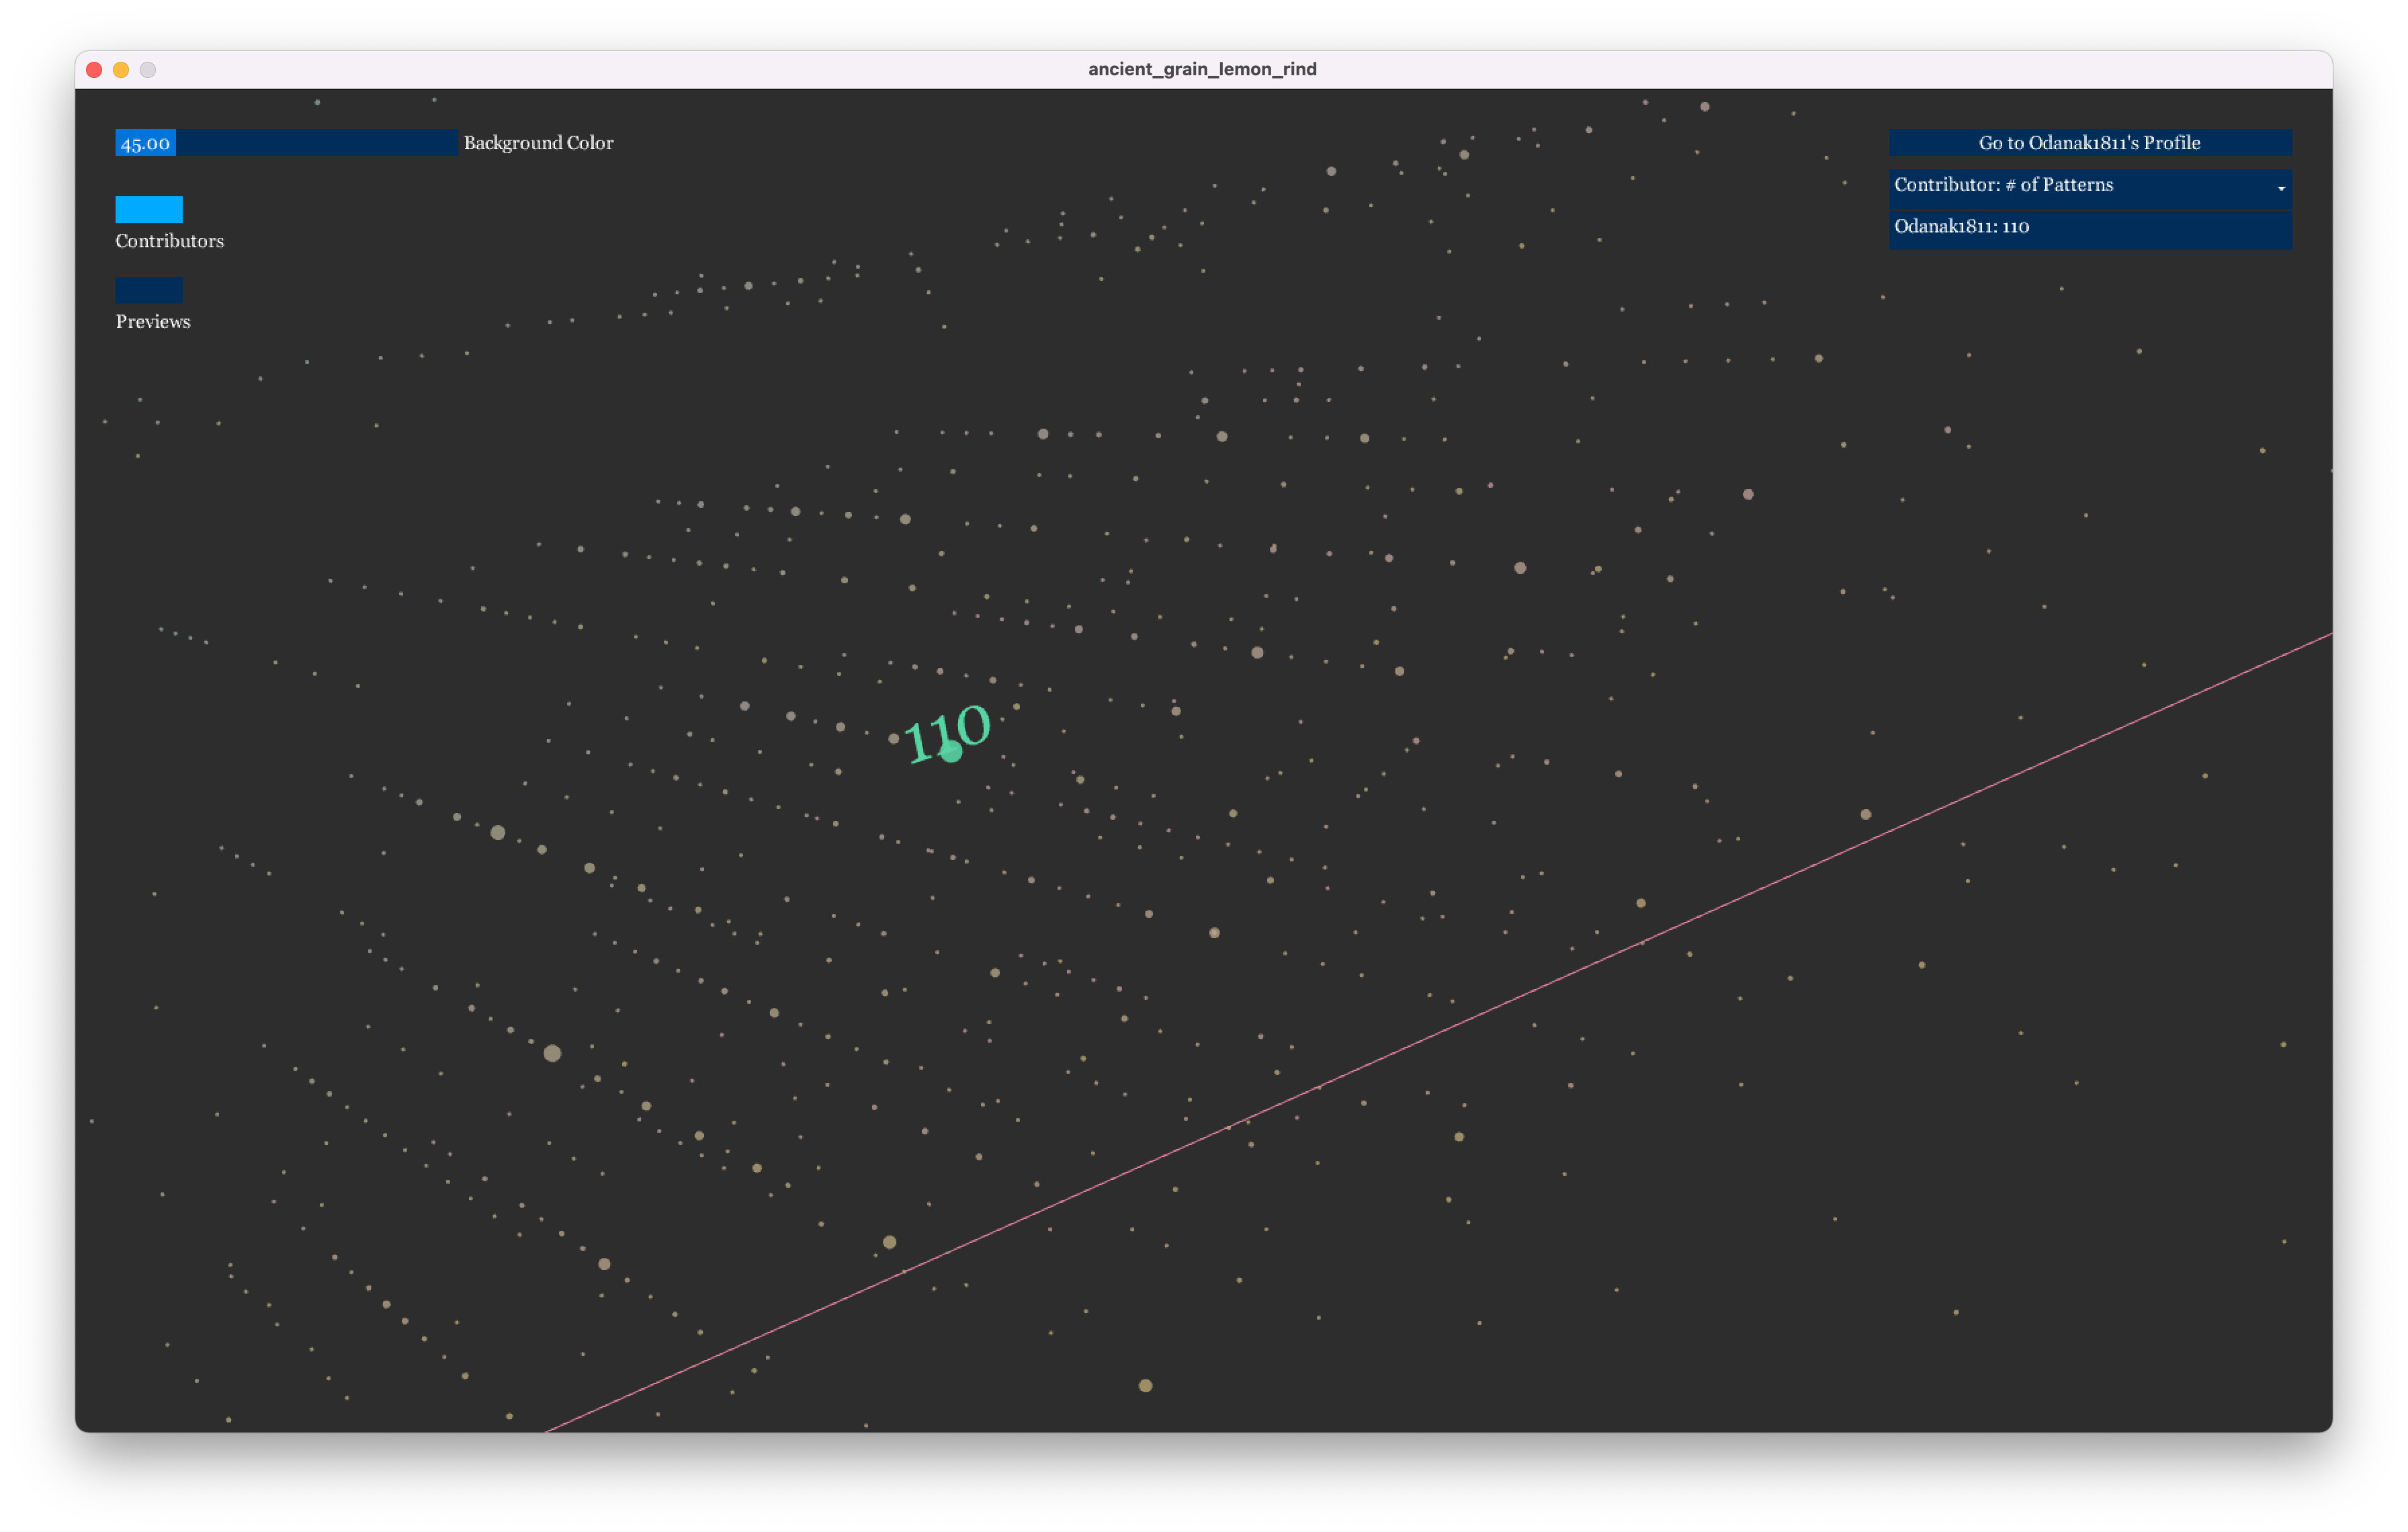
The number of patterns the selected contributor created on BraceletBook.com is shown on the point when the mouse is near.
The patterns can be shown both in the single contributor view and for when all data points are visible.
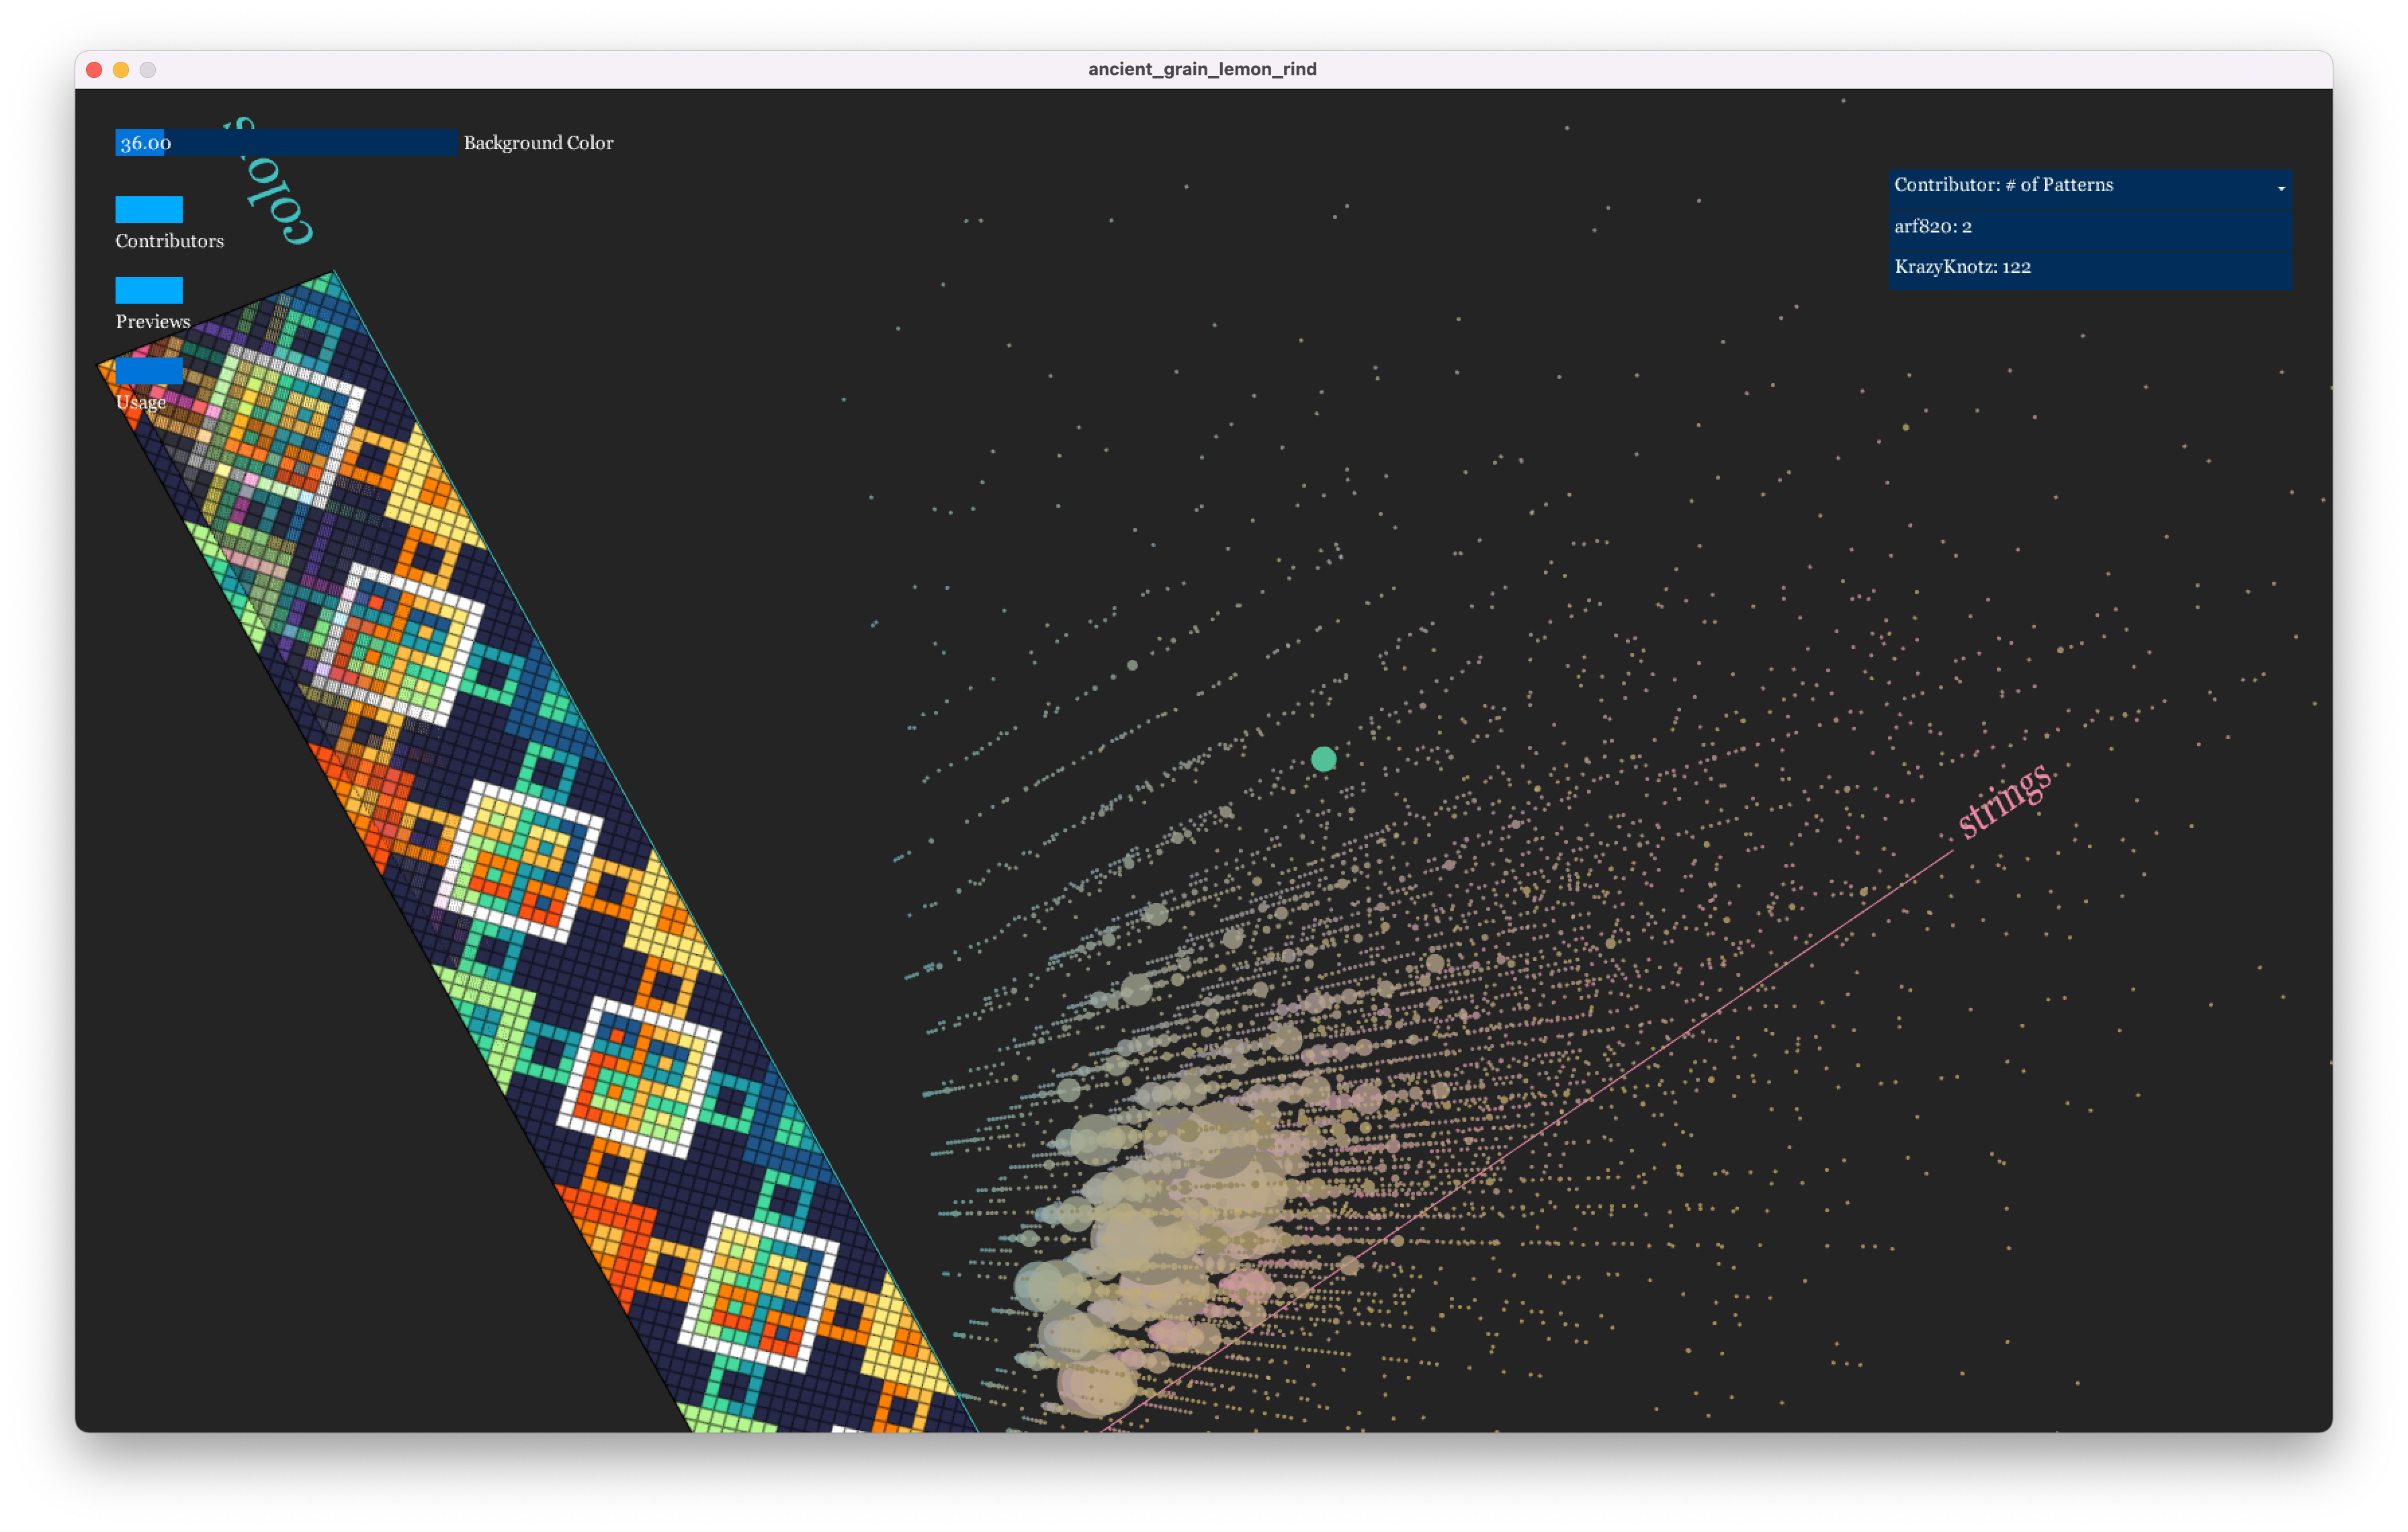
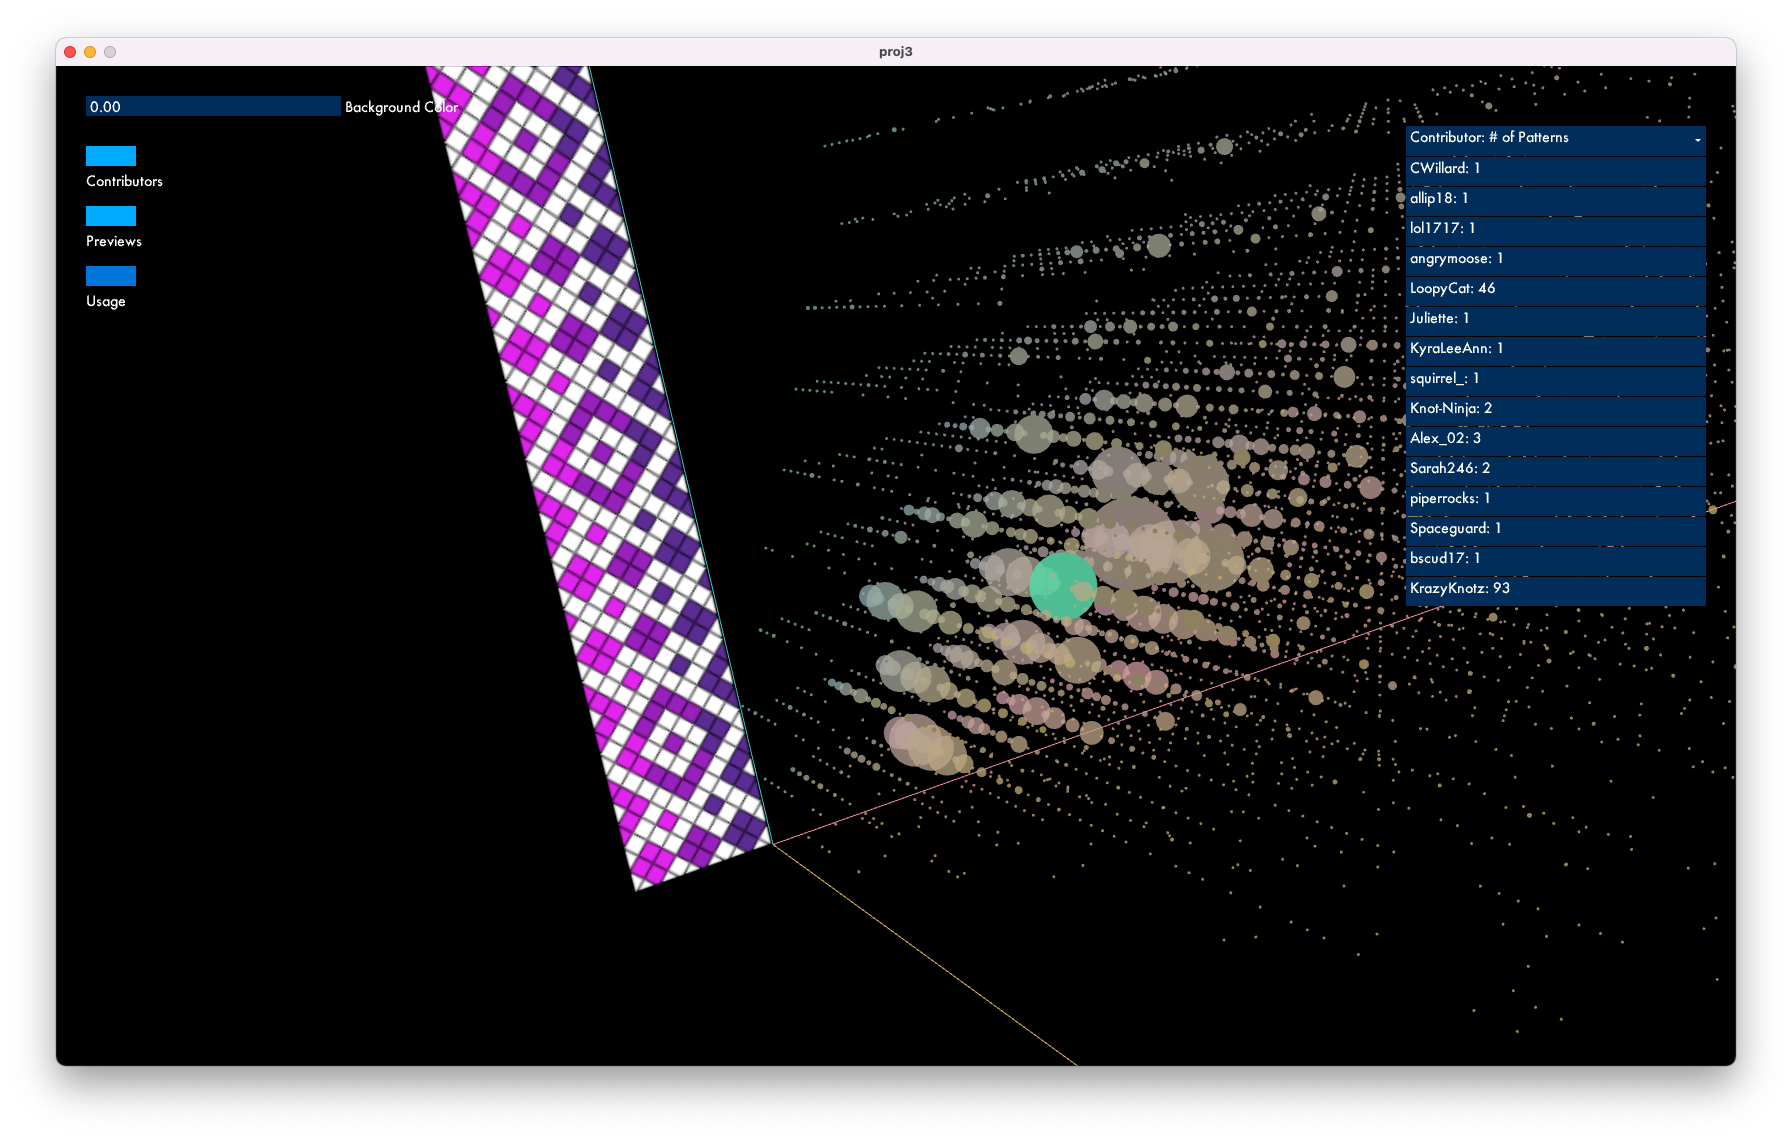
The preview toggle turns on/off the pattern images showed on left side of the space. A random pattern image is chosen per frame from the PatternCollection. So when a point is clicked and selected, the pattern on screen appear to be animated and changes it look, while its dimensions remain the same.
same dimensions, patterns change each frame
After a couple of tweaks, the final look:
At each point in the space, there is a PatternCollection object that stores all patterns with dimensions `(num_strings, num_colors, length)`, and information of that pattern, such as contributor_name and pattern preview image's url.
To show contributors at each point, I used the ScrollableList from the controlP5 library.
The user is able to select a single contributor from the menu, and view only that contributor's datapoints.
I also featured a button that links to the selected contributor's profile page.
The number of patterns the selected contributor created on BraceletBook.com is shown on the point when the mouse is near.
The patterns can be shown both in the single contributor view and for when all data points are visible.
The preview toggle turns on/off the pattern images showed on left side of the space. A random pattern image is chosen per frame from the PatternCollection. So when a point is clicked and selected, the pattern on screen appear to be animated and changes it look, while its dimensions remain the same.
same dimensions, patterns change each frame
After a couple of tweaks, the final look:
Code