Time of Change Across Modalities of Language Learning (2006-2023 at the Seattle Public Library, a 3D Treemap collection)
MAT 259, 2023
Arnav Kumar
Concept
The focus of this analysis is on the distribution of checkouts aggregated across year and modality for books in Dewey categories 400-499. This topic was chosen to reveal change across language learning modalities across the years 2006-2023, so the magnitude of checkouts were not as relevant themselves as were the gradients across time. A treemap structure thus seemed suitable for this hierarchical aggregation task, with a 3D augmentation to account for the third axis, which is time.
Query
SELECT
YEAR(cout) AS year,
MONTH(cout) AS month,
SUM(CASE
WHEN 1 = 1 THEN 1
ELSE 0
END) AS Checkouts,
title,
CASE
WHEN itemType LIKE '%bk%' THEN 'Book'
WHEN itemType LIKE '%cd%' THEN 'CD'
WHEN itemType LIKE '%vhs%' THEN 'VHS'
WHEN itemType LIKE '%cas%' THEN 'Audiobook'
WHEN itemType LIKE '%dvd%' THEN 'DVD'
WHEN itemType LIKE '%kit%' THEN 'Kit'
WHEN itemType LIKE '%mag%' THEN 'Magazine'
WHEN itemType LIKE '%disk%' THEN 'Diskette'
ELSE 'Miscellaneous'
END AS itemType
FROM
spl_2016.outraw
WHERE
(cout >= '2006-01-01'
AND cout <= '2006-12-31'
AND deweyClass >= 400
AND deweyClass <= 499
AND !( deweyClass = '')
AND !( title = ''))
OR (cout >= '2019-01-01'
AND cout <= '2019-12-31'
AND deweyClass >= 400
AND deweyClass <= 499
AND !( deweyClass = '')
AND !( title = ''))
GROUP BY YEAR(cout) , MONTH(cout) , title , itemType;
Listing 1: Original SQL Query
This query produces an unpivoted table that aggregated checkouts by year, month, title, and itemType. The table contains both float and string data types, which is not compatible with the existing template, whose data structures requires pivoted float data for every single entry in the table. Thus, a second query pivoted, imputed, and encoded where it was able to to in order to fit the template.
SELECT
(CASE
WHEN itemType LIKE 'acbk' THEN '1'
WHEN itemType LIKE 'arbk' THEN '2'
WHEN itemType LIKE 'bcbk' THEN '3'
WHEN itemType LIKE 'drbk' THEN '4'
WHEN itemType LIKE 'jcbk' THEN '5'
WHEN itemType LIKE 'jrbk' THEN '6'
WHEN itemType LIKE 'bccd' THEN '7'
WHEN itemType LIKE 'accd' THEN '8'
WHEN itemType LIKE 'arcd' THEN '9'
WHEN itemType LIKE 'jccd' THEN '10'
WHEN itemType LIKE 'jrcd' THEN '11'
WHEN itemType LIKE 'accdrom' THEN '12'
WHEN itemType LIKE 'arcdrom' THEN '13'
WHEN itemType LIKE 'bccdrom' THEN '14'
WHEN itemType LIKE 'drcdrom' THEN '15'
WHEN itemType LIKE 'jccdrom' THEN '16'
WHEN itemType LIKE 'accas' THEN '17'
WHEN itemType LIKE 'arcas' THEN '18'
WHEN itemType LIKE 'bccas' THEN '19'
WHEN itemType LIKE 'jccas' THEN '20'
WHEN itemType LIKE 'jrcas' THEN '21'
WHEN itemType LIKE 'acvhs' THEN '22'
WHEN itemType LIKE 'alvhs' THEN '23'
WHEN itemType LIKE 'arvhs' THEN '24'
WHEN itemType LIKE 'bcvhs' THEN '25'
WHEN itemType LIKE 'blvhs' THEN '26'
WHEN itemType LIKE 'jcvhs' THEN '27'
WHEN itemType LIKE 'jlvhs' THEN '28'
WHEN itemType LIKE 'jrvhs' THEN '29'
WHEN itemType LIKE 'xrvhs' THEN '30'
WHEN itemType LIKE 'ackit' THEN '31'
WHEN itemType LIKE 'arkit' THEN '32'
WHEN itemType LIKE 'bckit' THEN '33'
WHEN itemType LIKE 'jckit' THEN '34'
WHEN itemType LIKE 'jrkit' THEN '35'
WHEN itemType LIKE 'xrbk' THEN '36'
WHEN itemType LIKE 'xrcdrom' THEN '37'
WHEN itemType LIKE 'acdisk' THEN '38'
WHEN itemType LIKE 'ardisk' THEN '39'
WHEN itemType LIKE 'jrdisk' THEN '40'
WHEN itemType LIKE 'acdvd' THEN '41'
WHEN itemType LIKE 'ardvd' THEN '42'
WHEN itemType LIKE 'bcdvd' THEN '43'
WHEN itemType LIKE 'jcdvd' THEN '44'
WHEN itemType LIKE 'jrdvd' THEN '45'
ELSE '46'
END) AS itemTypeNumber,
SUM(CASE
WHEN YEAR(cout) = 2006 THEN 1
ELSE 0
END) AS '2006',
SUM(CASE
WHEN YEAR(cout) = 2007 THEN 1
ELSE 0
END) AS '2007',
SUM(CASE
WHEN YEAR(cout) = 2008 THEN 1
ELSE 0
END) AS '2008',
SUM(CASE
WHEN YEAR(cout) = 2009 THEN 1
ELSE 0
END) AS '2009',
SUM(CASE
WHEN YEAR(cout) = 2010 THEN 1
ELSE 0
END) AS '2010',
SUM(CASE
WHEN YEAR(cout) = 2011 THEN 1
ELSE 0
END) AS '2011',
SUM(CASE
WHEN YEAR(cout) = 2012 THEN 1
ELSE 0
END) AS '2012',
SUM(CASE
WHEN YEAR(cout) = 2013 THEN 1
ELSE 0
END) AS '2013',
SUM(CASE
WHEN YEAR(cout) = 2014 THEN 1
ELSE 0
END) AS '2014',
SUM(CASE
WHEN YEAR(cout) = 2015 THEN 1
ELSE 0
END) AS '2015',
SUM(CASE
WHEN YEAR(cout) = 2016 THEN 1
ELSE 0
END) AS '2016',
SUM(CASE
WHEN YEAR(cout) = 2017 THEN 1
ELSE 0
END) AS '2017',
SUM(CASE
WHEN YEAR(cout) = 2018 THEN 1
ELSE 0
END) AS '2018',
SUM(CASE
WHEN YEAR(cout) = 2019 THEN 1
ELSE 0
END) AS '2019',
SUM(CASE
WHEN YEAR(cout) = 2020 THEN 1
ELSE 0
END) AS '2020',
SUM(CASE
WHEN YEAR(cout) = 2021 THEN 1
ELSE 0
END) AS '2021',
SUM(CASE
WHEN YEAR(cout) = 2022 THEN 1
ELSE 0
END) AS '2022',
SUM(CASE
WHEN YEAR(cout) = 2023 THEN 1
ELSE 0
END) AS '2023'
FROM
spl_2016.outraw
WHERE
cout >= '2006-01-01'
AND deweyClass >= 400
AND deweyClass <= 499
AND !( deweyClass = '')
AND !( title = '')
GROUP BY itemTypeNumber;
Listing 2: Amended SQL Query
This query produces a very small table compared to the first, but it still allows for valuable insights in regard to the original research question, as it will be seen shortly.
Preliminary sketches
An initial sketch displays a rough idea of what was originally desired:
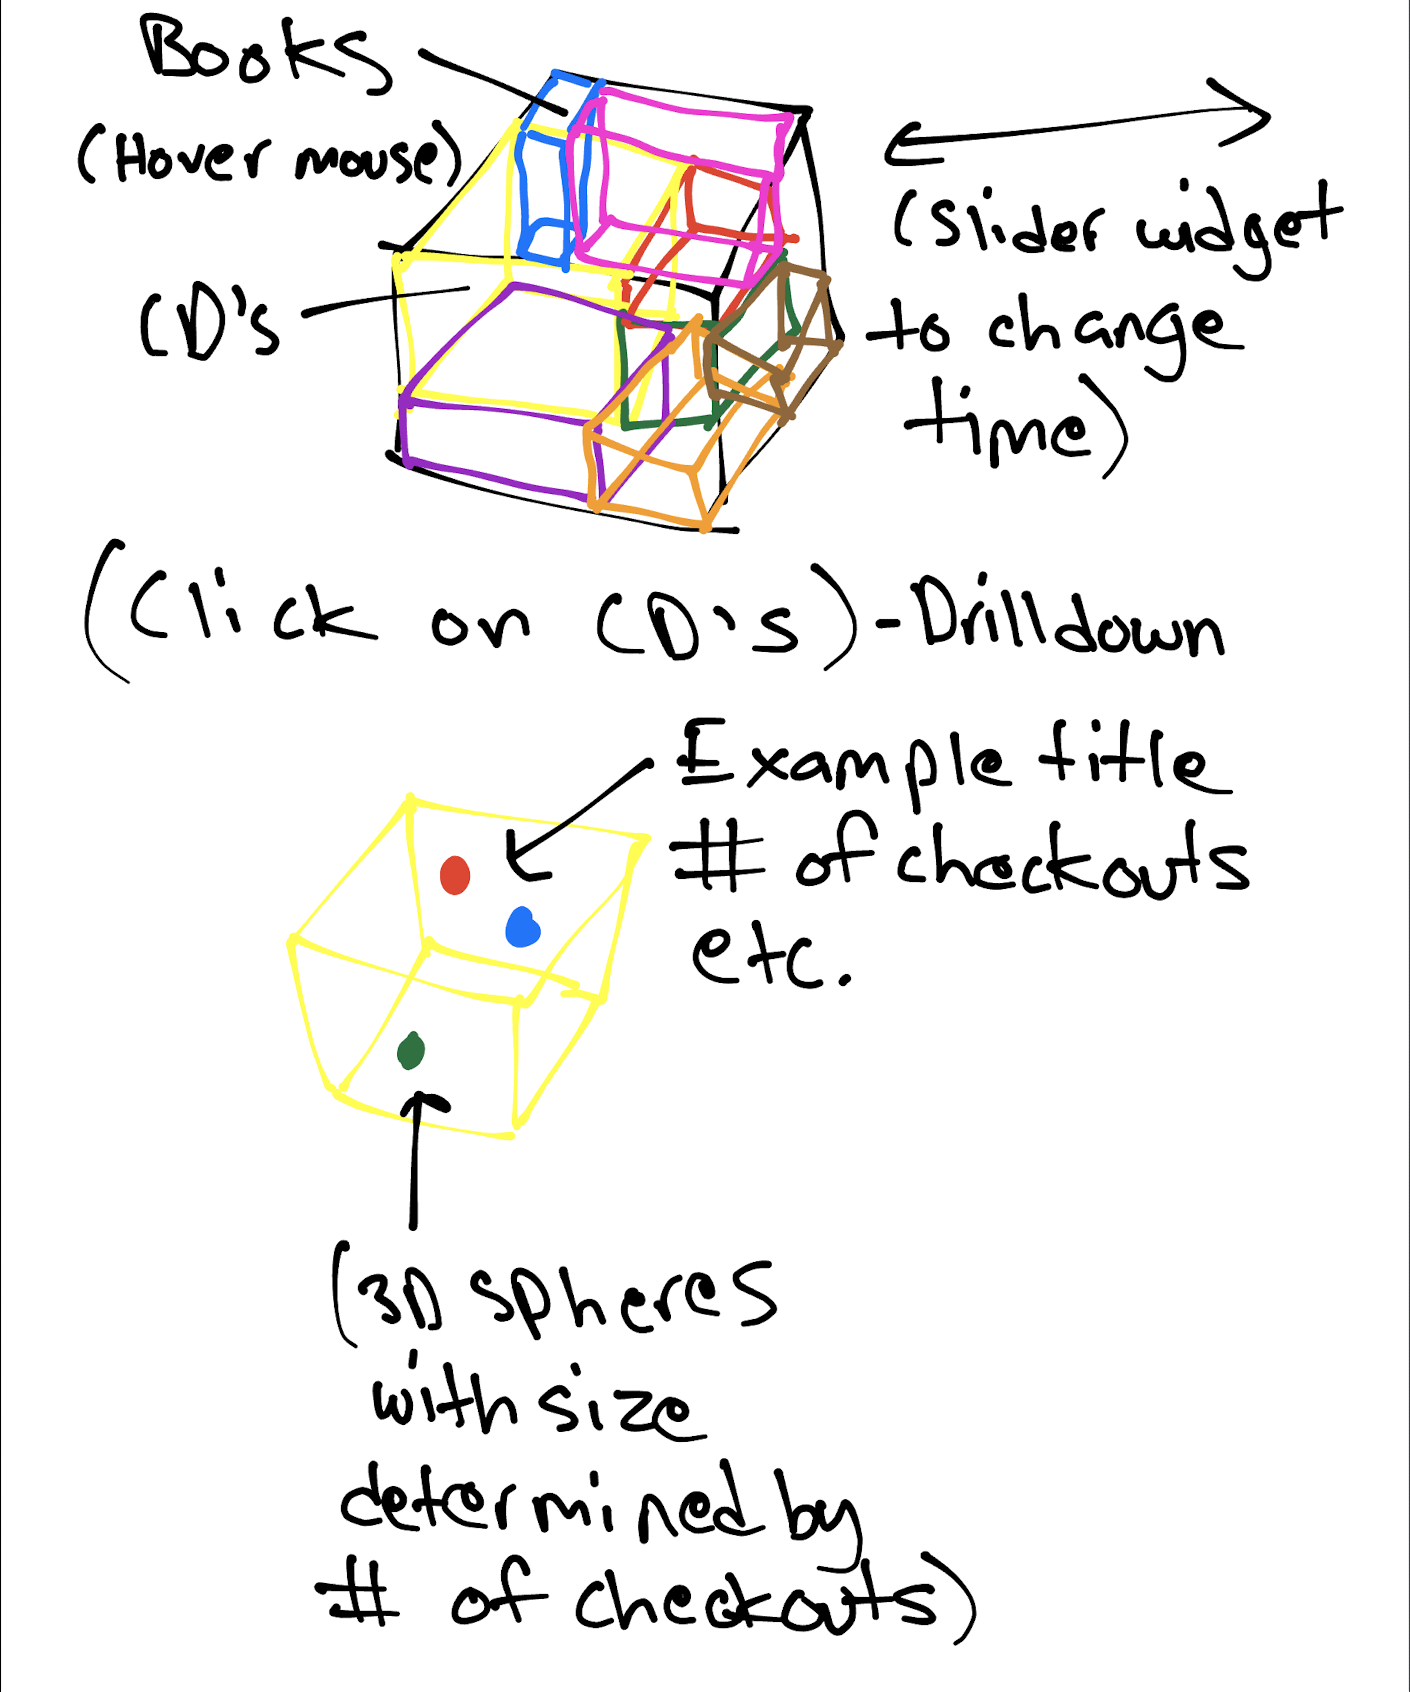
Figure 1: A concept sketch for a potential 3D treemap visualization
However, after further consultation, it was clear that existing work by previous students did not address the cubic optimization problem presented by this iteration of a 3D treemap: Dynamically sizing cubic portions representing each modality to add up exactly to the full cubic area of the master cube based on checkouts. Thus, a simpler approach was taken, using another iteration of 3D treemap visualization worked on by previous students through the Processing treemap library.
Process
After the template was fitted for, preliminary observations of the visualization were made.
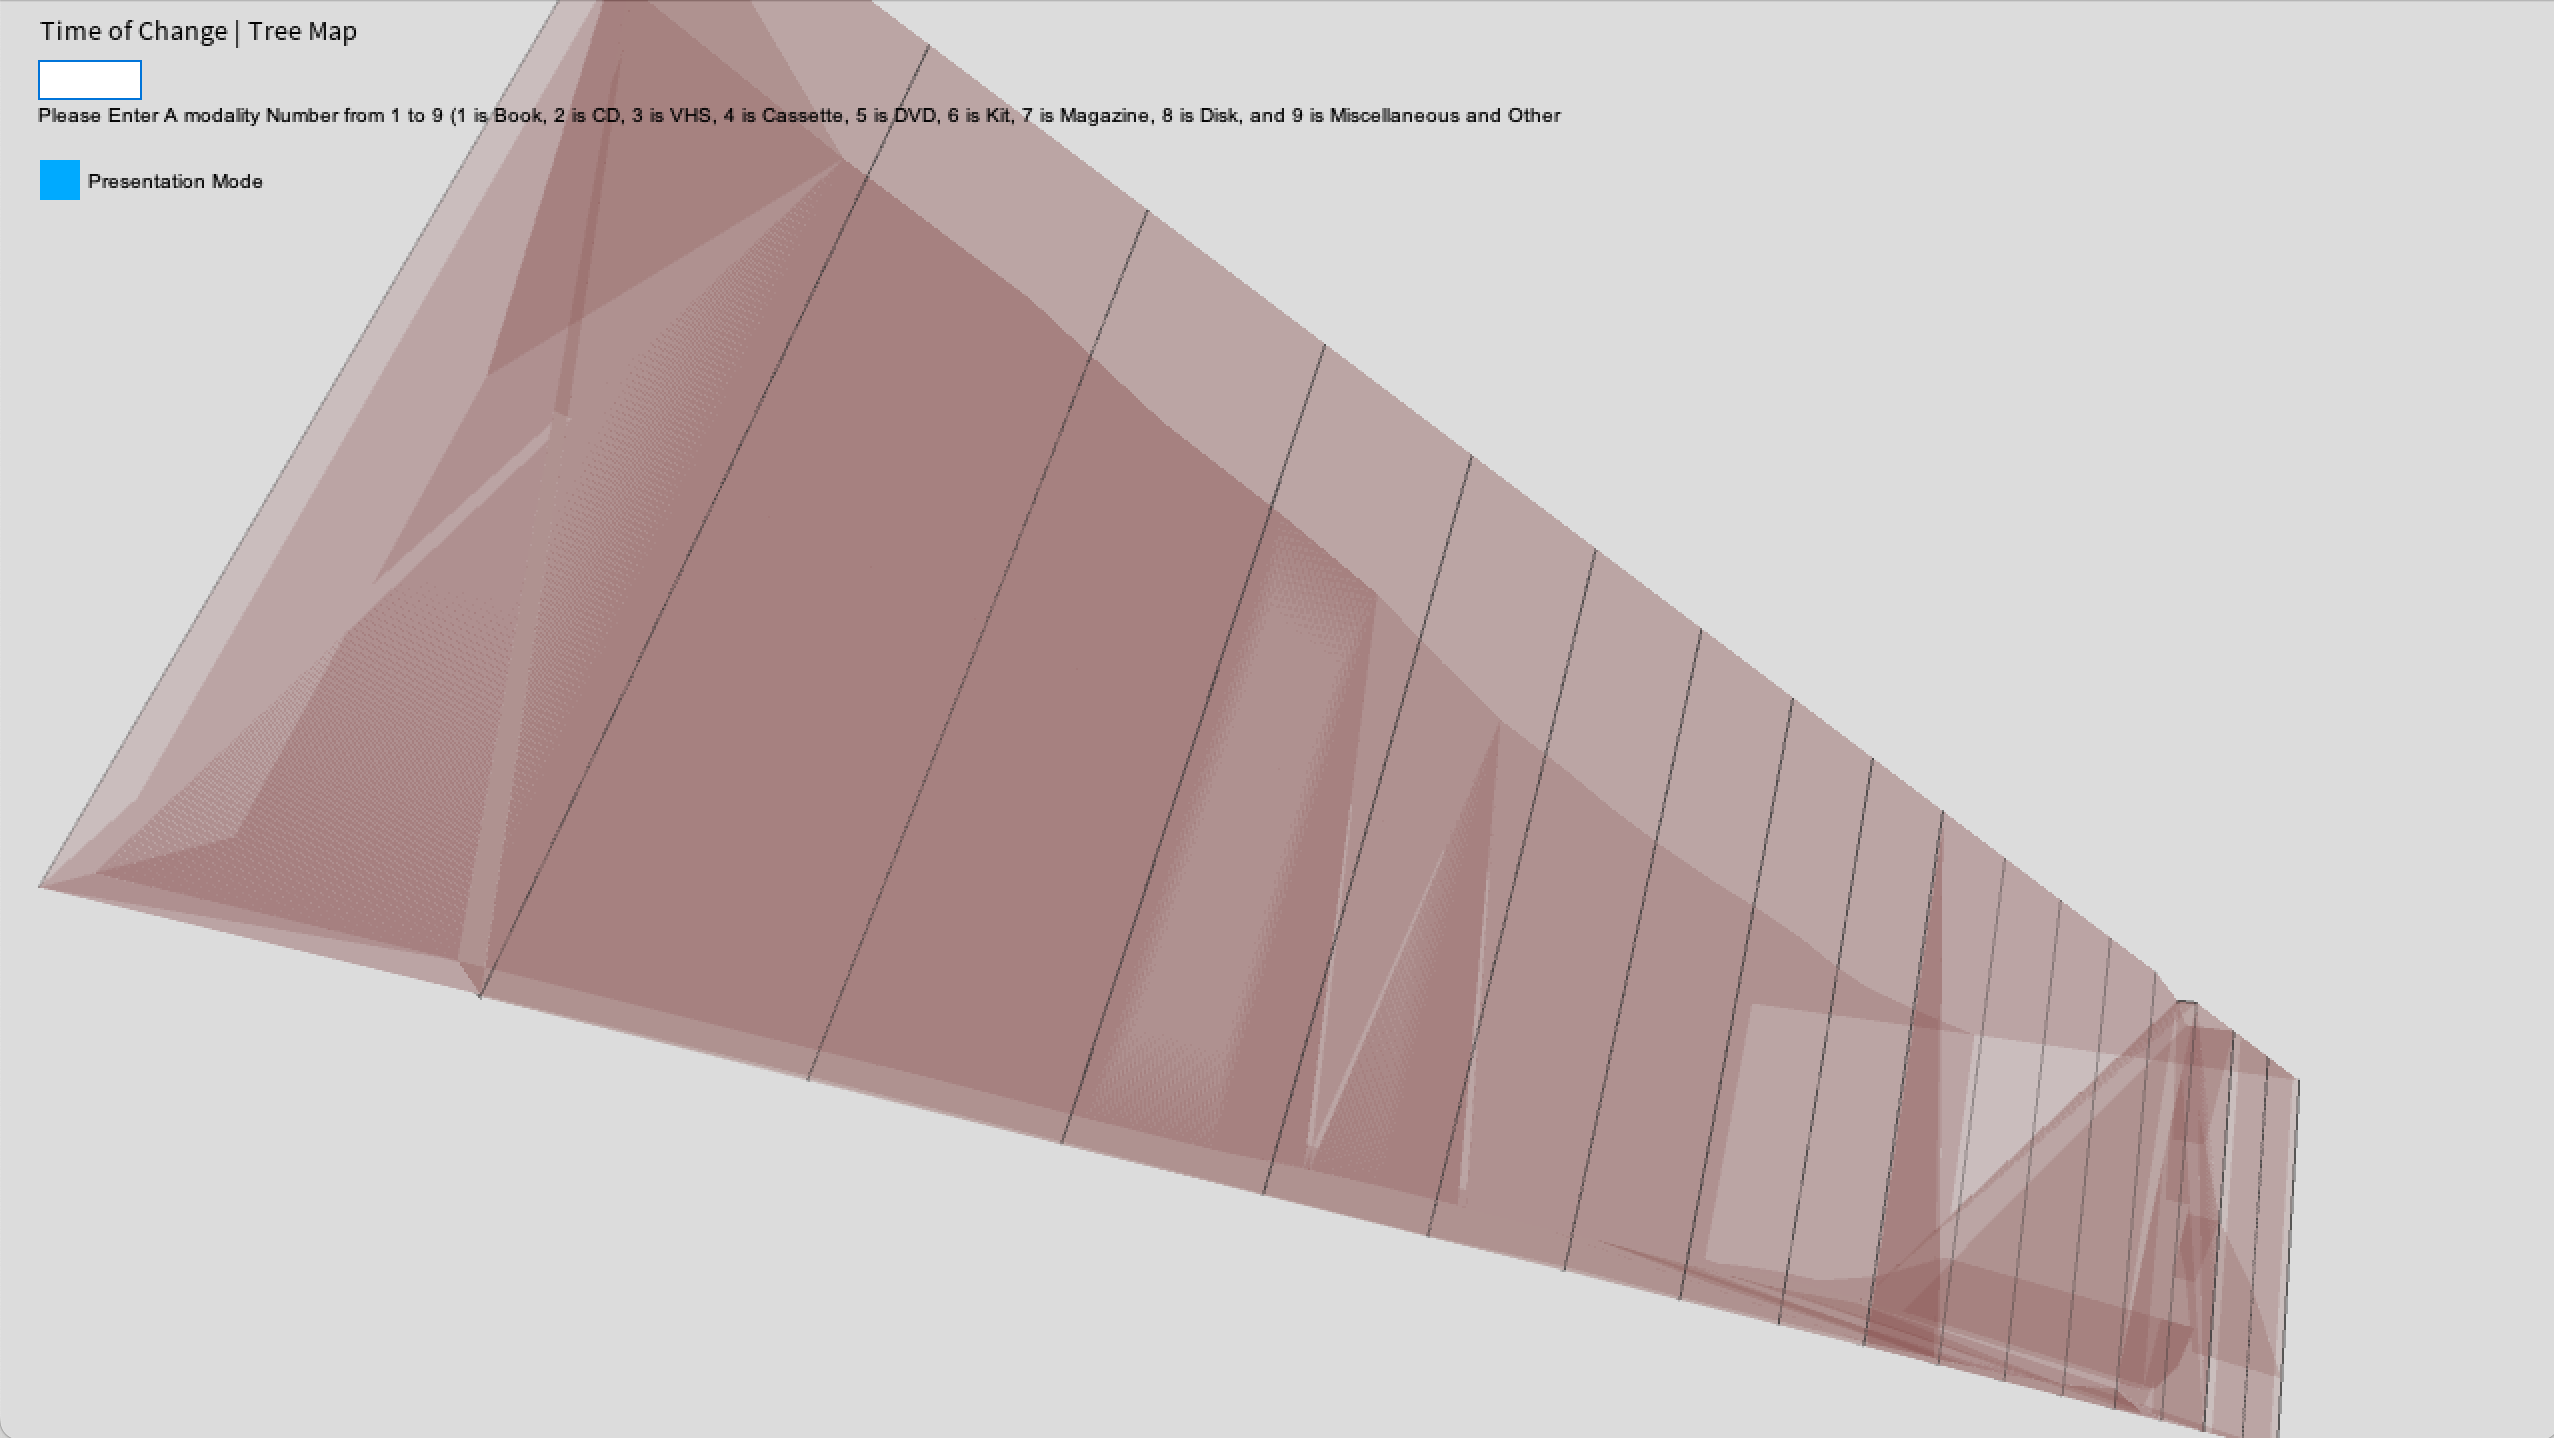
Figure 2: 3D treemap visualization of modalities across time with no modality highlighting
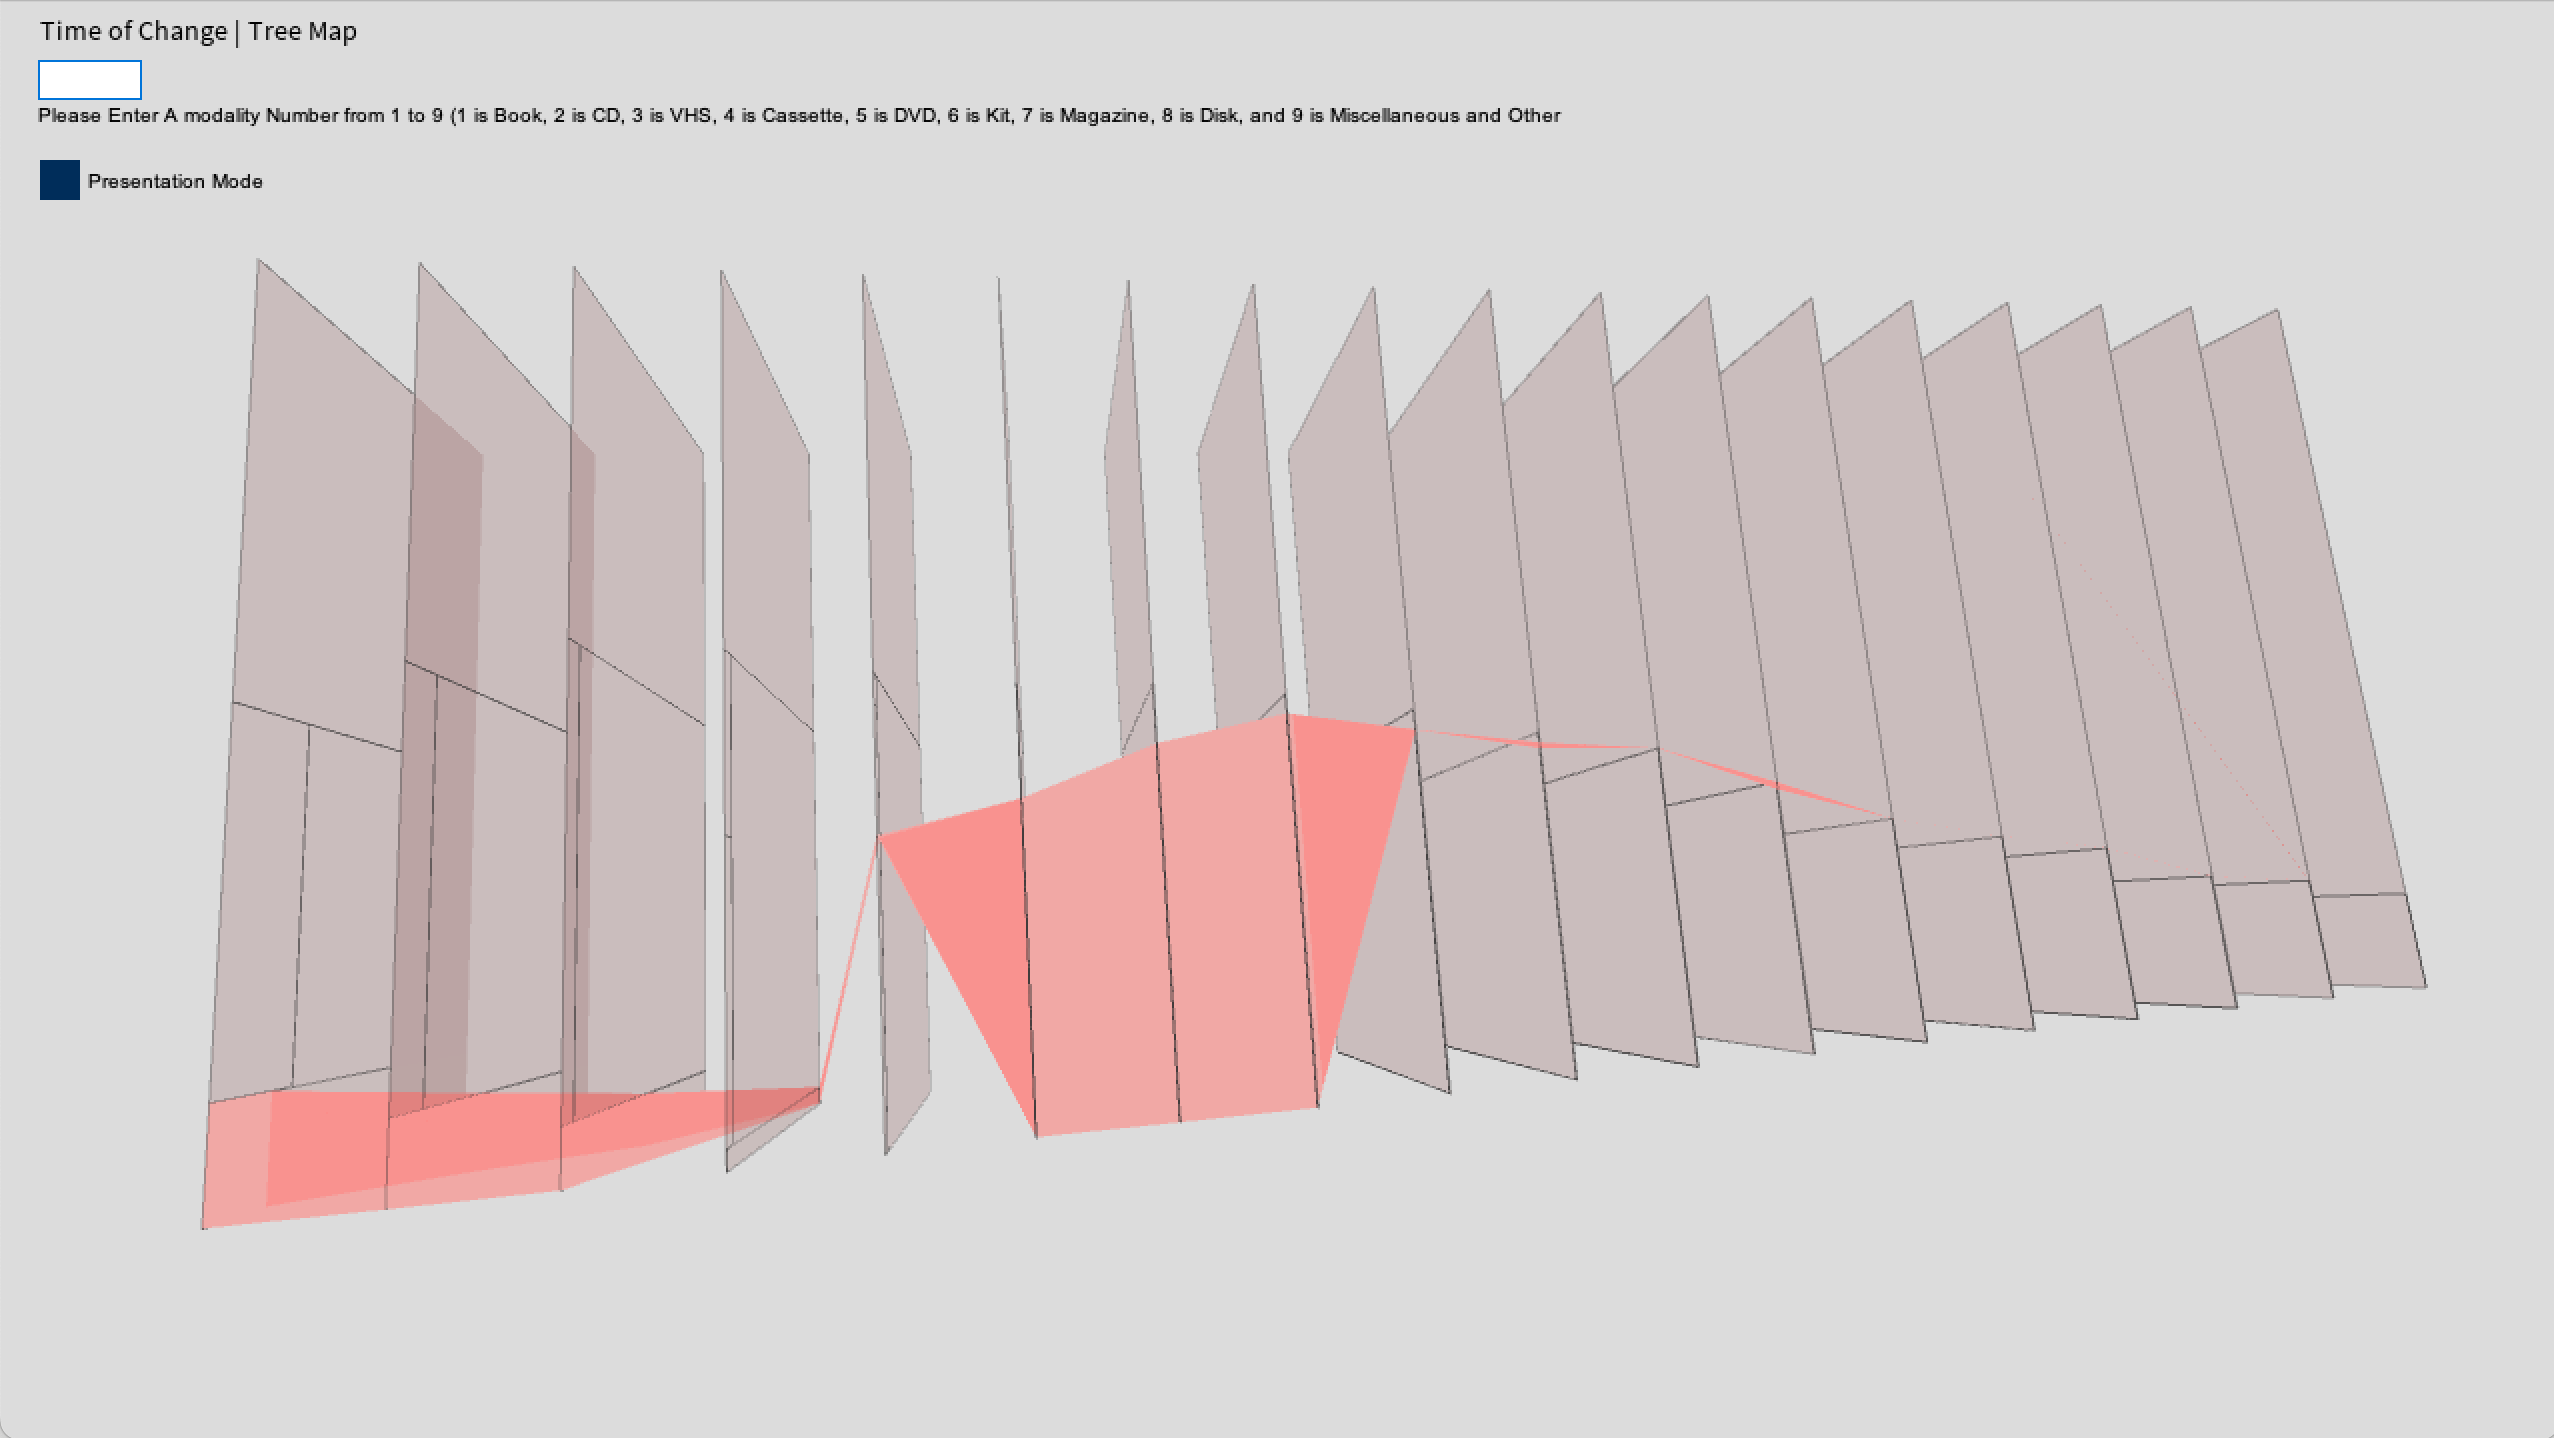
Figure 3: 3D treemap visualization of modalities across time with a single modality highlight
Each layer represents a year, and the highlight represents differences in proportion across the year for each modality that is highlighted. This complements the existing comparisons between modalities each year within each layer, which itself is a simple 2D treemap. However, a number of visual difficulties still existed at this point, such as color differentials, so the process continued to improve on such gaps.
Figure 2: 3D treemap visualization of modalities across time with no modality highlighting
Figure 3: 3D treemap visualization of modalities across time with a single modality highlight
Each layer represents a year, and the highlight represents differences in proportion across the year for each modality that is highlighted. This complements the existing comparisons between modalities each year within each layer, which itself is a simple 2D treemap. However, a number of visual difficulties still existed at this point, such as color differentials, so the process continued to improve on such gaps.
Final result
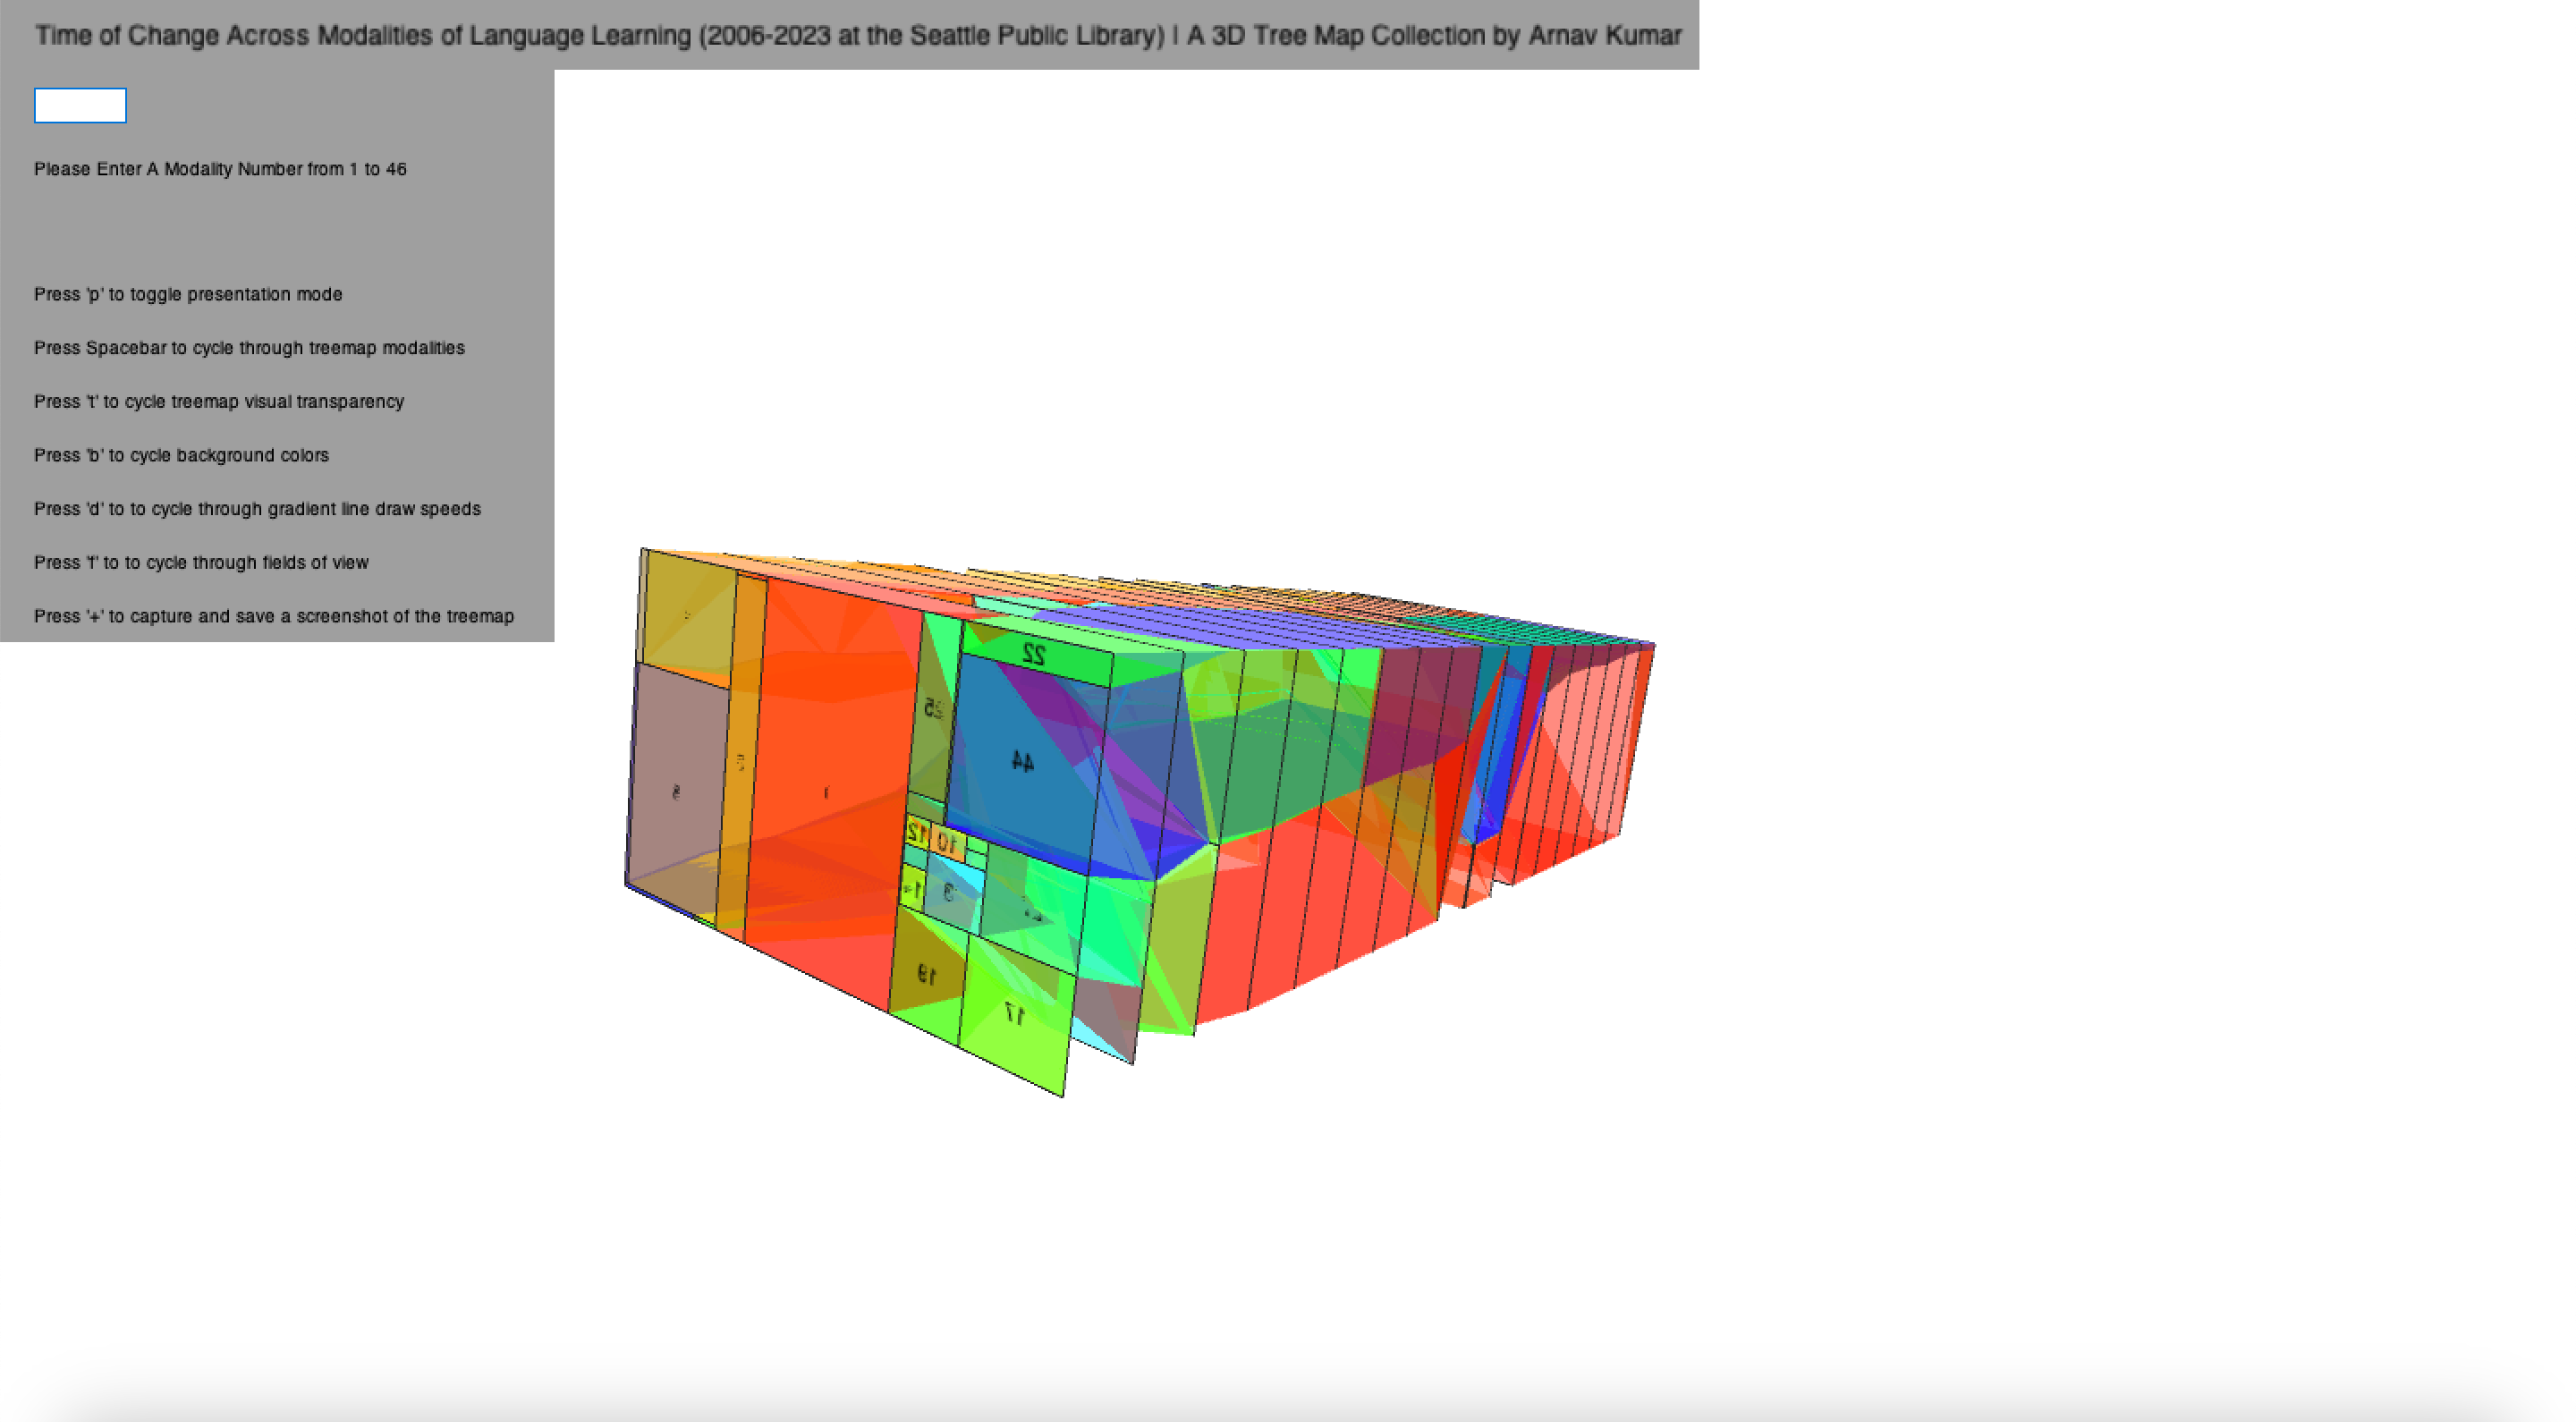
Figure 4: Final 3D treemap visualization with no modality highlighting
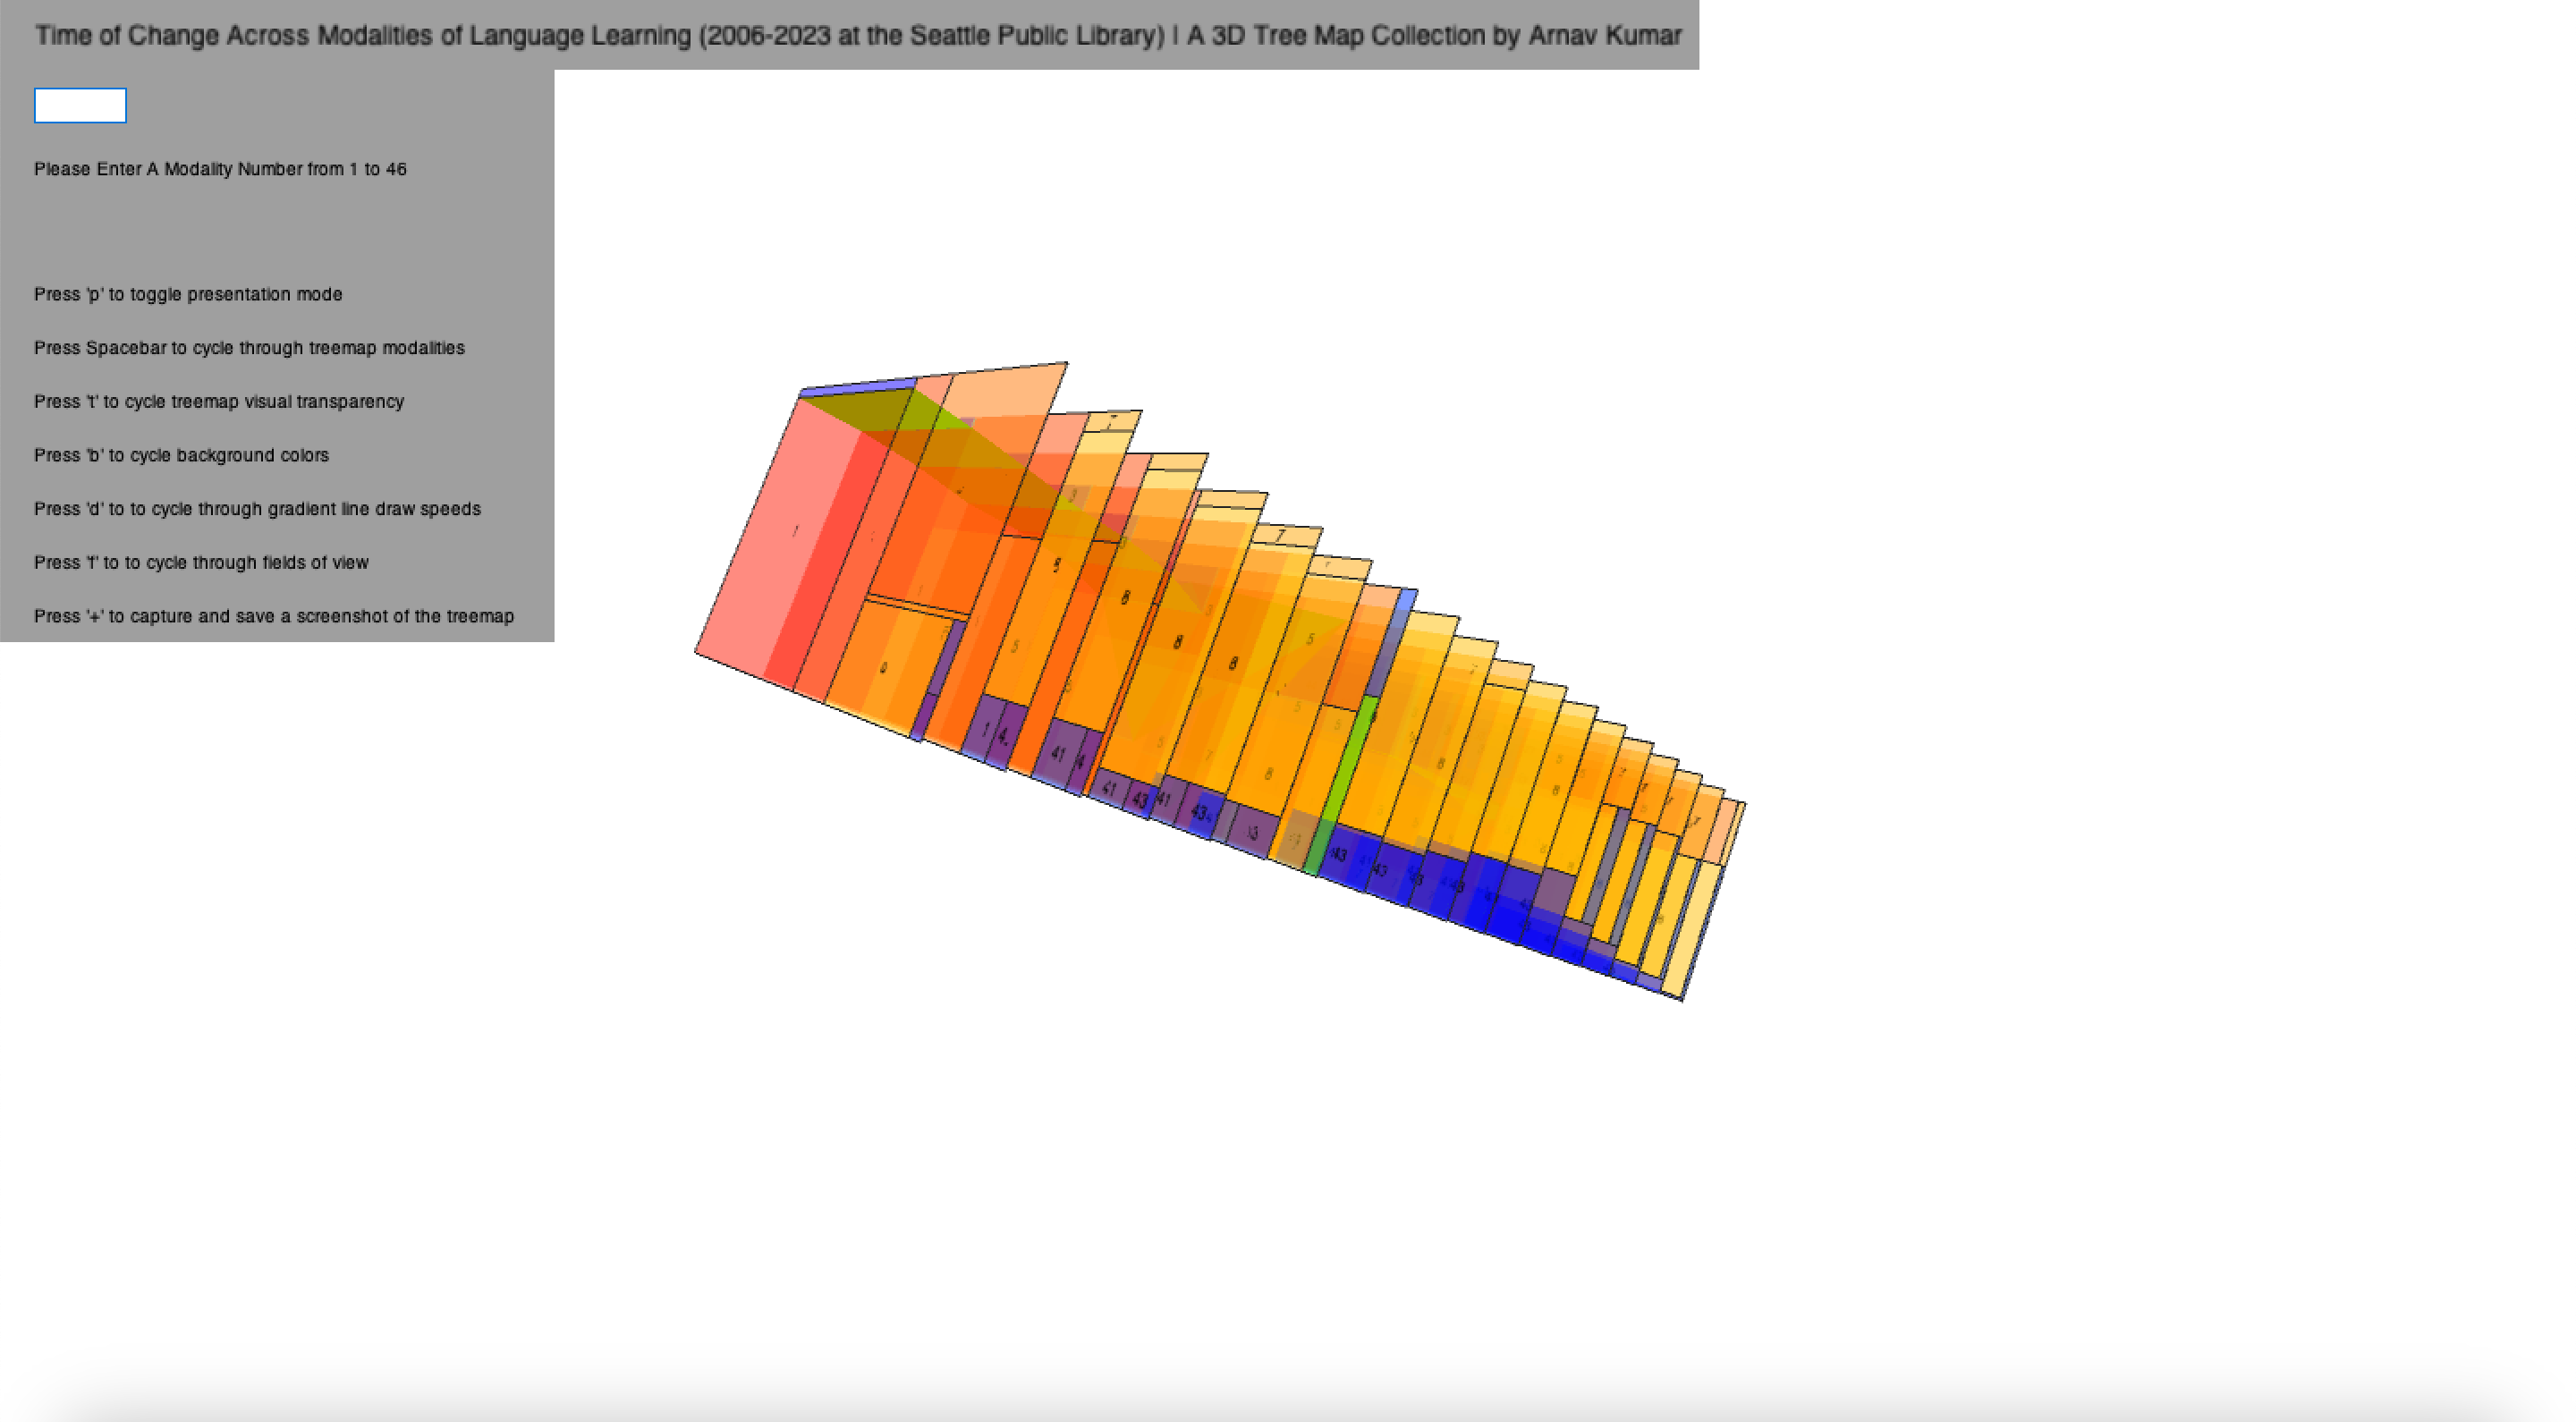
Figure 5: Final 3D treemap visualization with a single modality highlight
Overall, even a cursory glance at the visualization shows two modalities as dominant across the years, and these are Books and CD’s. Even then, book checkout proportions consistently shadow the proportion of CD’s by a few multiples, which might be attested to rapidly changing and perhaps burdensome media player technology which accommodates media like CD’s, while books remain simple, convenient, and independent of additional components required to make them work. In relation to language learning, however, CD’s still bring a visual and audio component that books do not, which may explain its persistence throughout the years.
Bringing the discussion outside of the SPL, apps like Duolingo are rapidly and consistently rising in popularity every year, having long overshadowed companies like Rosetta Stone, which used to be the dominant language learning center in the early 2000’s. If the results of this analysis indicate anything, however, it would be that books will likely still hold their popularity at libraries in relation to language learning, albeit at an increasingly smaller proportion when compared to the app industry.
Future work building on this visualization could include more granular feature sets such as data point plotting on each treemap with a self contained 2D coordinate system in each proportion square on each treemap. Data points may include things like number of checkouts and title as showed in Figure 1, although this may be more difficult to achieve with existing template implementations.
Code