Detecting Outliers in Checkout Periods at the SPL:
Twilight by Stephanie Myers
Twilight by Stephanie Myers
MAT 259, 2023
Brianna Griffin
Concept
I will be looking at irregularities in the data set through outliers. Specifically, this project will analyze the checkout time in days for the first
book in the Twilight series by Stephenie Meyer, namely "Twilight". Published in 2005, the book is based in Forks, Washington around 100 miles
away from Seattle. Thus, it has a lot of prevalence within the Seattle Public Library with many years of checkout and checkin data.
Specifically, I would like to answer the following questions:
- Are there any observations that do not fit the rest of the data set?
- When and why do these observations occur?
- How do the outliers affect statistics of the sample?
- Are there any observations that do not fit the rest of the data set?
- When and why do these observations occur?
- How do the outliers affect statistics of the sample?
Queries
Below are some of the queries I used to identify and explore the data.
1. The first chunk of code identifies how many outliers there are in my data sample. An observation is considered an outlier if it is located outside 3 standard deviations of the mean. For the below SQL code `time_CO` measures the difference between checkout and return of the book. The code, thus, identifies, data points as outliers if they have a `time_CO` that is greater than 96 days.
1. The first chunk of code identifies how many outliers there are in my data sample. An observation is considered an outlier if it is located outside 3 standard deviations of the mean. For the below SQL code `time_CO` measures the difference between checkout and return of the book. The code, thus, identifies, data points as outliers if they have a `time_CO` that is greater than 96 days.
                SELECT
                    OutlierStatus, COUNT(OutlierStatus)
                FROM
                    (SELECT
                        time_CO,
                            CASE
                                WHEN time_CO > 96 THEN 'outlier'
                                ELSE 'not an outlier'
                            END AS OutlierStatus
                    FROM
                        (SELECT
                        cout, cin, DATEDIFF(cin, cout) AS time_CO
                    FROM
                        spl_2016.inraw
                    WHERE
                        title = 'Twilight'
                            AND itemtype LIKE '%bk'
                            AND callNumber = 'YA MEYER'
                            AND YEAR(cout) != 1970) sub) sub2
                GROUP BY OutlierStatus;
2. The following SQL query investigates the popularity in checkouts of the first three Twilight movies.
I was curious about how the movies affected the set of outliers in checkout time.
             SELECT
                year_CO, title_movie, COUNT(year_CO)
            FROM
                (SELECT
                    YEAR(cout) AS year_CO, UPPER(title) as title_movie
                FROM
                    spl_2016.outraw
                WHERE
                    title = 'Twilight' OR title = 'New Moon'
                        OR title = 'Eclipse'
                        AND itemtype LIKE '%dvd') sub
            GROUP BY 1 , 2
            ORDER BY 1 ASC;
3. The next query will calculate the Average and Standard Deviation of the population with the outliers removed.
This will show how the outliers have affected the major statistics that are often used to categorize a population.
            SELECT
                AVG(time_CO), STDDEV(time_CO)
            FROM
                (SELECT
                    time_CO
                FROM
                    (SELECT
                    cout,
                        time_CO,
                        CASE
                            WHEN time_CO > 96 THEN 'outlier'
                            ELSE 'not an outlier'
                        END AS OutlierStatus
                FROM
                    (SELECT
                    cout, cin, DATEDIFF(cin, cout) AS time_CO
                FROM
                    spl_2016.inraw
                WHERE
                    title = 'Twilight'
                        AND itemtype LIKE '%bk'
                        AND callNumber = 'YA MEYER'
                        AND YEAR(cout) != 1970) sub) sub2
                WHERE
                    OutlierStatus = 'not an outlier') sub3;
Preliminary Analysis
Since this project focusses on the checkout period for those checking out Twilight by Stephanie Myers,
I began looking at the average checkout time per year of the book. This can also be seen as the amount
of time it took someone to read the book per year (on average).
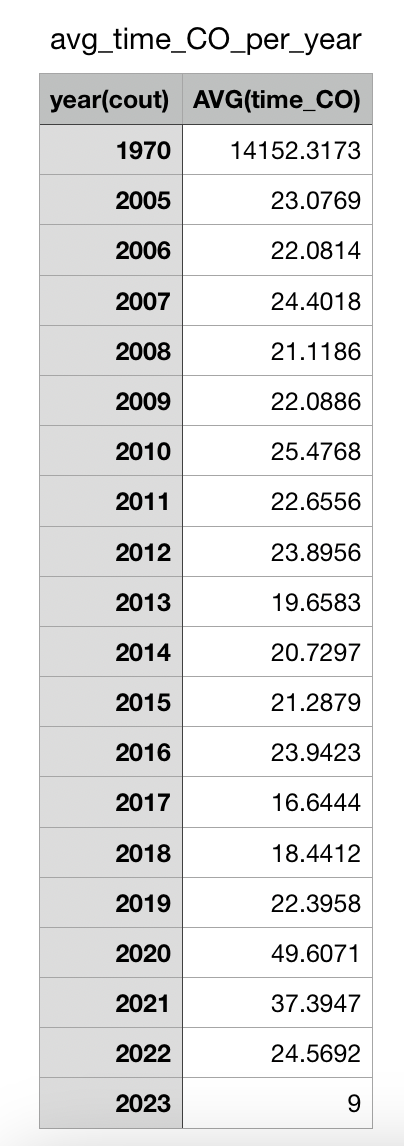
Clearly, the anomalies of books being checkout out during 1970 is made clear. We know this cannot be accurate due to the nature of the database. Following, 2020 has the largest average of 49.61 days while 2023 has the minimum number of days for checkout; only 9.
Another, preliminary finding was the average and standard deviation of the target population. I saw the below results.
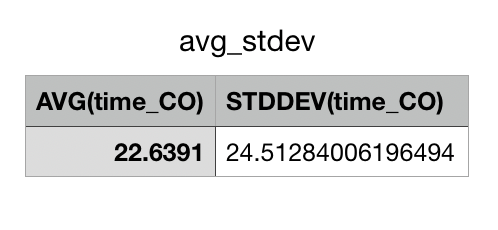
Process
I followed the following process to sequentially analyse my target data set and answer the
3 key questions that I asked in the beginning. I began by looking at the average and standard
deviation of checkout time for the book. Then, I detected outliers in the population. To better
understand why these outliers are occuring, I analysed the checkouts of the movie release. To
conclude my analysis, I took a look at the average and standard deviation with the outliers removed
from the population.
Final result
1. Are there any observations that do not fit the rest of the data set?
Yes. Out of the 7,816 observations in the sample, 56 were categorized as outliers and data points that did not fit the rest of the data set.
Below is a plot of the outliers grouped by day of checkout on the x-axis. It can be seen that most of the outliers occured between the years of 2007 and 2013.
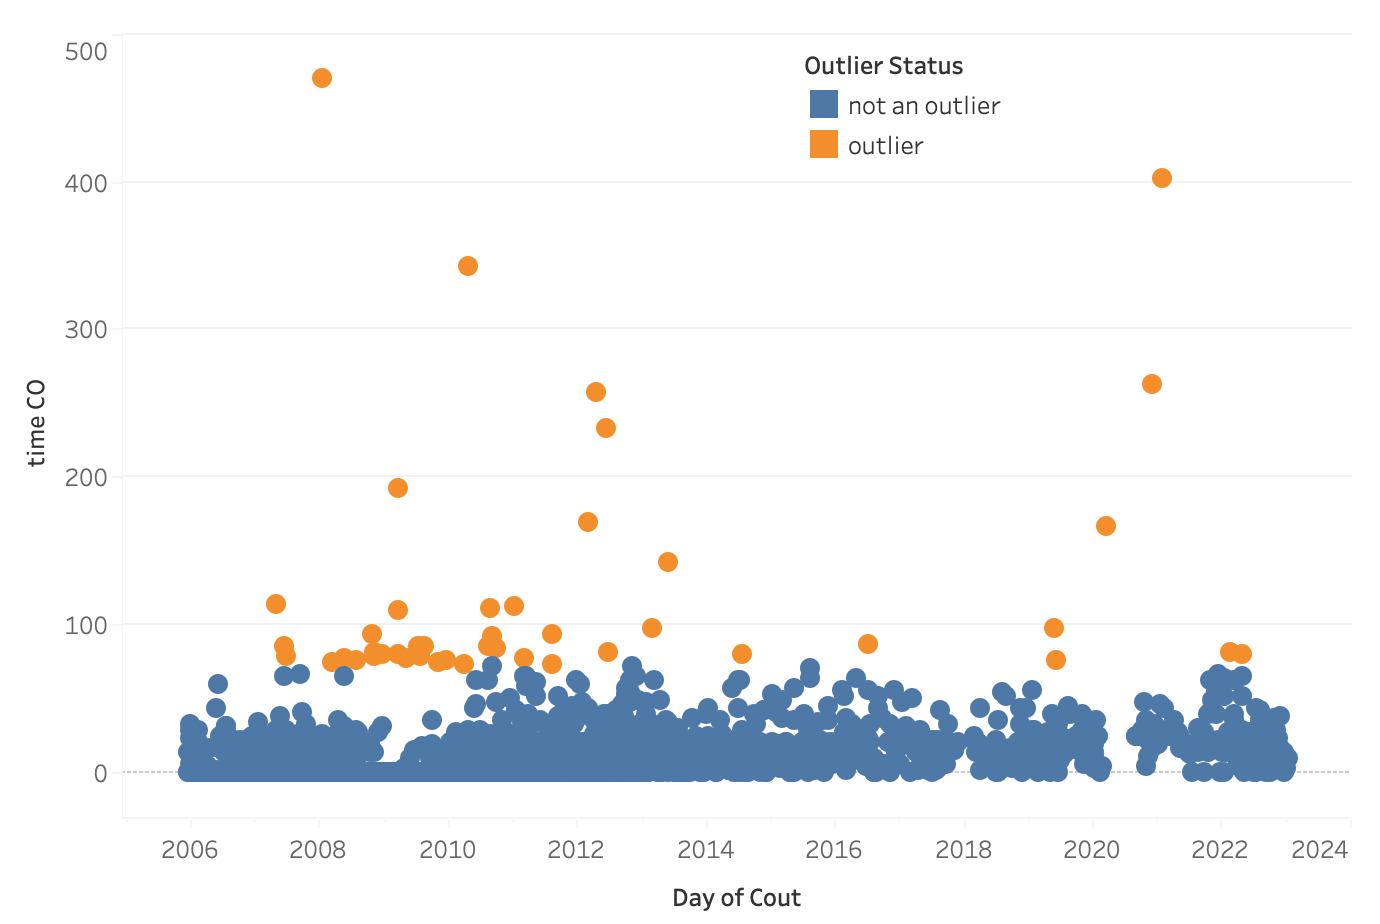
2. When and why do these observations occur?
Through my analysis and research, I came up with the below 3 hypotheses for why these outliers may be occuring.
The average did not change much, but the standard deviation decreased significantly. This makes sense as the derivation of the sample has now decreased with the outliers being removed.
Yes. Out of the 7,816 observations in the sample, 56 were categorized as outliers and data points that did not fit the rest of the data set.
Below is a plot of the outliers grouped by day of checkout on the x-axis. It can be seen that most of the outliers occured between the years of 2007 and 2013.
2. When and why do these observations occur?
Through my analysis and research, I came up with the below 3 hypotheses for why these outliers may be occuring.
- Movie Correlation: The outliers occurred at the same time that the movie checkout spikes. Thus, may be some correlation between long checkout times and movie checkouts between SPL library customers.
- 2009 Library Shutdown: In 2009, from Monday, August 31 through Sunday, September 6 the Seattle Public Library shut down.The one week library shutdown occurred during the same year as the year with the maximum number of outliers (2009). It is a possibility that readers checked out their books sometime in 2009 and meant to return it during the week of the shut down. Furthermore, they were forced to return them further on in the year causing a large gap in checkout periods.
- Library Popularity : 2009 had the highest number of checkouts and checkins, followed by 2008 and 2010. This is the same result as the number of outliers in our sample. It could be that these years have more outliers since the library was the most popular during those years.
The average did not change much, but the standard deviation decreased significantly. This makes sense as the derivation of the sample has now decreased with the outliers being removed.
Code