Immigration requisite in popular countries
MAT 259, 2022
Ziyu Zhang
Concept
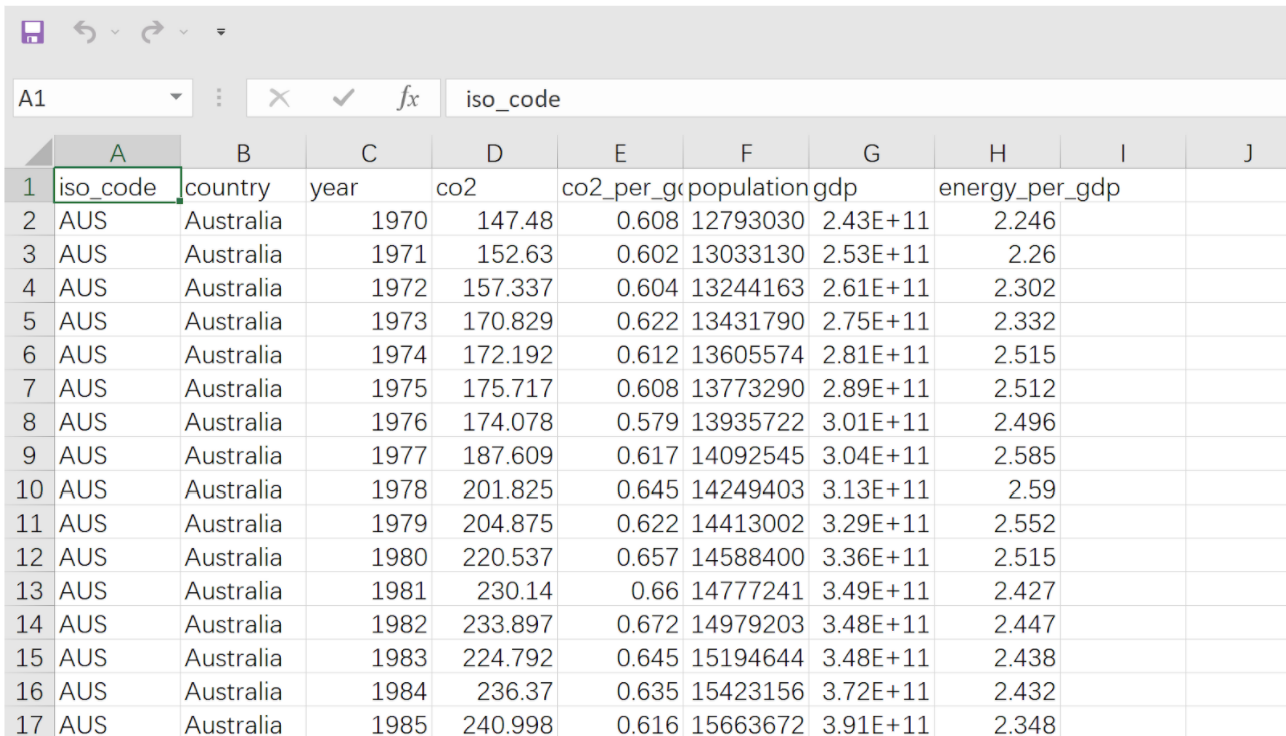
The topic of my final project is about analyzing the environment and economy of the countries where people most want to
immigrate, specifically in the aspects of emissions of CO2, the increasing change of population and GDP development.
And then comparing these three aspects, we can get the most healthy, green and economic-friendly country that suits
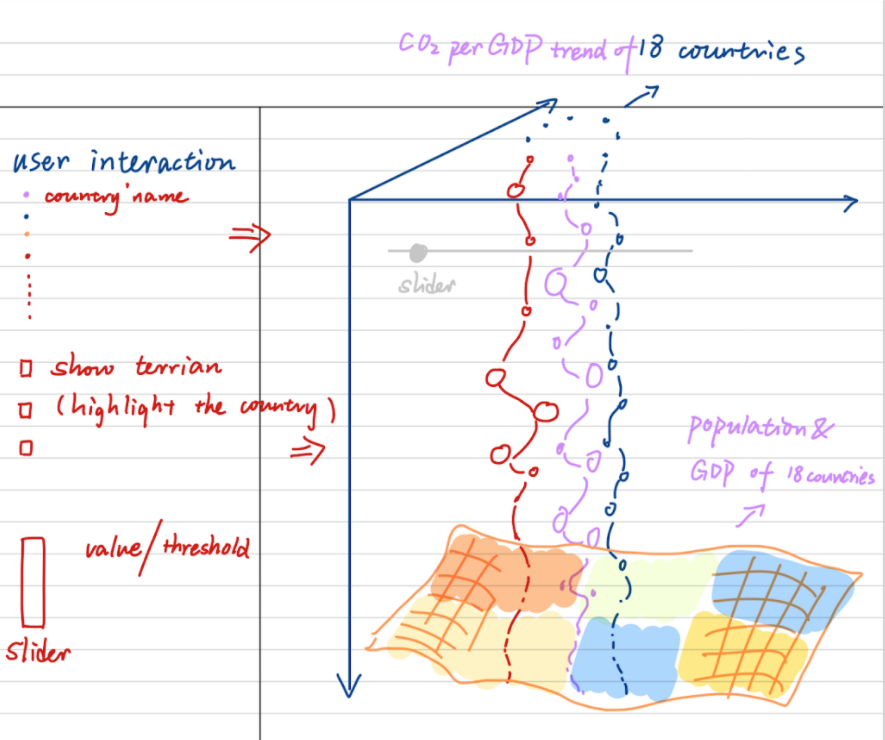
immigration most. My original plan is to create different forms for three aspects. dots and lines are for the change
of CO2 emission, polygons are for the population and the GDP increase accordingly..
Preliminary sketches
Process
My original idea was to combine the terrain and the waving dots together as visualizaiton of the CO2 emission and the
GDP/population development. However, the data for GDP/population is not suitable for the terrain square system.
Therefore, I chose lines to represent instead.


Final result


The lines in the first picture represent the distribution of the population and GDP of each country from 1970 to 2018 in the coordinate system with the year as the x coordinate, the population increase as the z coordinate, and the GDP as the y coordinate. Figures 2 to 4 show CO2 emissions and energy consumption per GDP for 18 countries. The size of the dot represents the carbon dioxide emissions of the country in the year. The larger the radius of the dot, the higher the average GDP emissions. Similarly, the line segment representing energy consumption is the same way. The color order is ranked by the list on the website I linked above.
Code