How turkey vultures migrate
in their surrounding environment
MAT 259, 2022
Zijian Wan
Concept
Quote from a paper I recently submitted: "As movement is arguably the most
significant way by which animals respond to changes in their surrounding
environment, it can serve as an instrument for environmental response and
understanding movement can elucidate the relations between environmental drivers
of animal behavior and demography (Eikelboom et al., 2020; Nathan et al., 2008)."
In this project, I would like to vividly visualize how animals interact with the surrounding environment (i.e., how environmental variables might influence the movement path selection) using the turkey vulture migration example.
In this project, I would like to vividly visualize how animals interact with the surrounding environment (i.e., how environmental variables might influence the movement path selection) using the turkey vulture migration example.
Data
The raw tracking datasets and environmental annotations were obtained from
Movebank (Bildstein et al., 2021)
The tracking dataset was preprocessed and clustered to obtain the dataset for
this visualization. As the paper is not yet published, I cannot share the codes
for preprocessing or clustering. But the datasets after those steps (attached)
are as follows:
Environment sample dataset: a series of systematically sampled points, each with a series of environmental variables corresponding to that location.
(17112 sample points in total)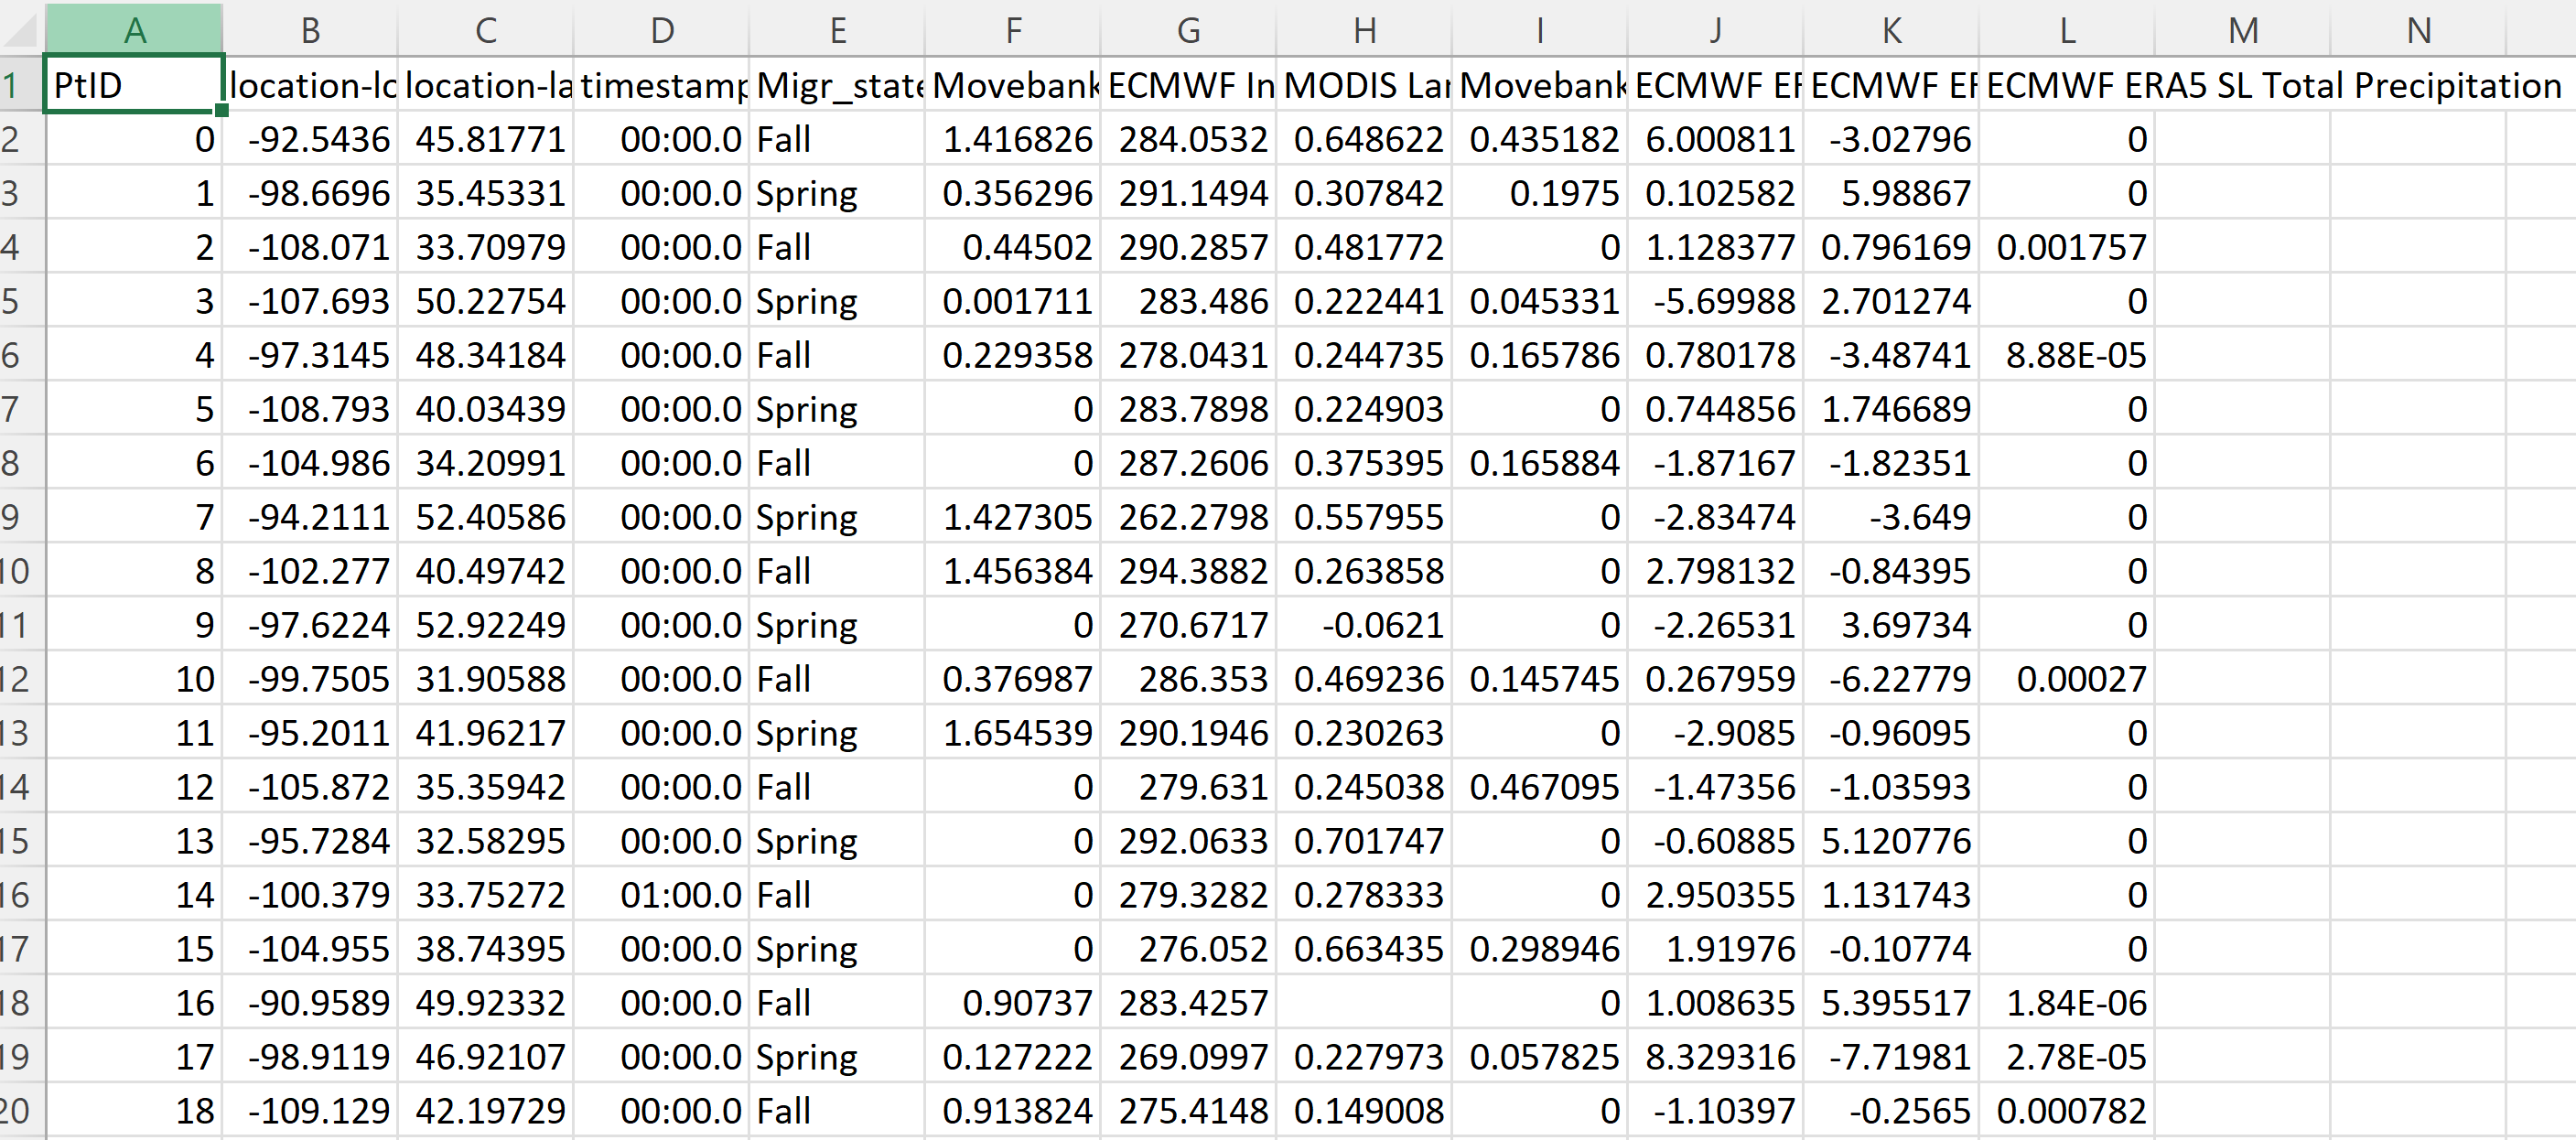
Turkey vulture dataset: tracking points recorded.
(16402 tracking points in total)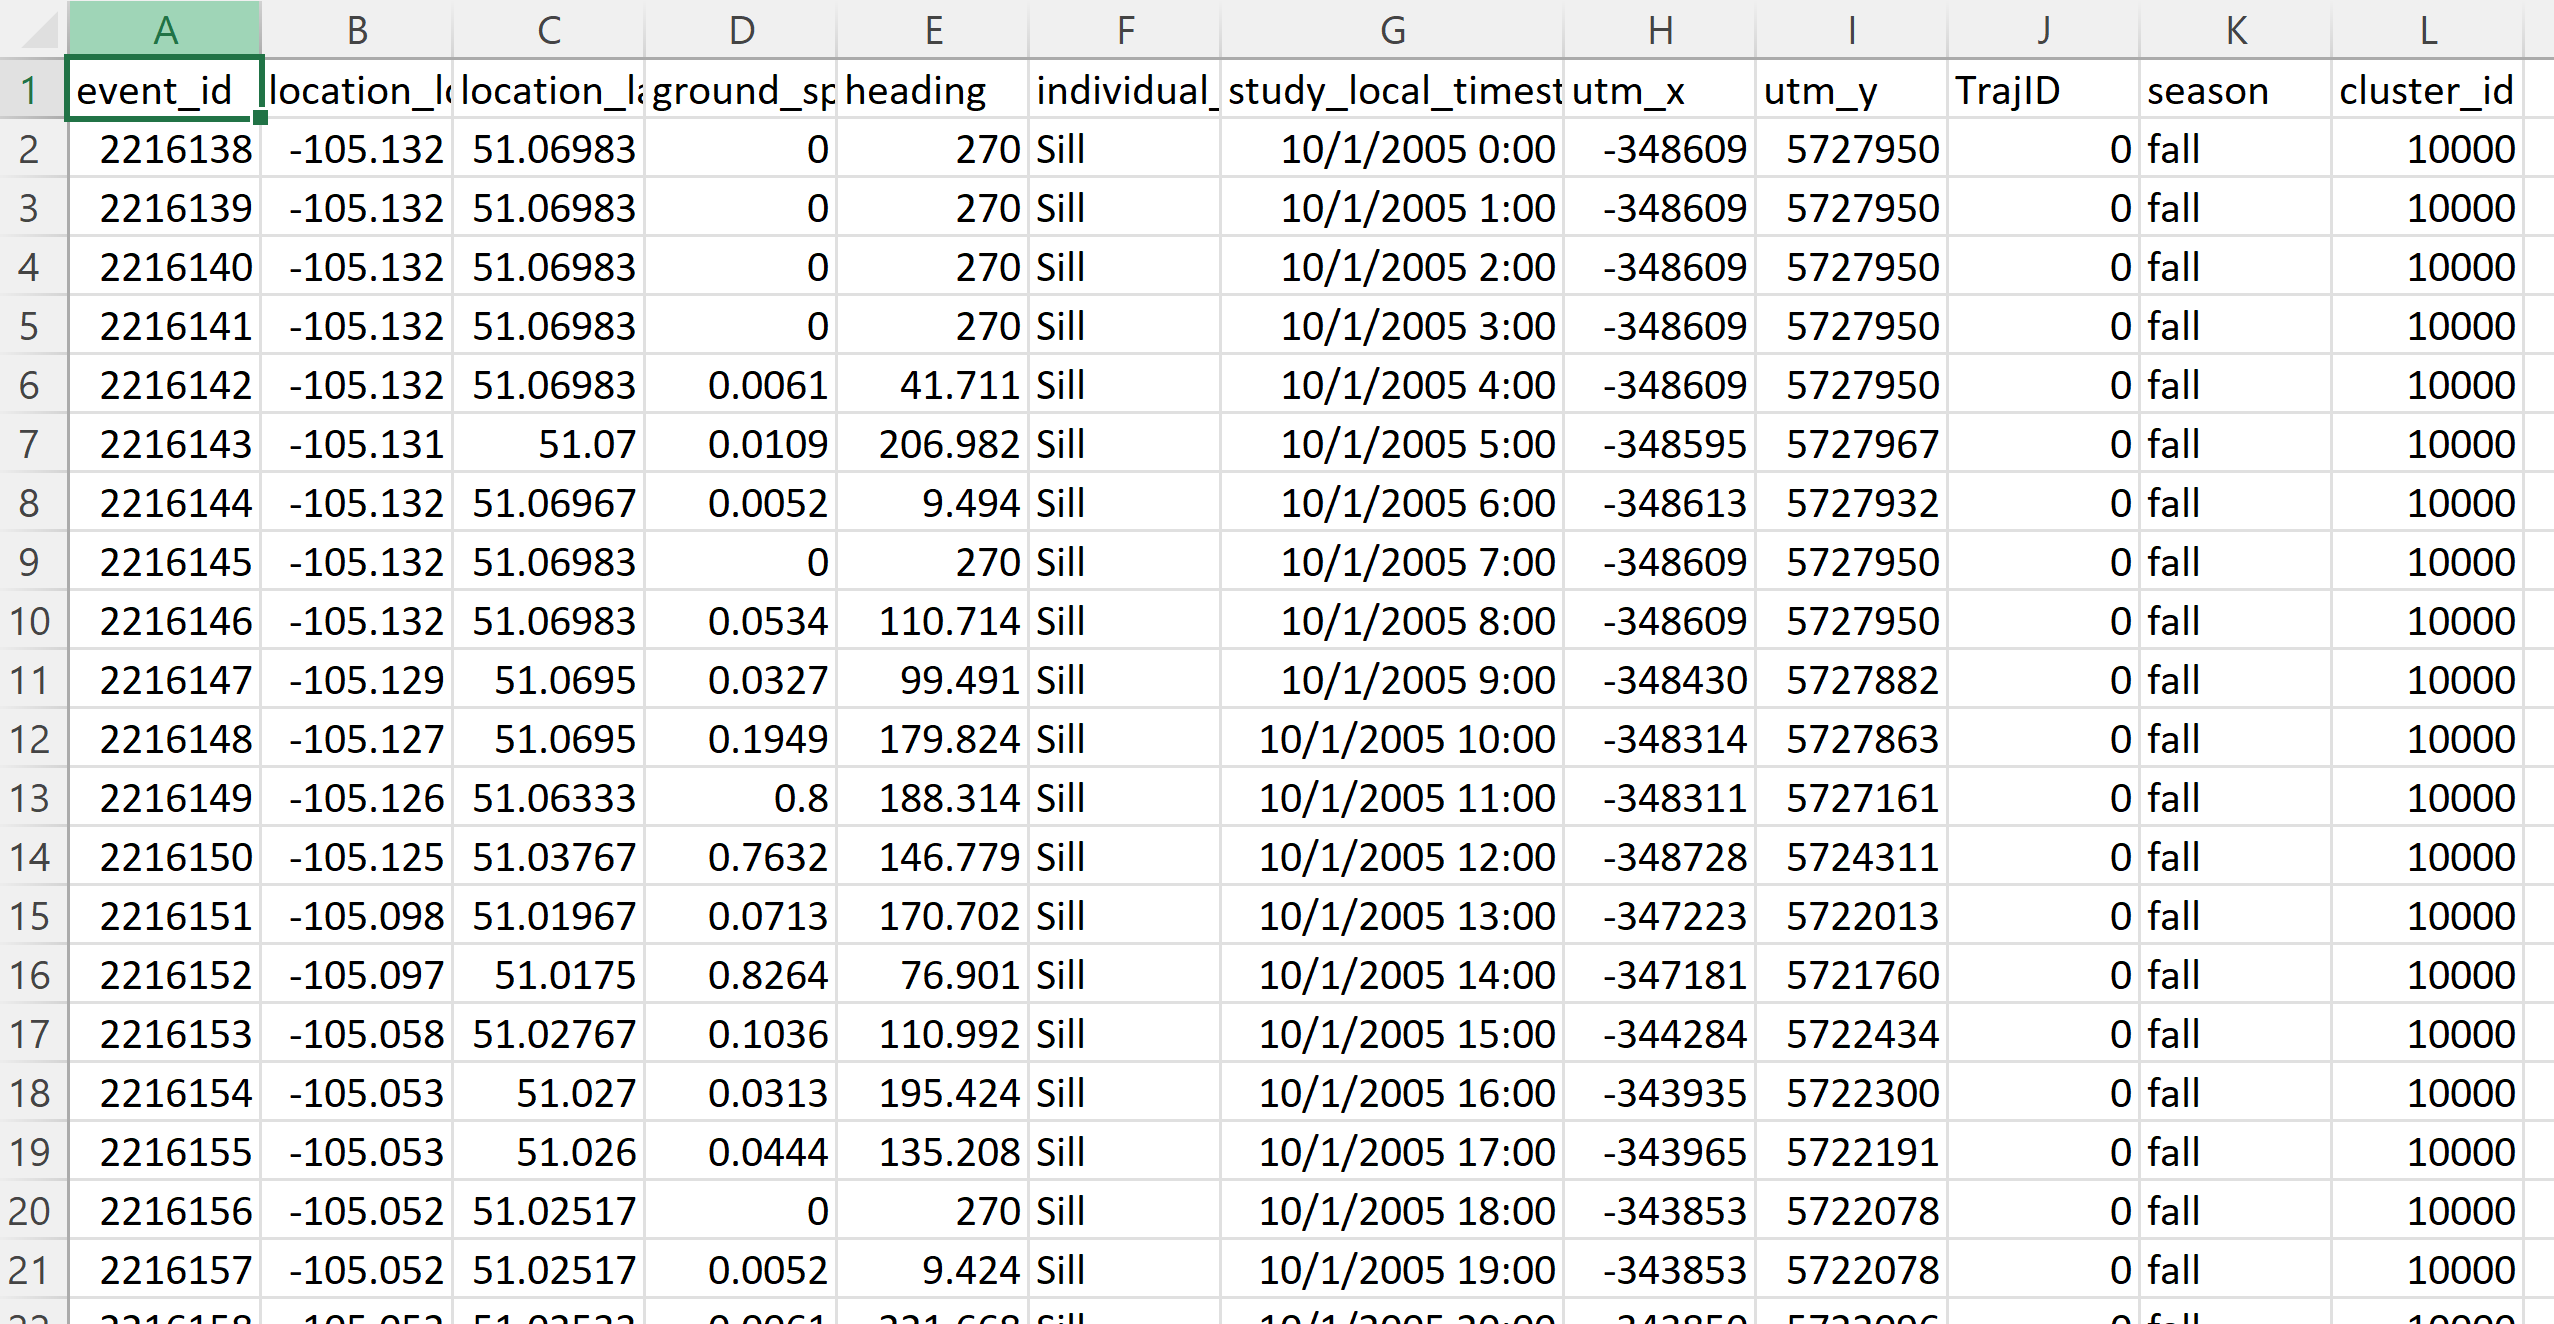
Environment sample dataset: a series of systematically sampled points, each with a series of environmental variables corresponding to that location.
(17112 sample points in total)
Turkey vulture dataset: tracking points recorded.
(16402 tracking points in total)
Preliminary sketches
The core idea is to visualize trajectories on top of environmental variables. I
found some examples online.
1. Daniel Shiffman Smoke particle system
2. Braun, E., Düpmeier, C., Mirbach, S., & Lang, U. (2017, May). 3D Volume Visualization of Environmental Data in the Web. In International Symposium on Environmental Software Systems (pp. 457-469). Springer, Cham.
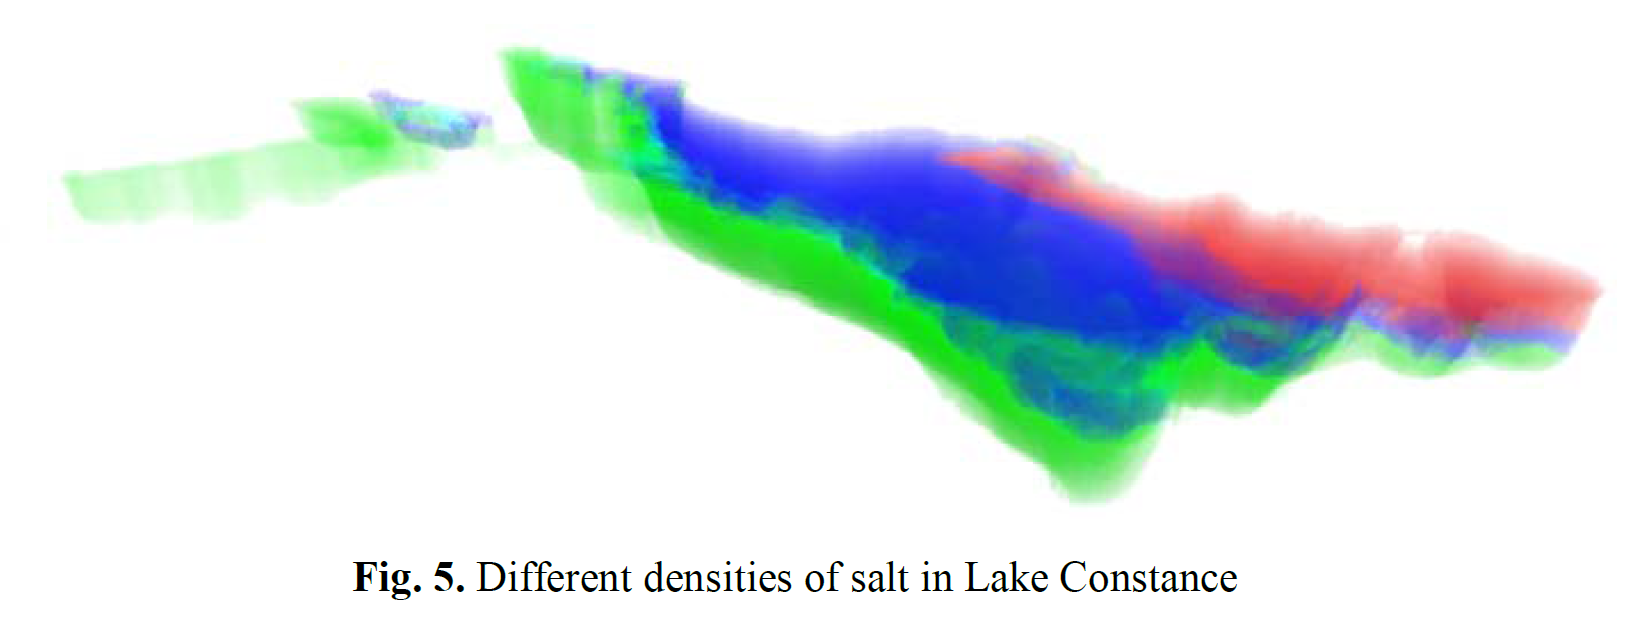
1. Daniel Shiffman Smoke particle system
2. Braun, E., Düpmeier, C., Mirbach, S., & Lang, U. (2017, May). 3D Volume Visualization of Environmental Data in the Web. In International Symposium on Environmental Software Systems (pp. 457-469). Springer, Cham.
Process
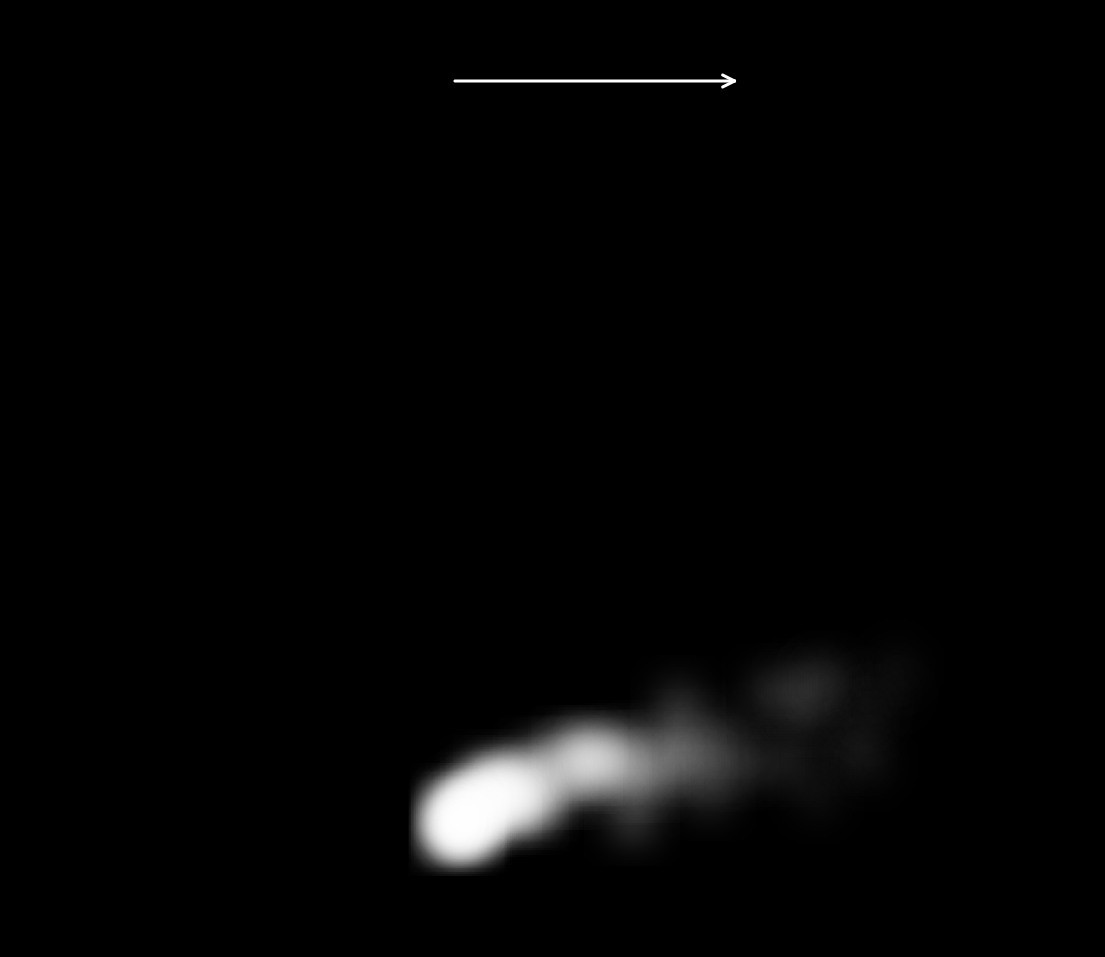
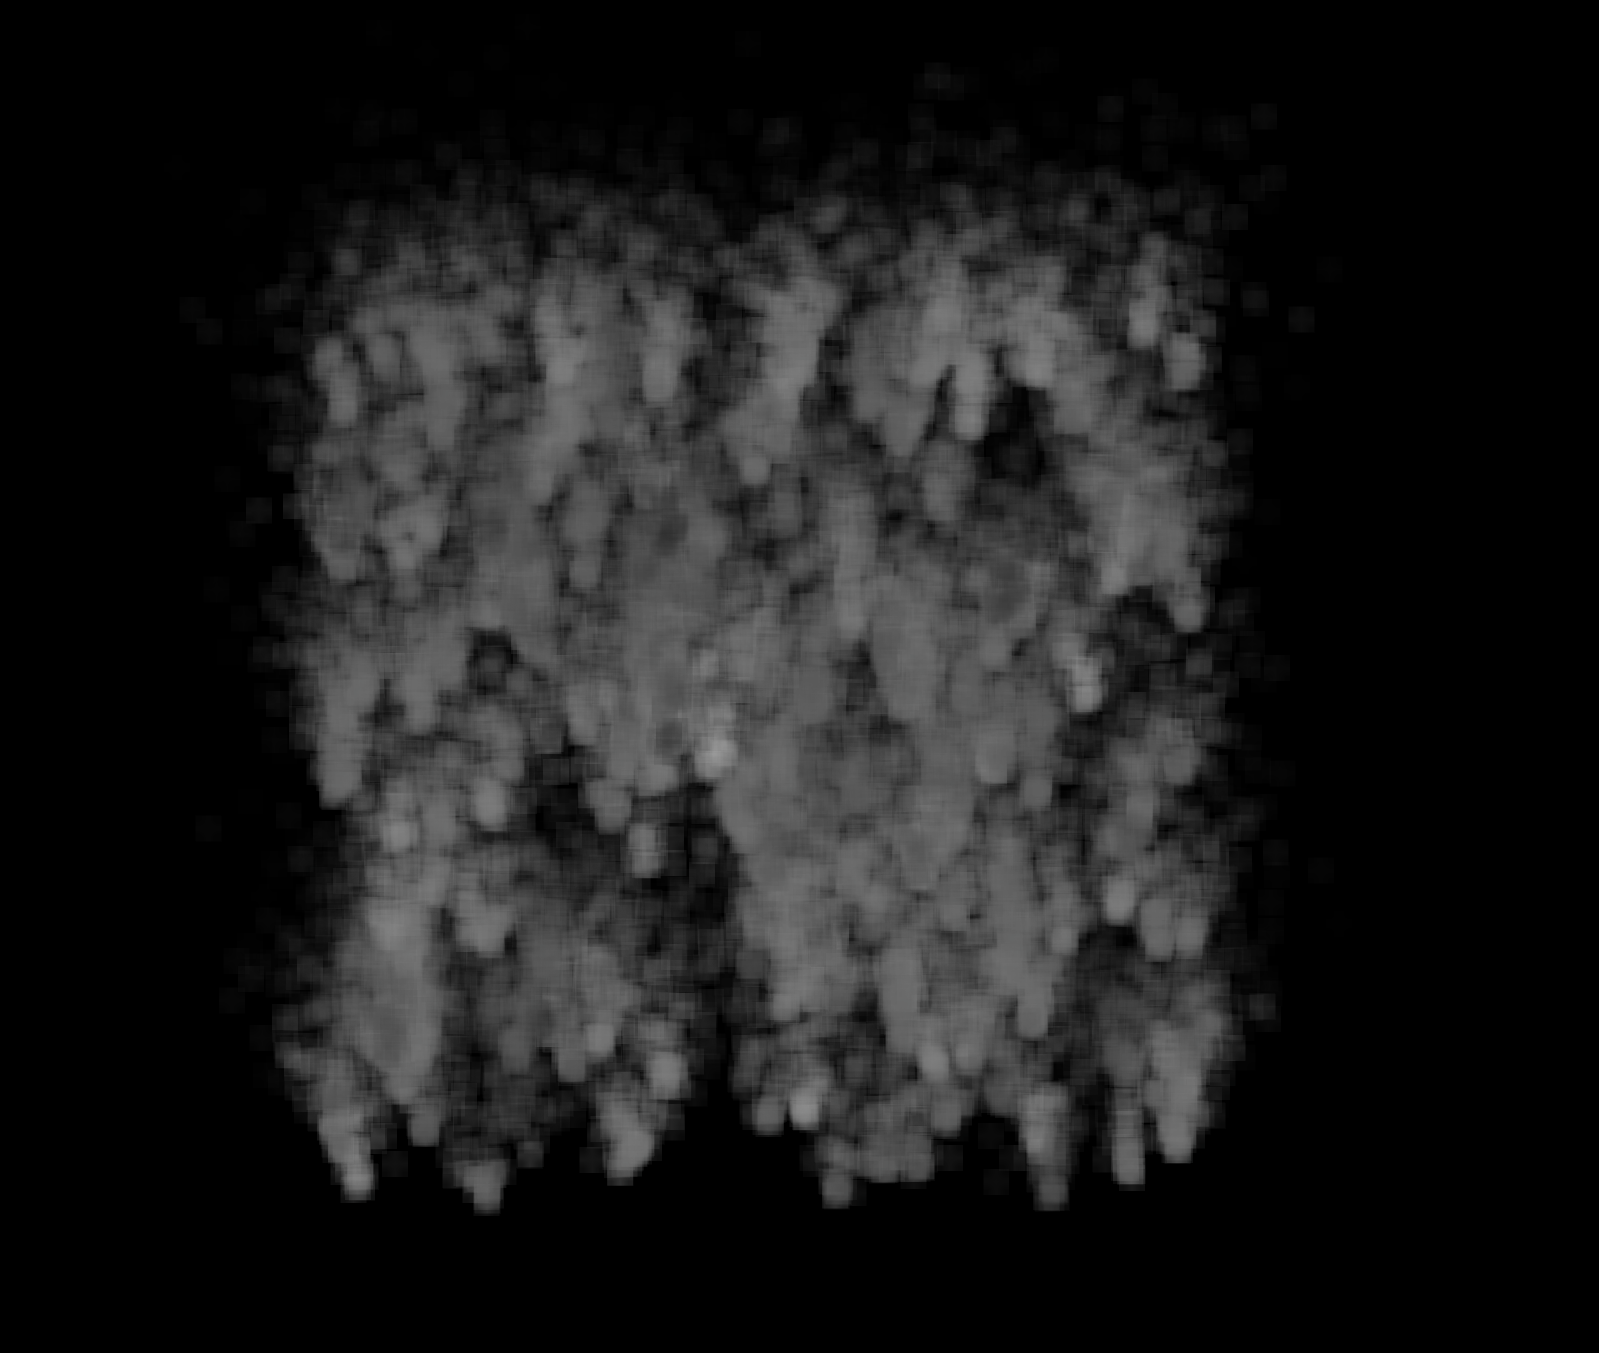
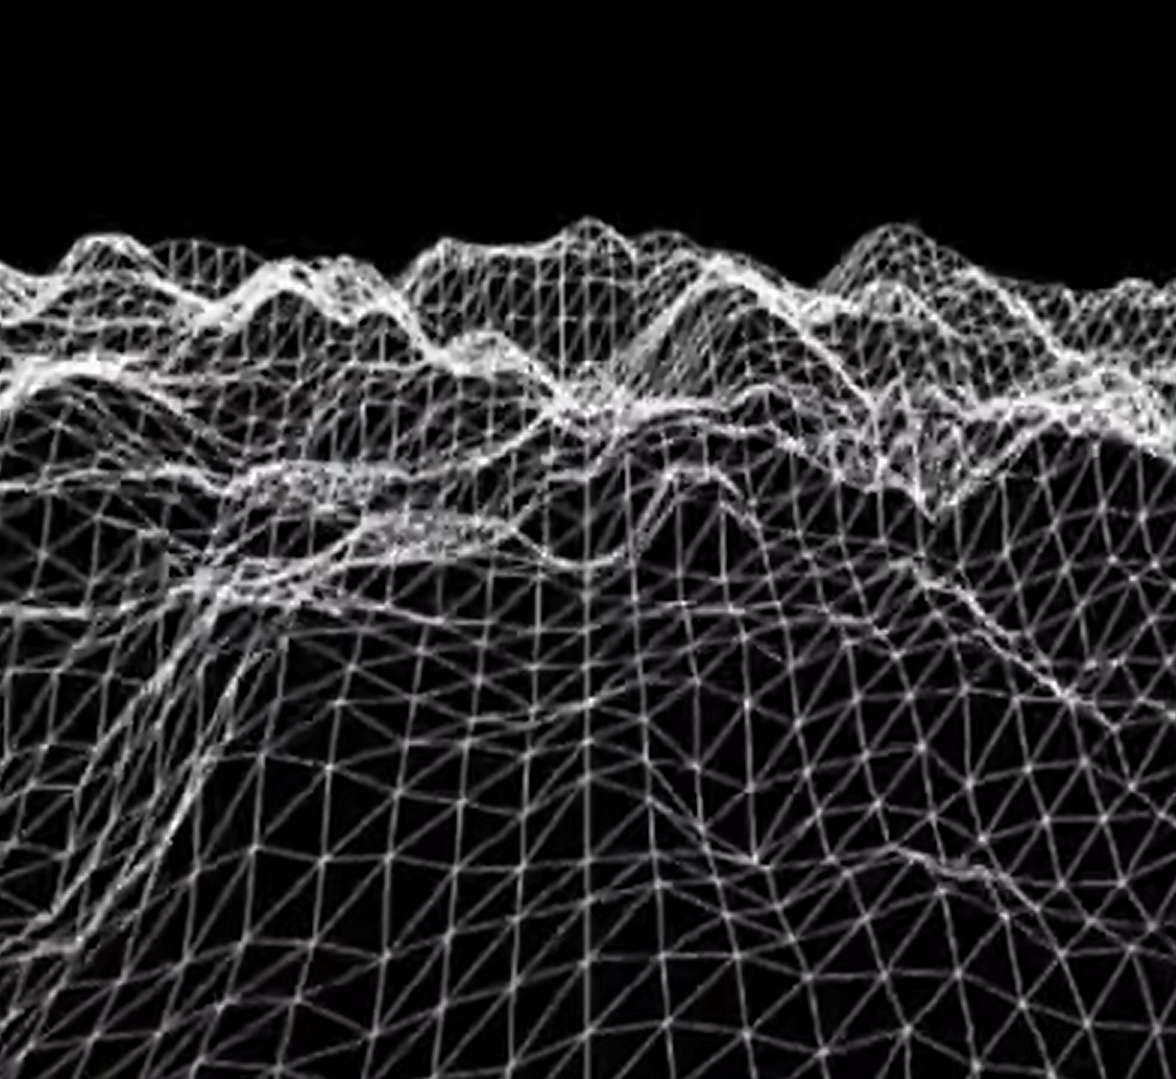
I experimented on multiple ways to visualize the environmental variables, such as
smoke and terrain
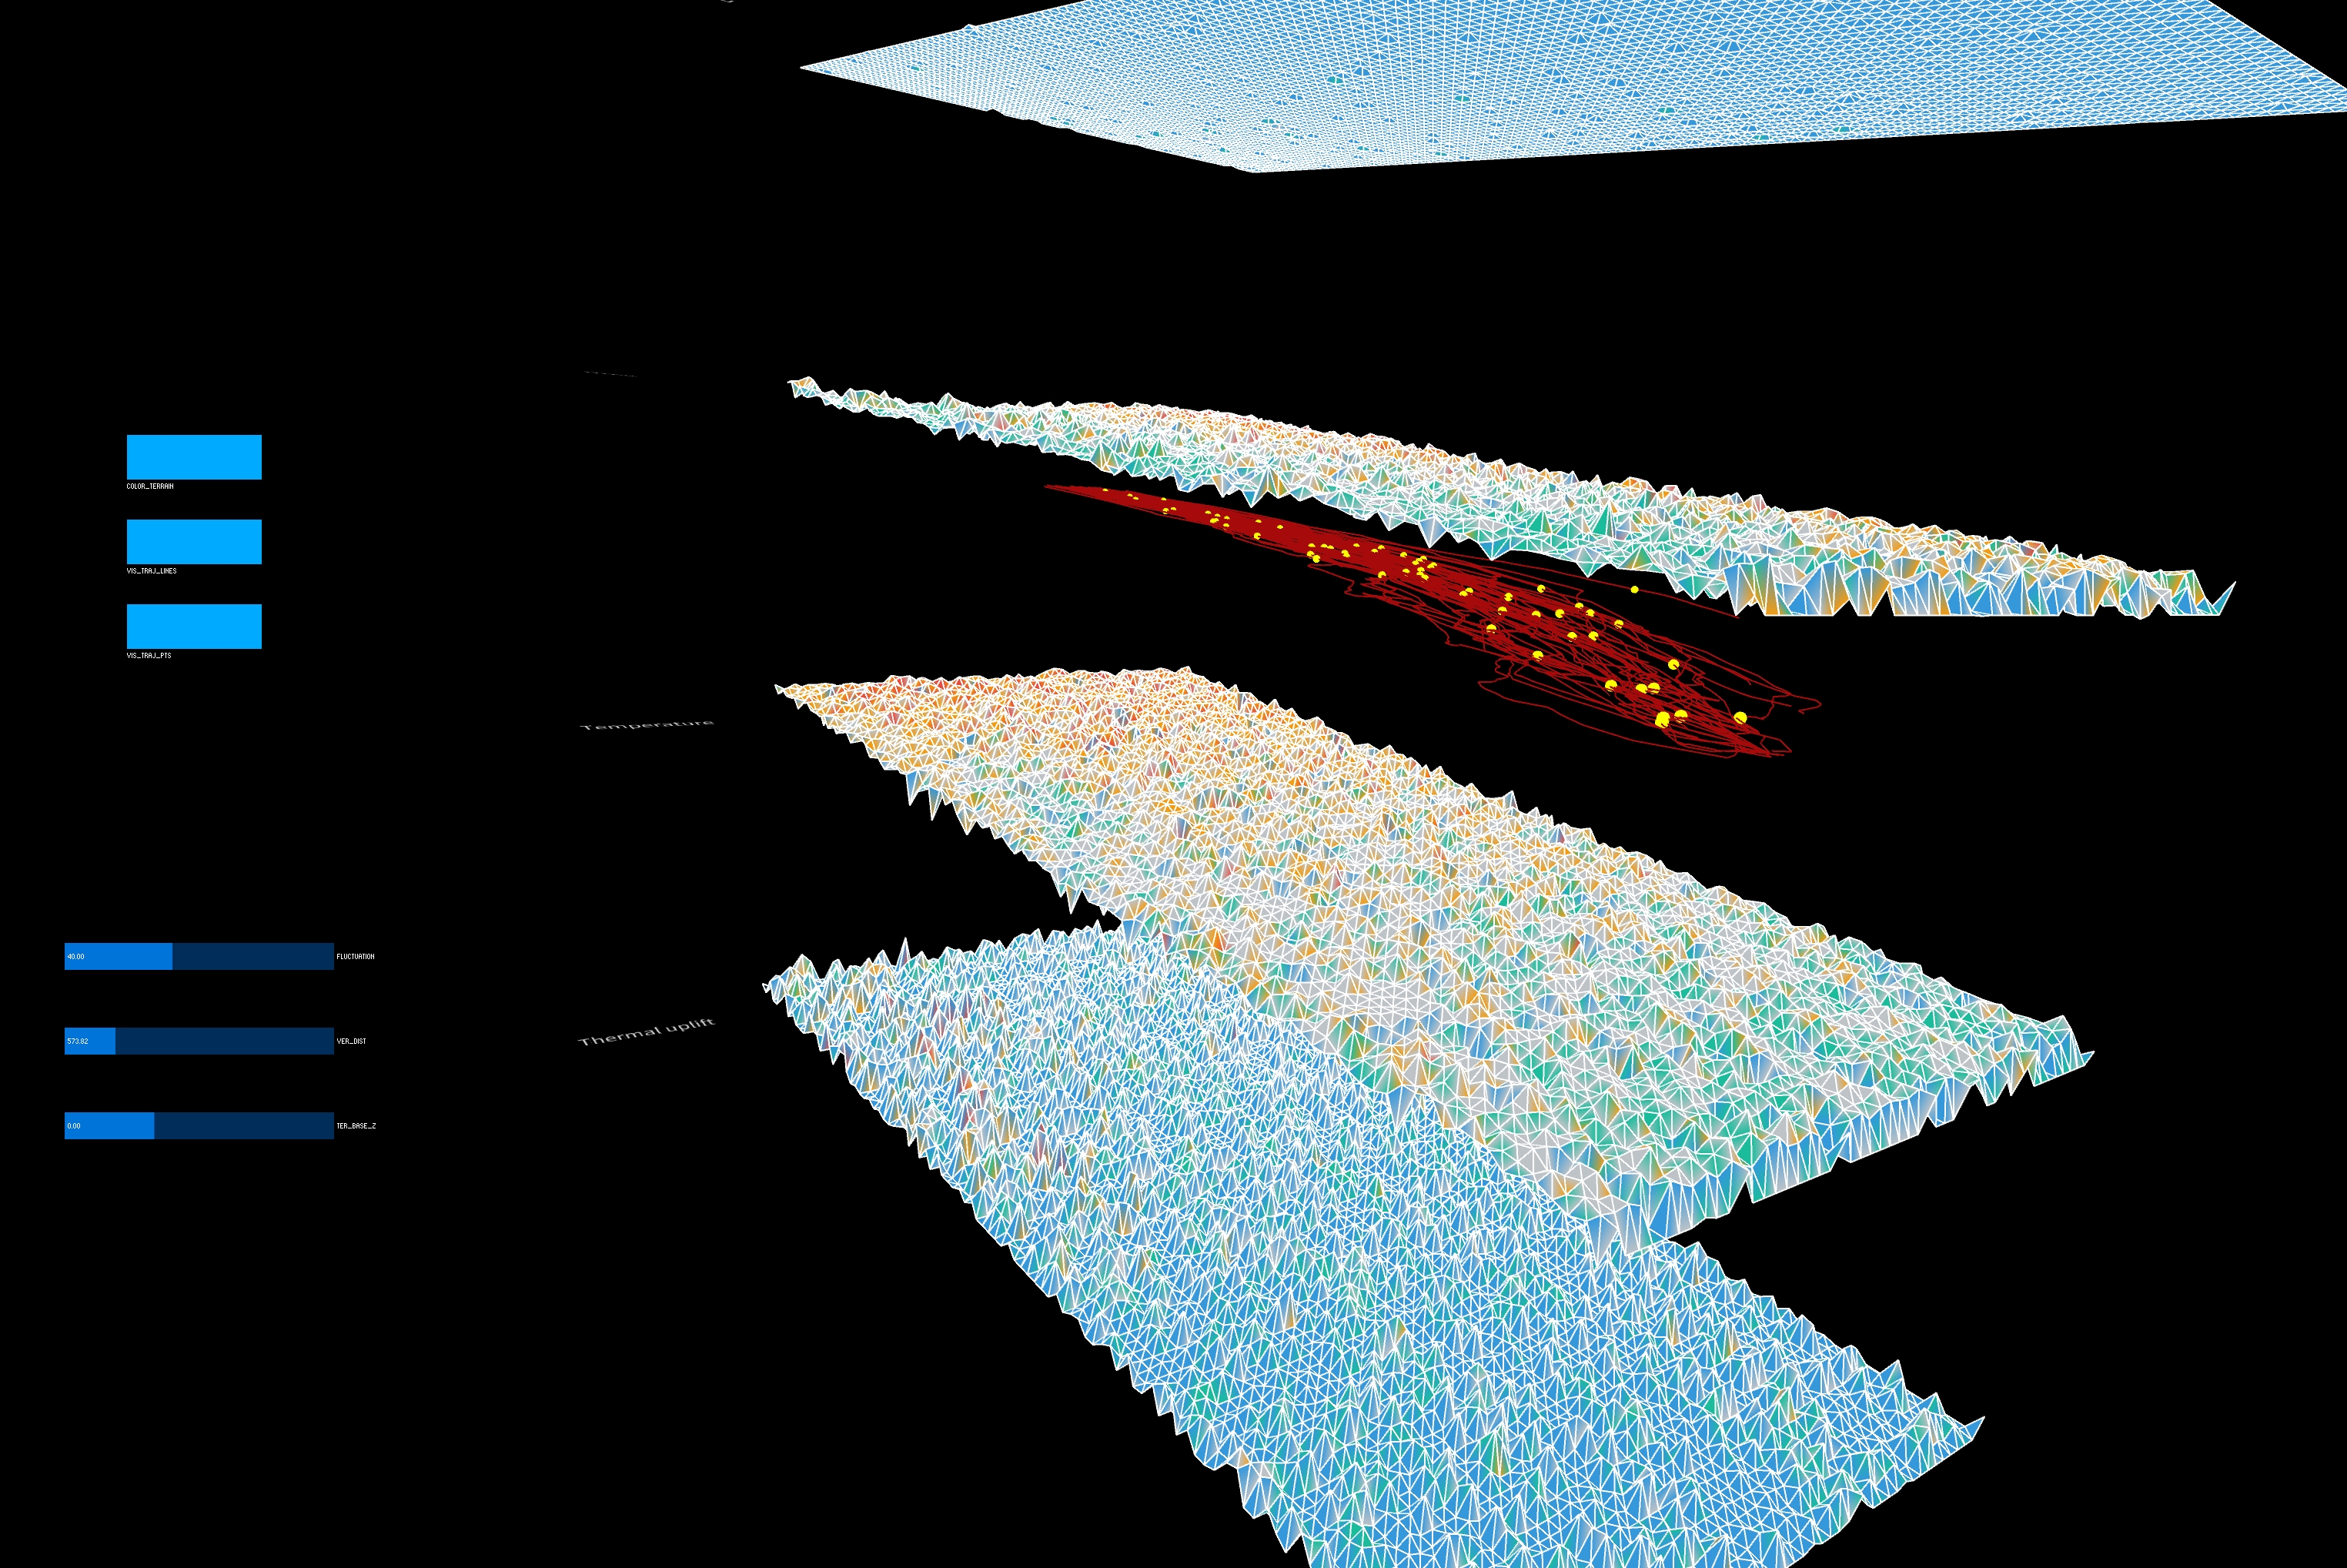
Final result
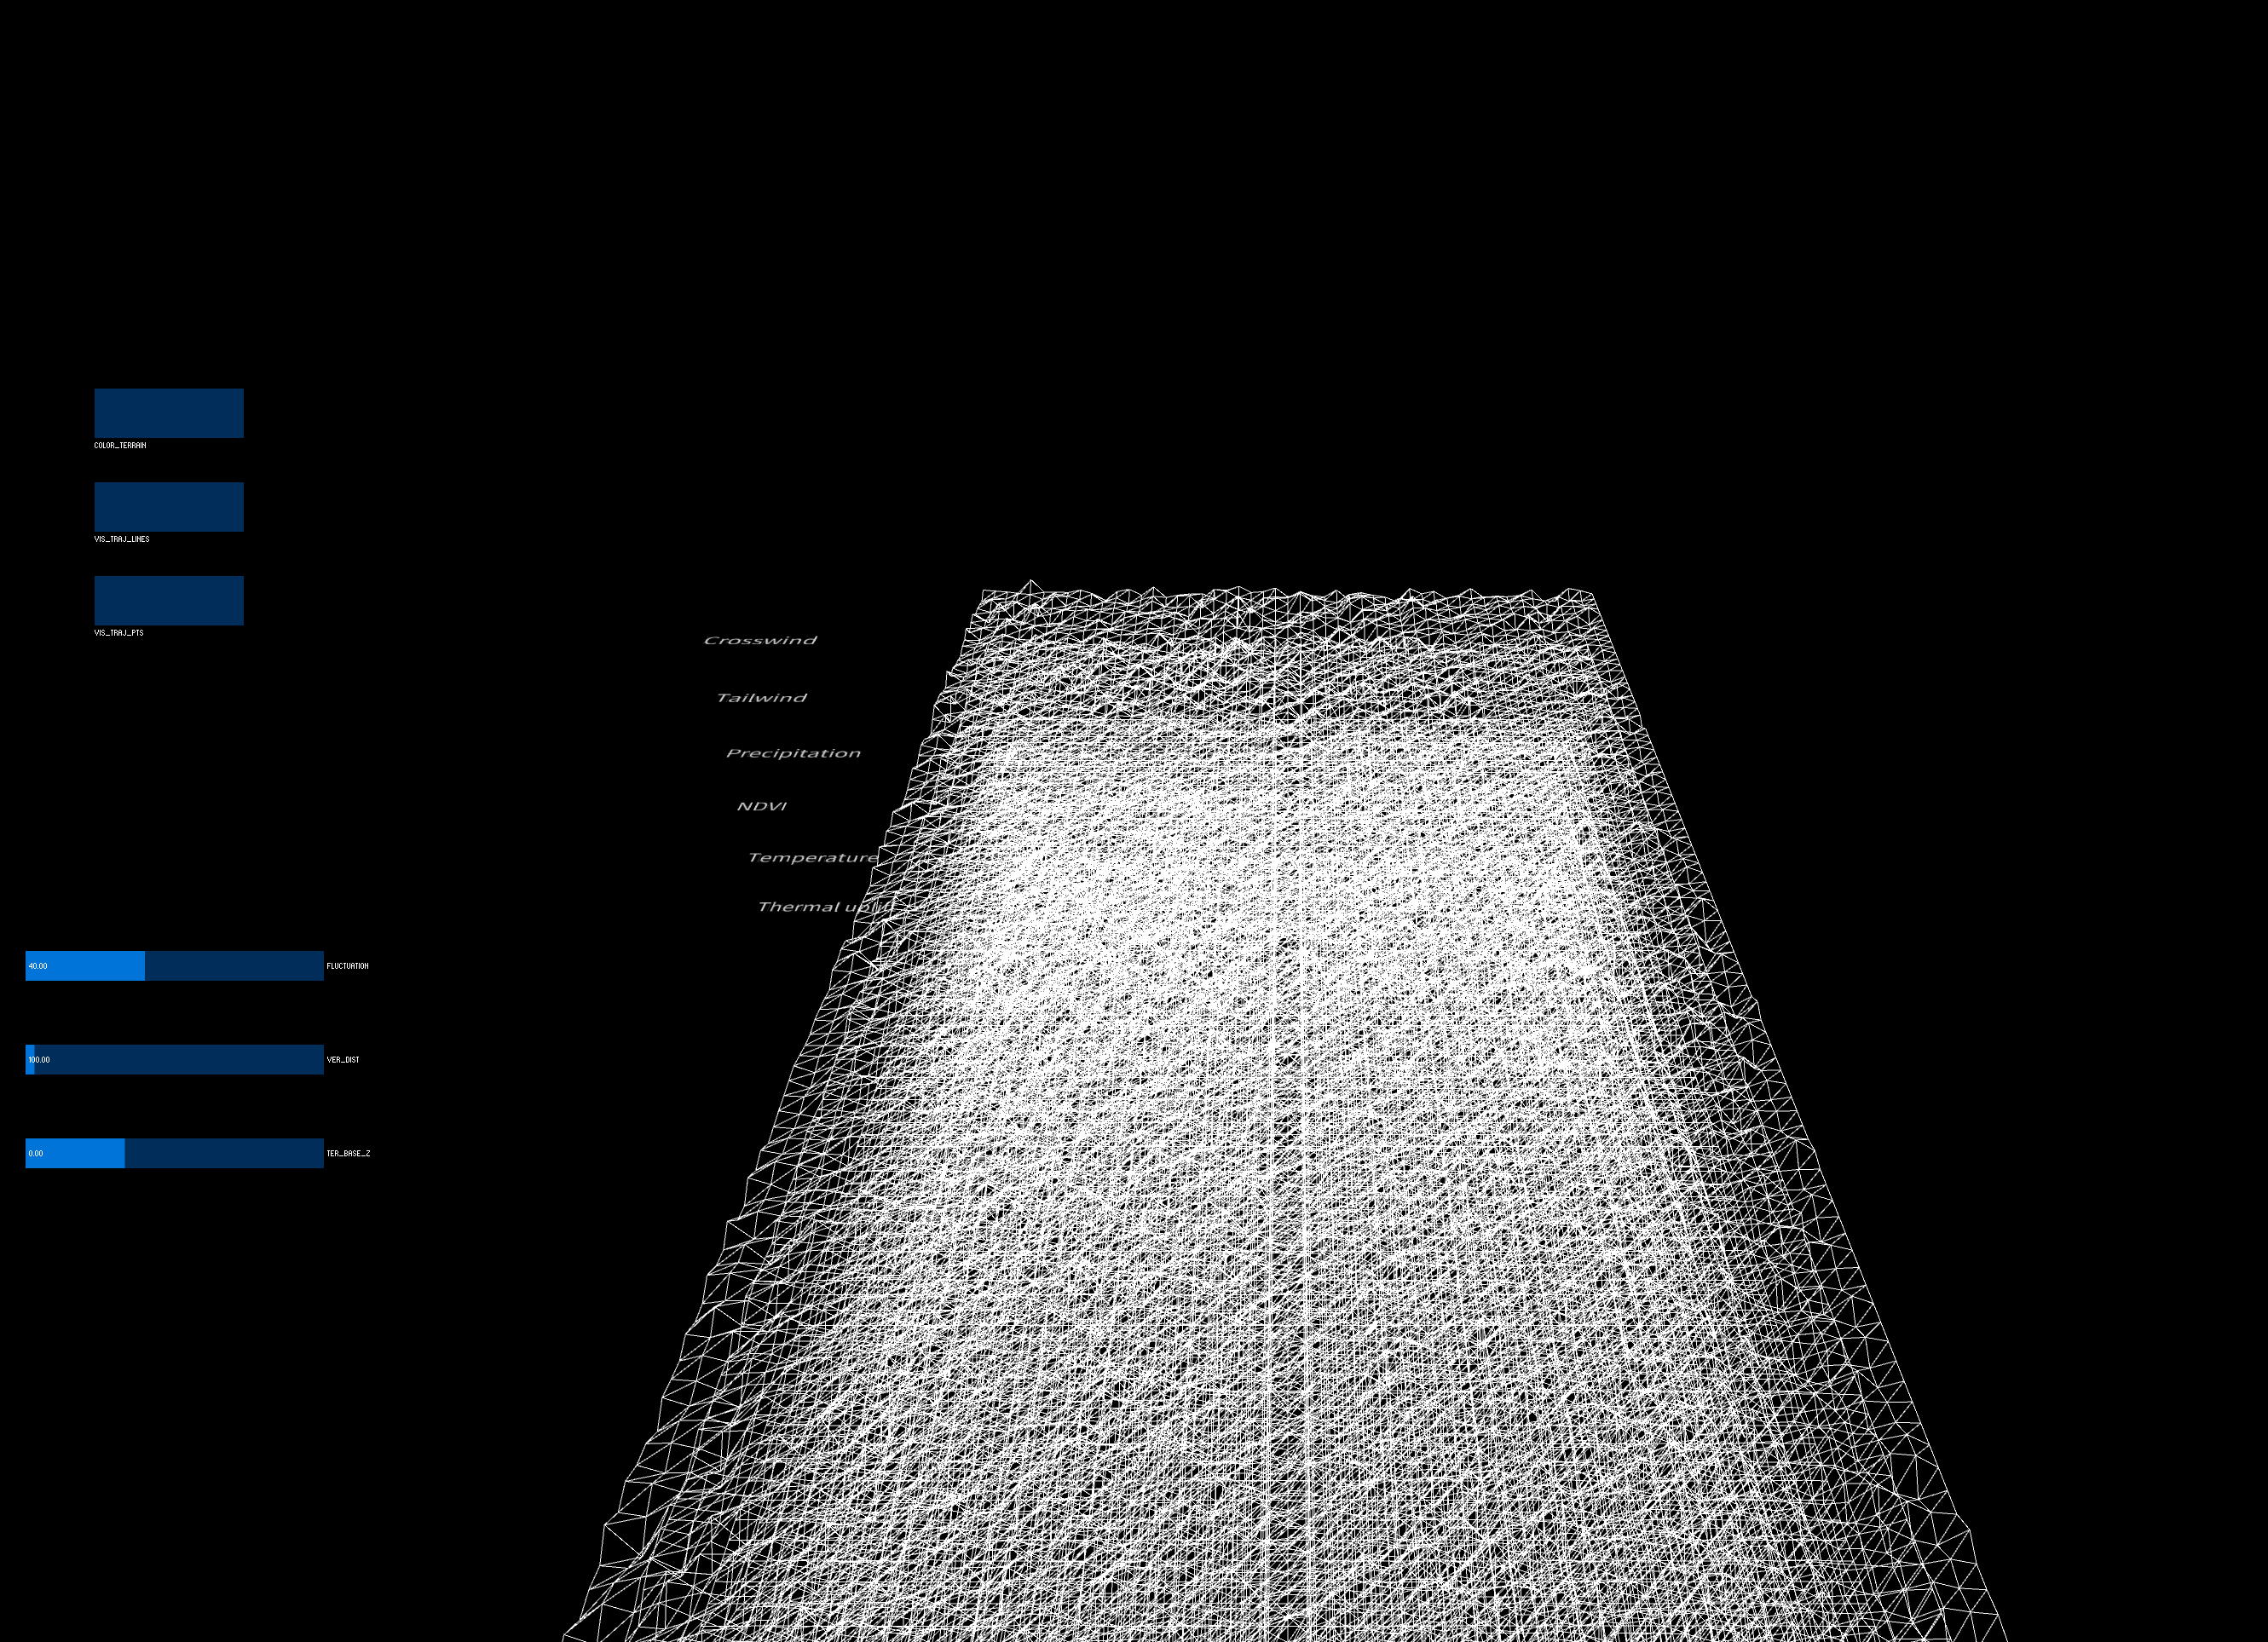
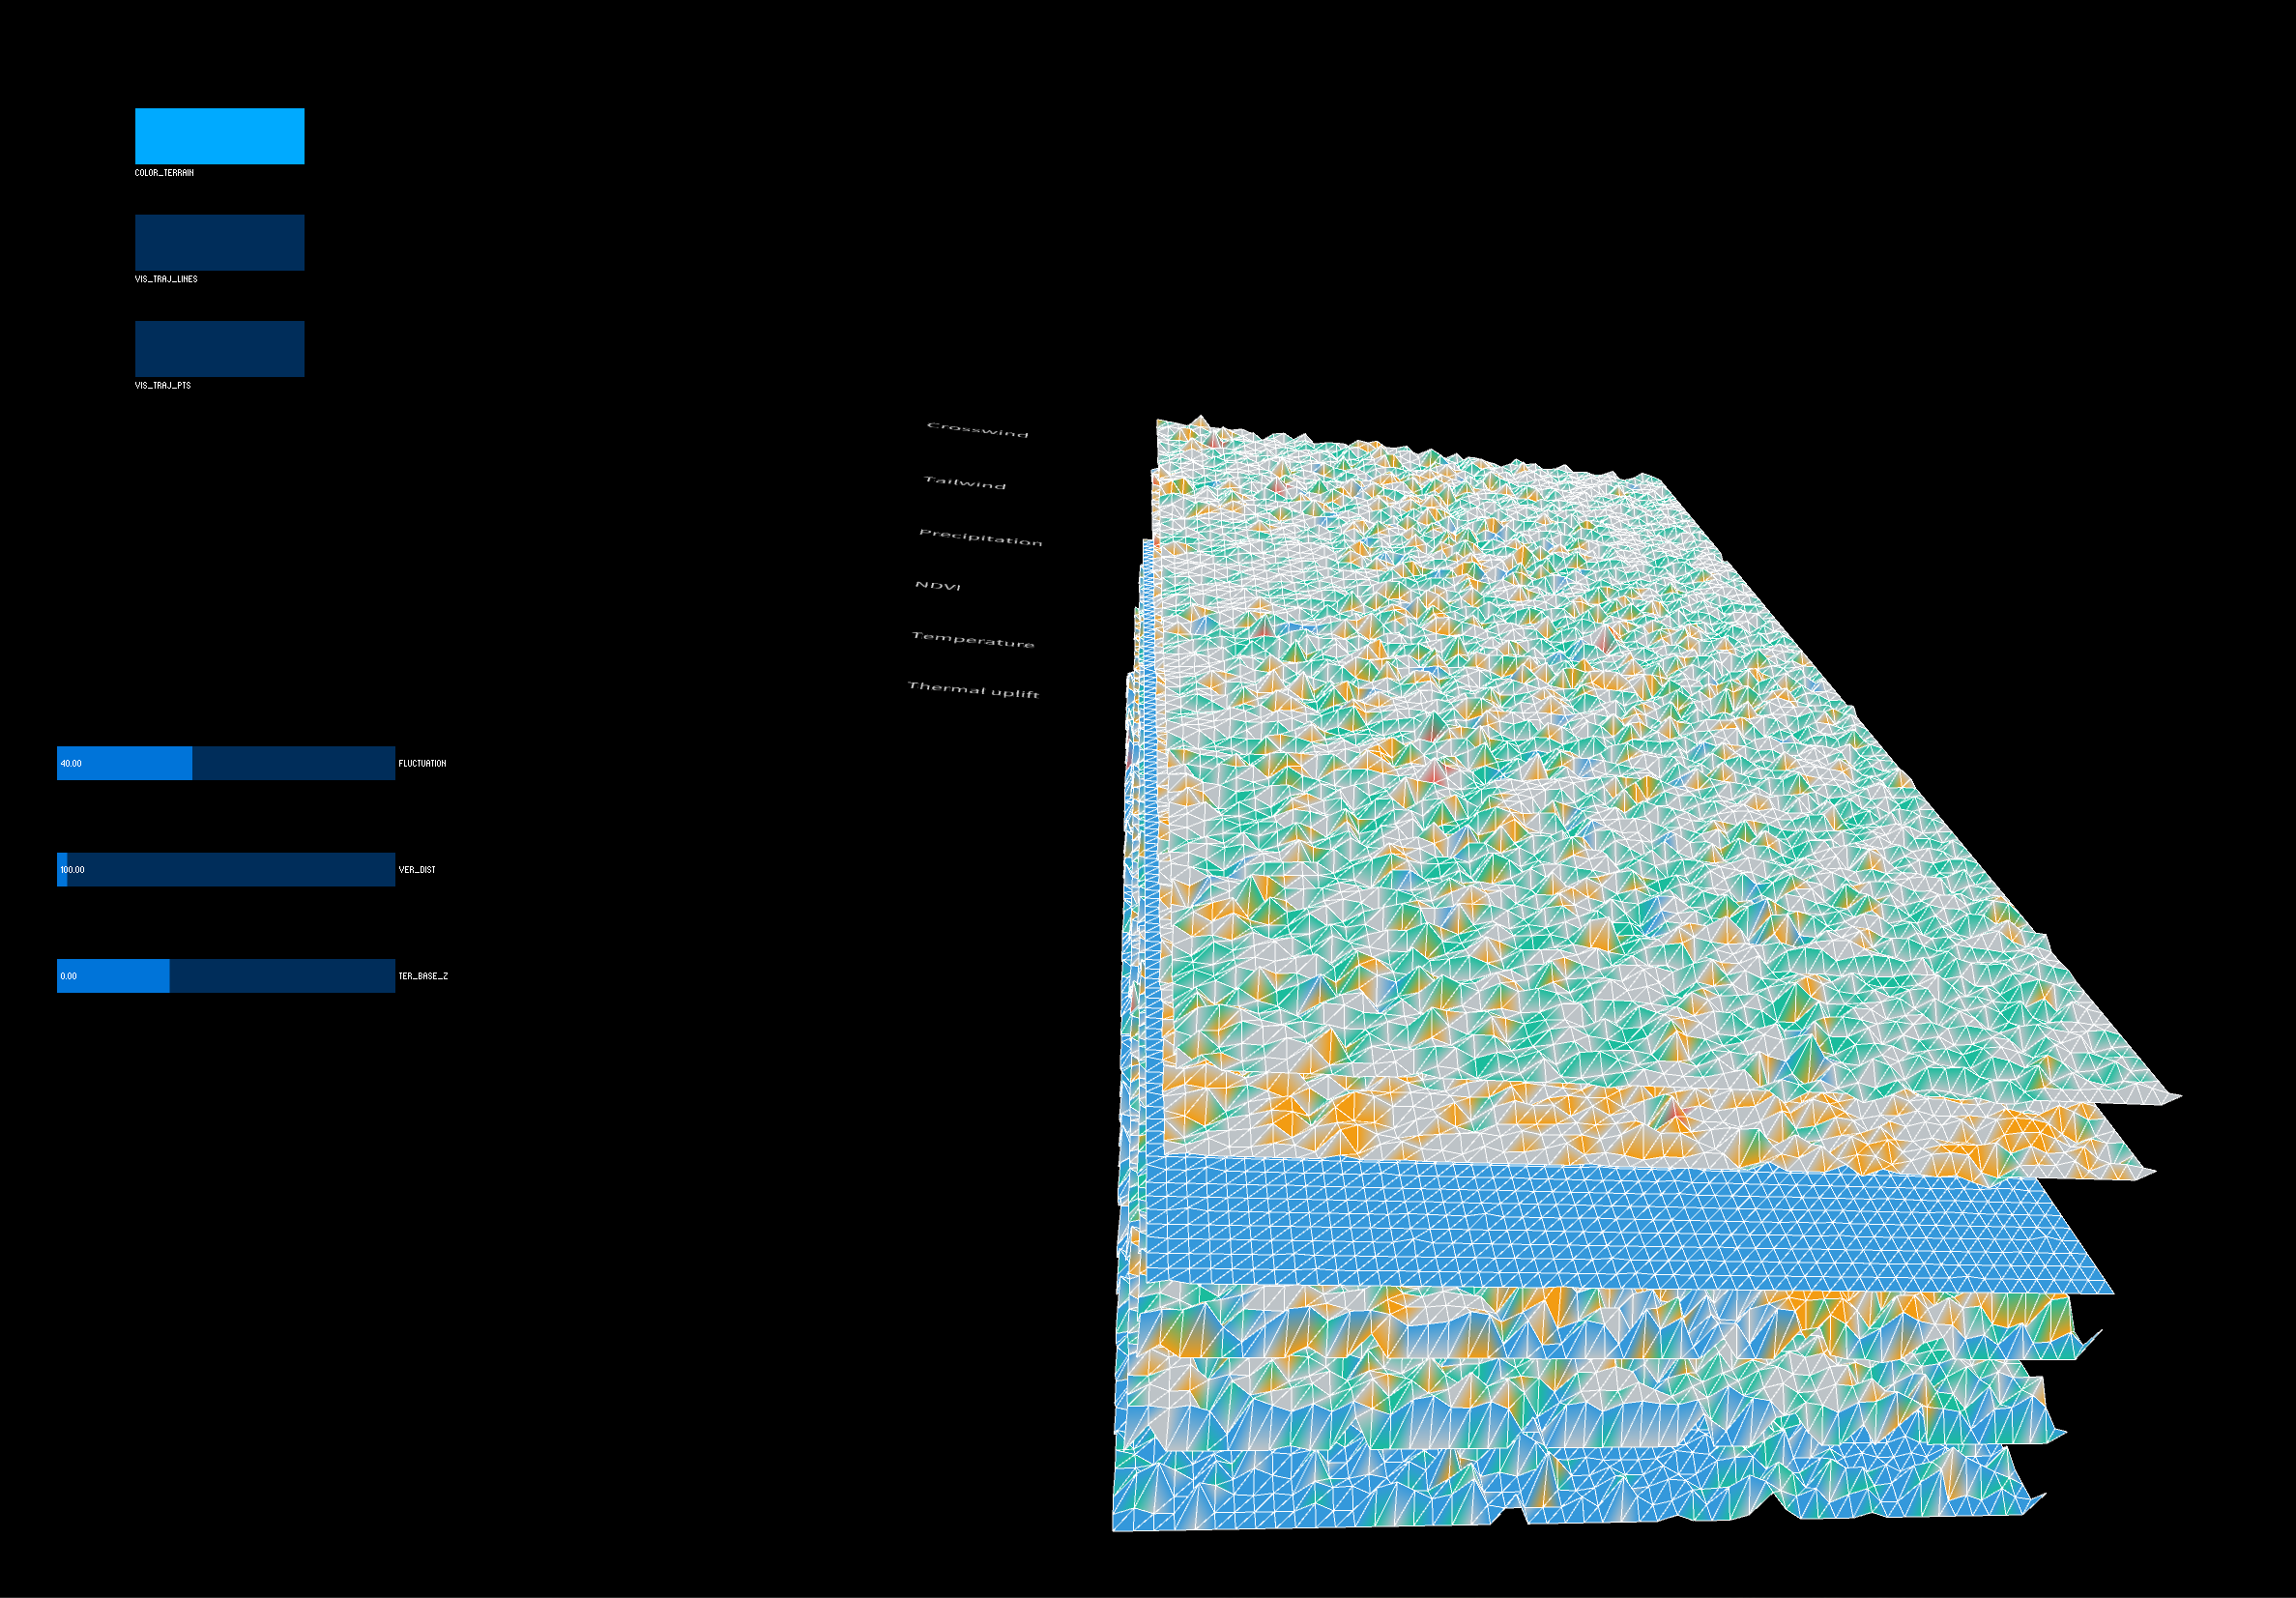
Finalluy, I decided to use multiple terrains, each representing one environmental
variable. There are three buttons and three sliders. The three buttons control the
coloring of the terrains, visualizing the trajectory lines and tracking points,
respectively. The three sliders control the fluctuation of the terrain, the vertical
distance between terrains and base z coordinates of terrains. With the three
sliders, one can analyze the tracking data with each of the environmental variables.
Code