Temperature Movement Visualization
MAT 259, 2022
Senyuan(Russell) Liu
Concept
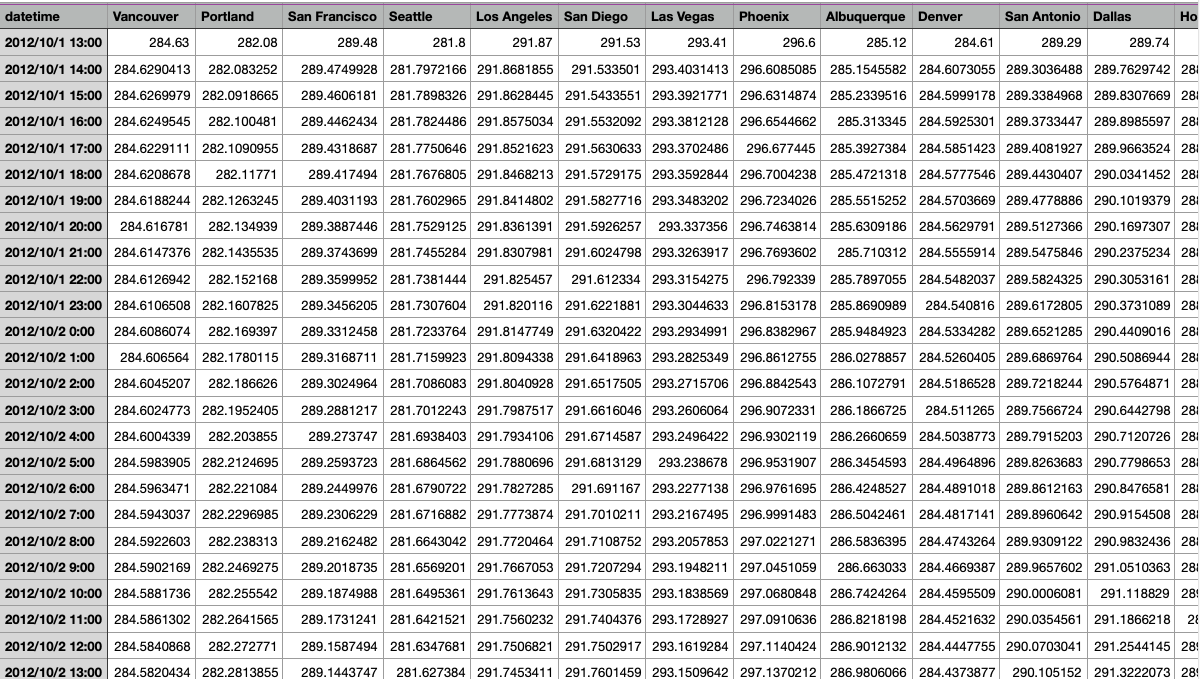
I will focus on the air temperature of 28 cities in the United States. I acquire the air temperature data (which is updated every 1 hour) and city data from 2012 to 2017, from Kaggle https://www.kaggle.com/selfishgene/hist ... /version/2
There will be three axes, respectively representing longitude, latitude, and air temperature. Each dots represent a city and it moves up and down along with the numerical value of the temperature.
Query
Data source: https://www.kaggle.com/selfishgene/historical-hourly-weather-data/version/2
Preliminary sketch
Air temperature is updated hourly from 2012 to 2017.
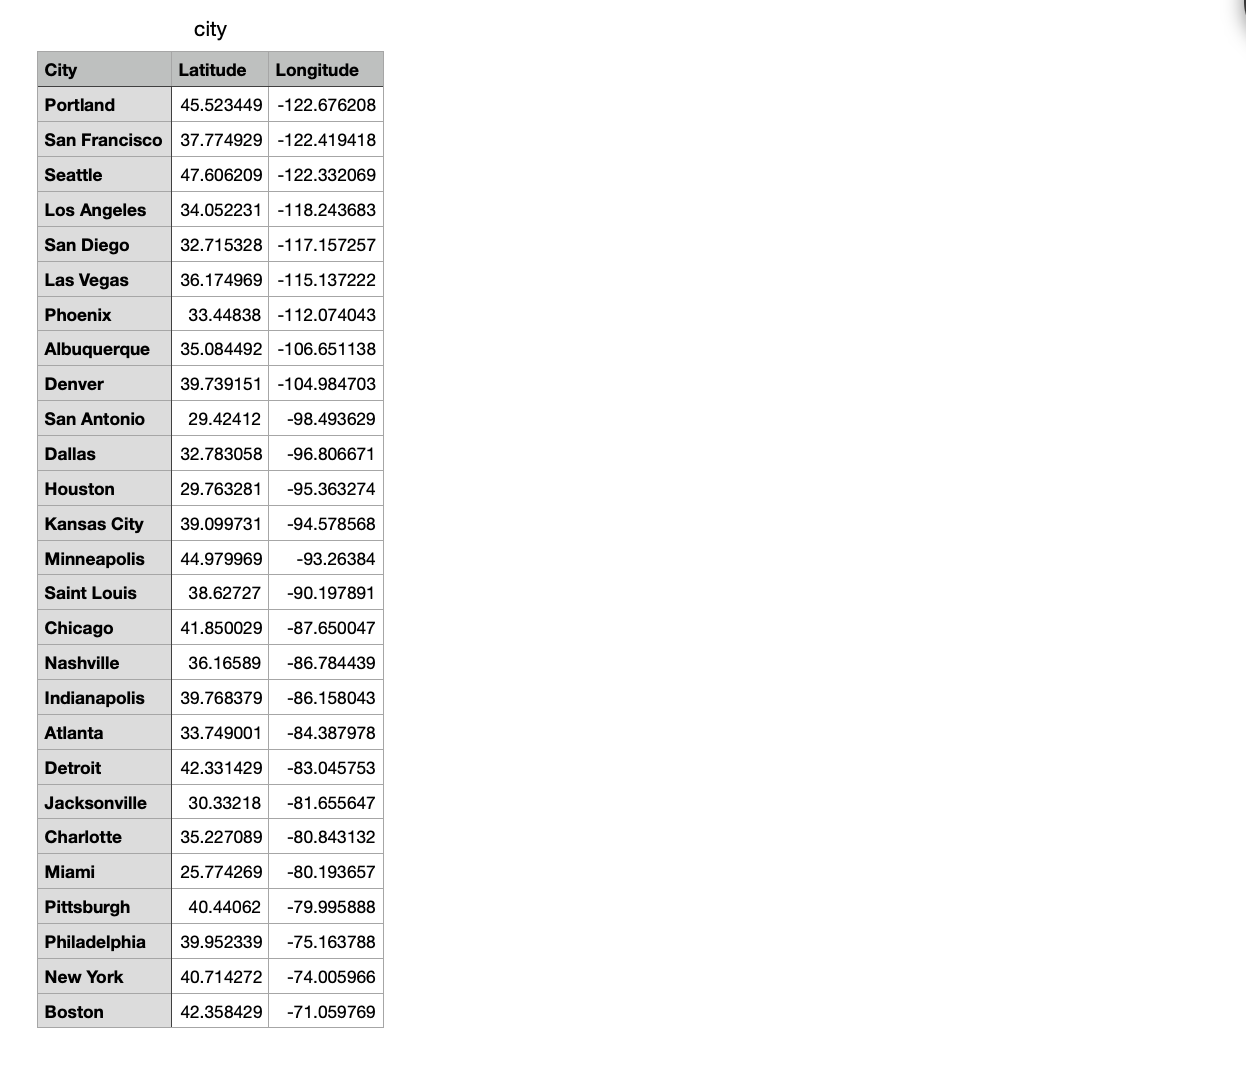
Each cities' latitude and longitude.
Priliminary sketch:
Each cities' latitude and longitude.
Each cities' latitude and longitude.
Priliminary sketch:
Each cities' latitude and longitude.
Process
For the work-in-progress visualization, I only show the movement without presenting the change of the temperature by using color.
Final result
Video Documentation
Here I upload my final movement visualization in Youtube.
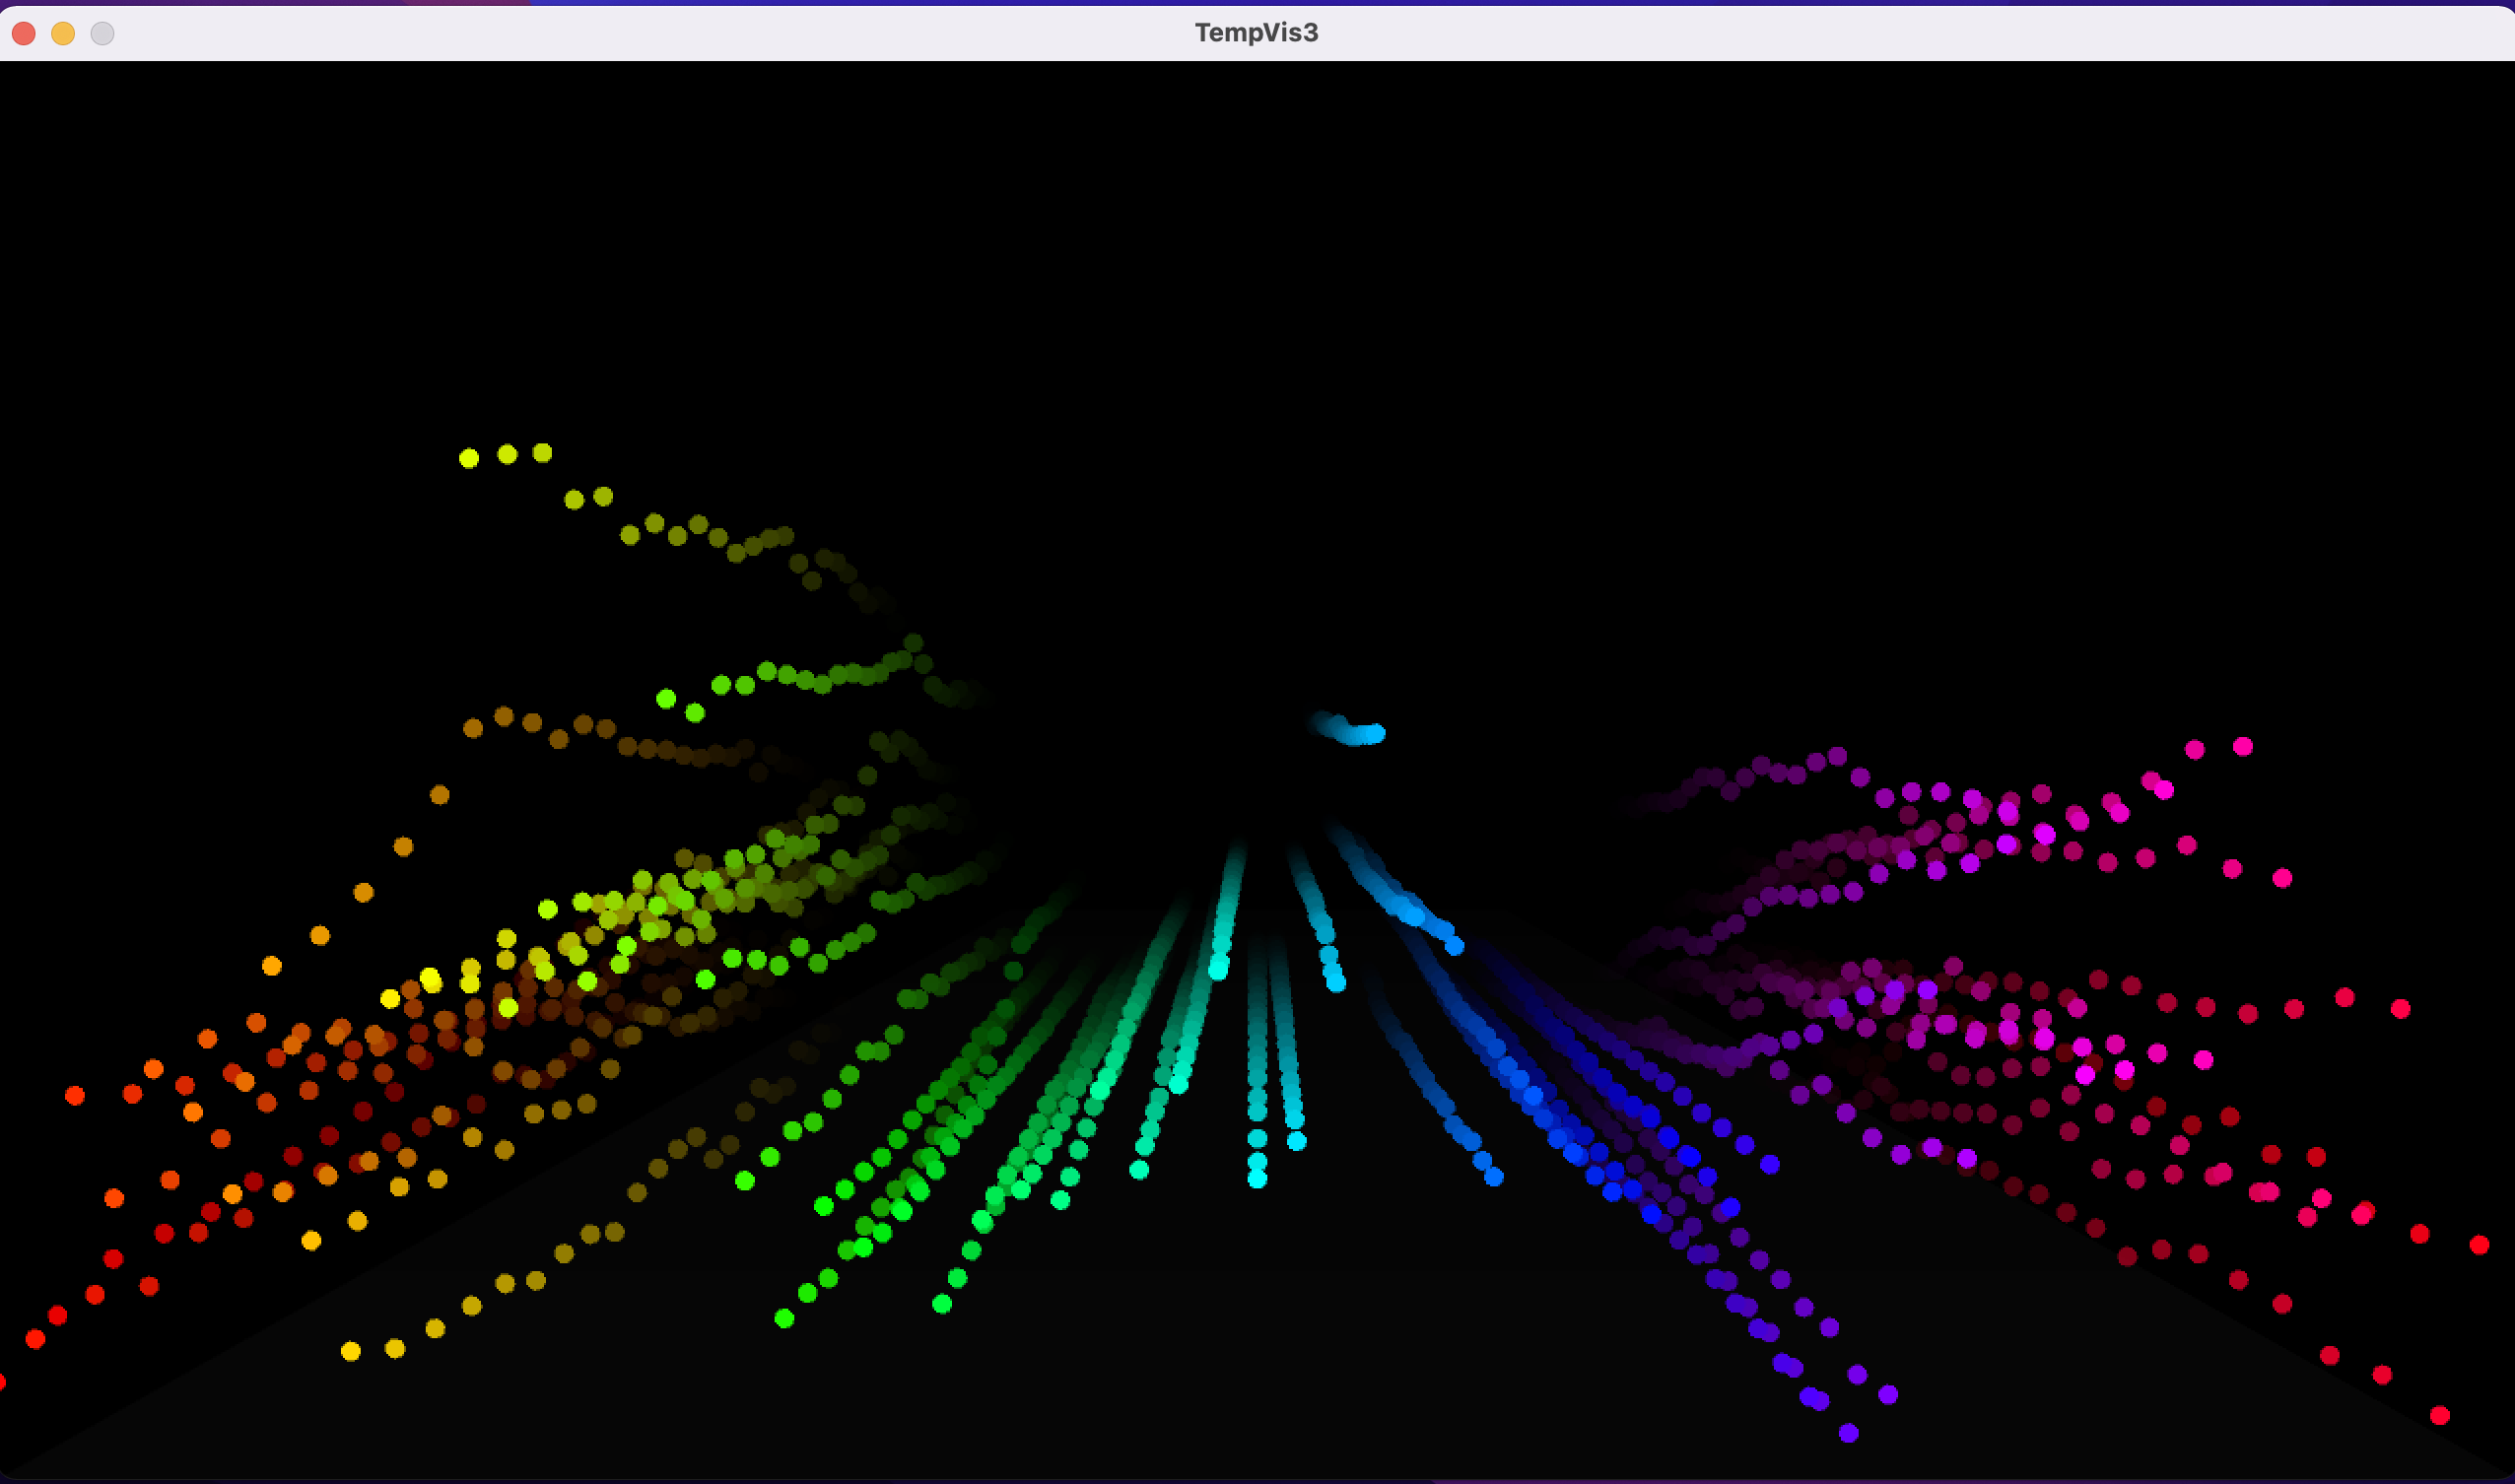
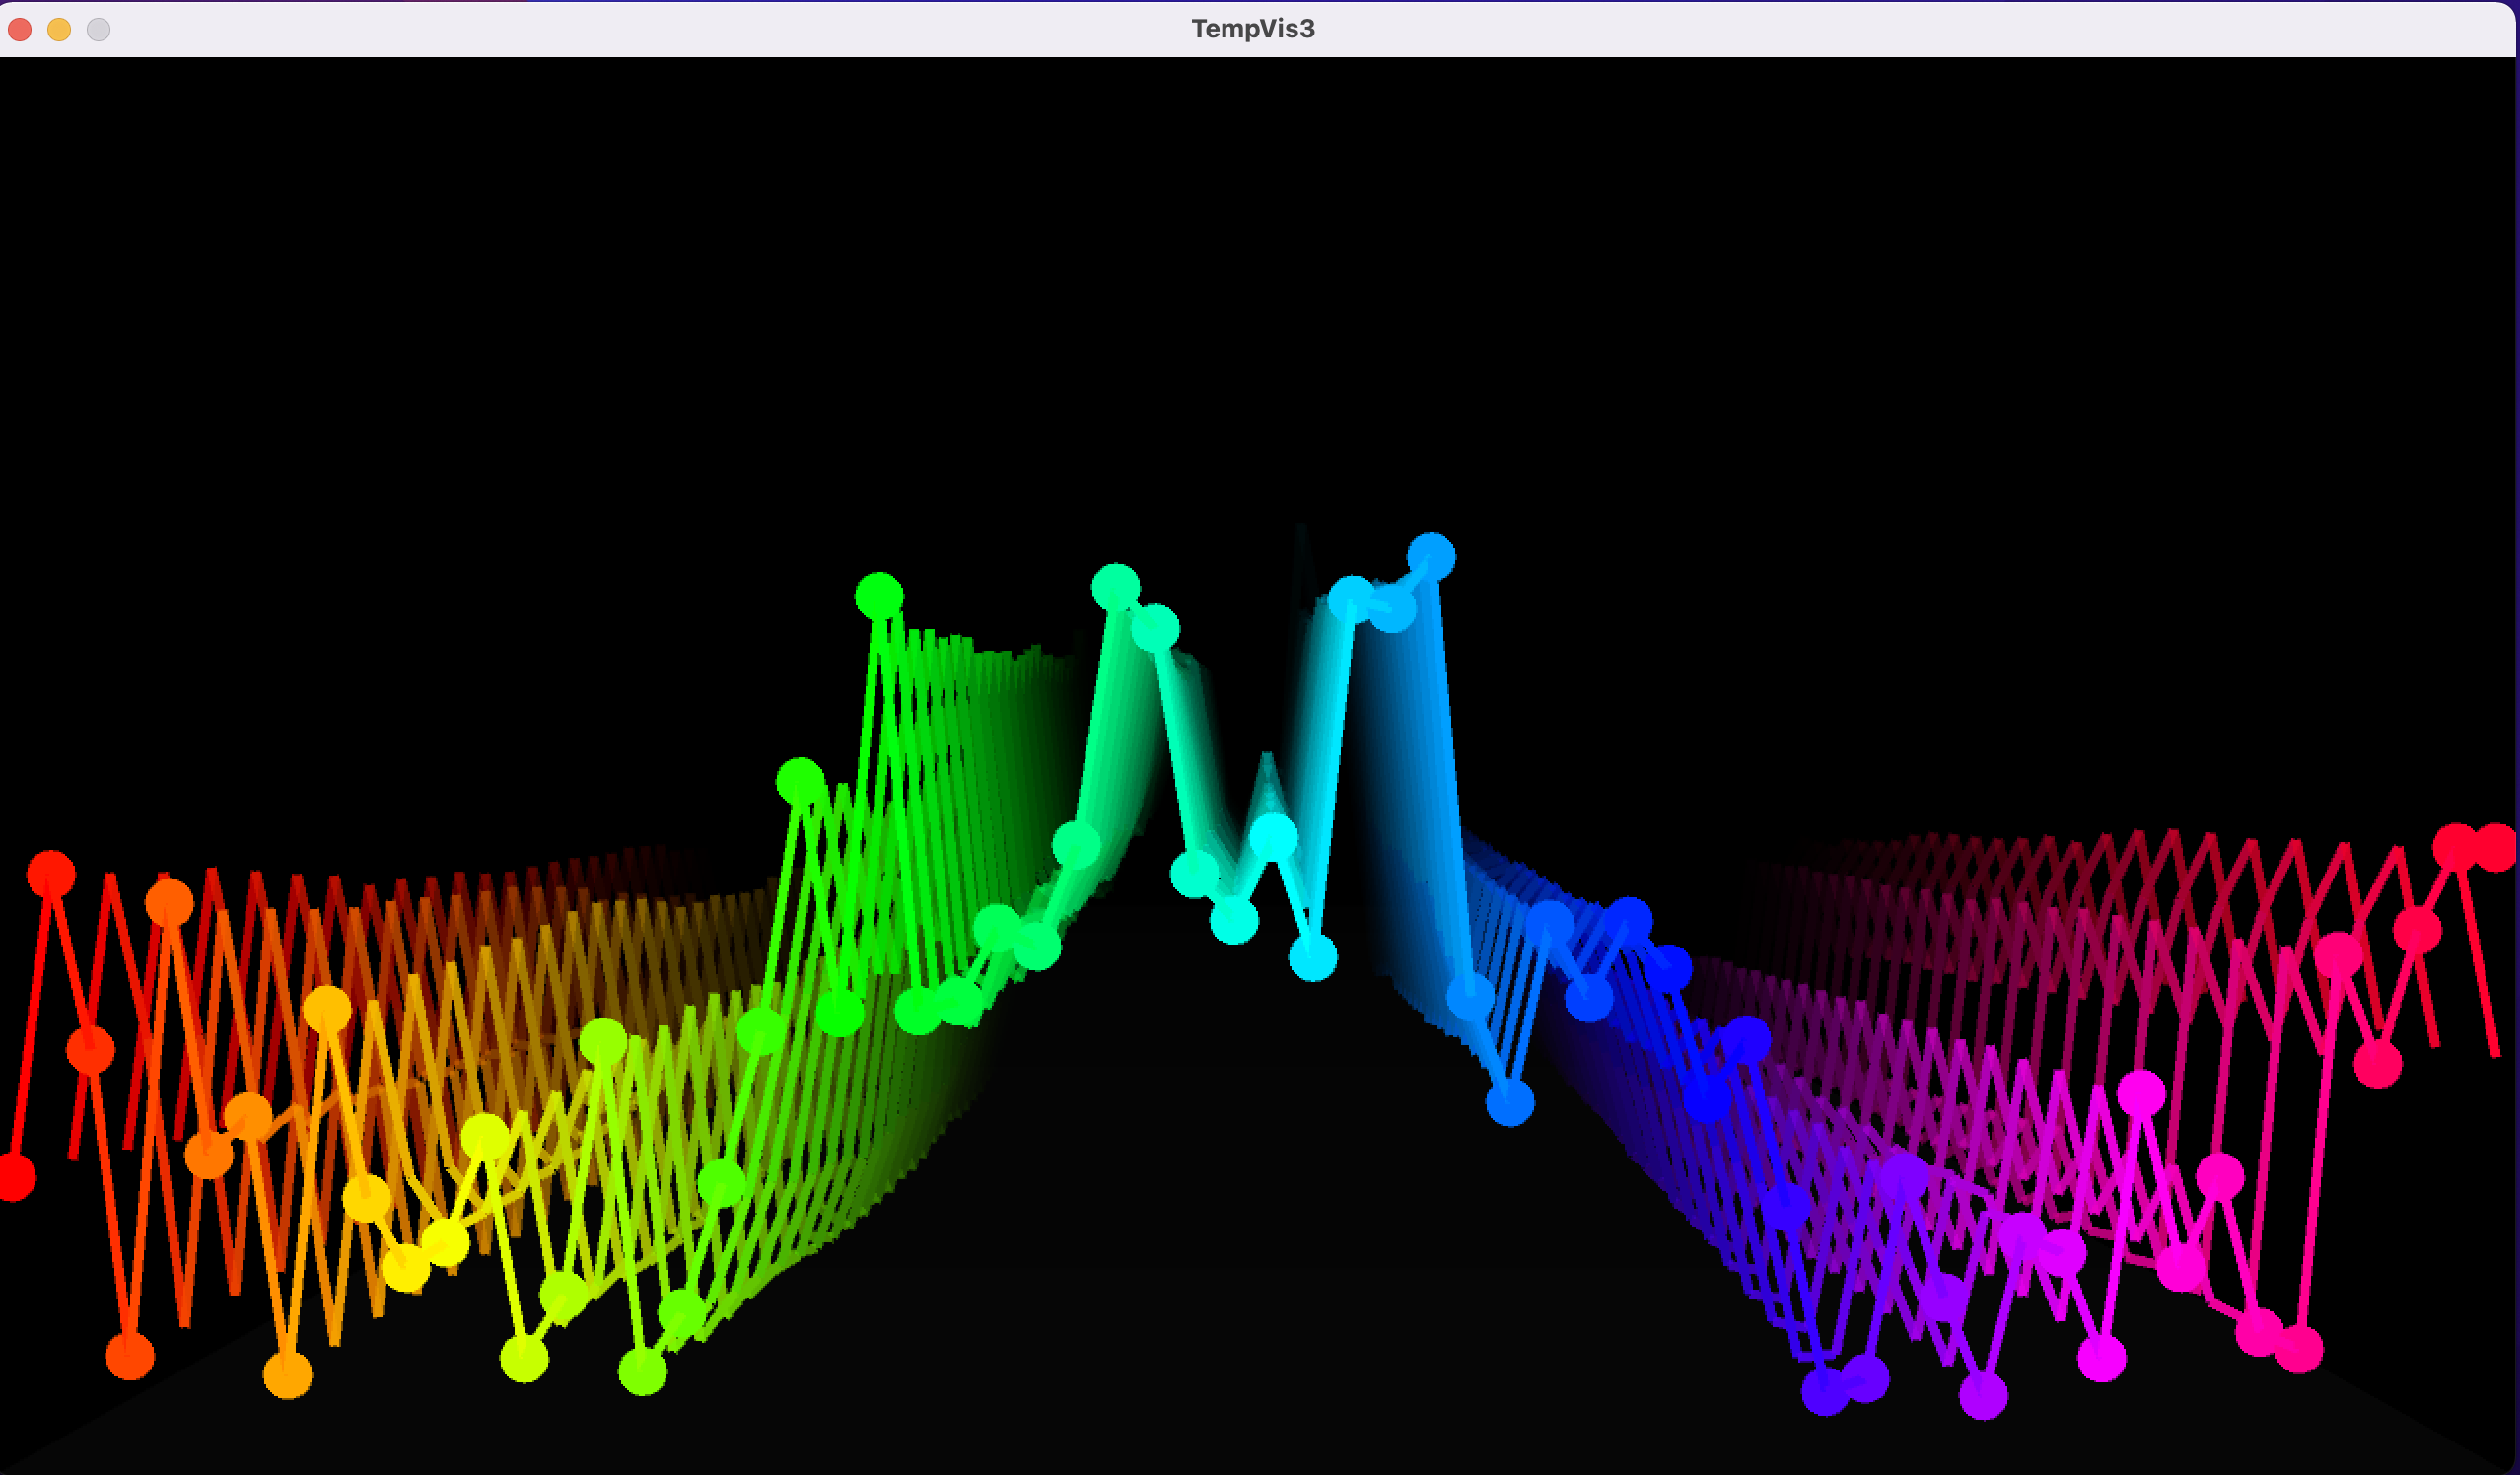
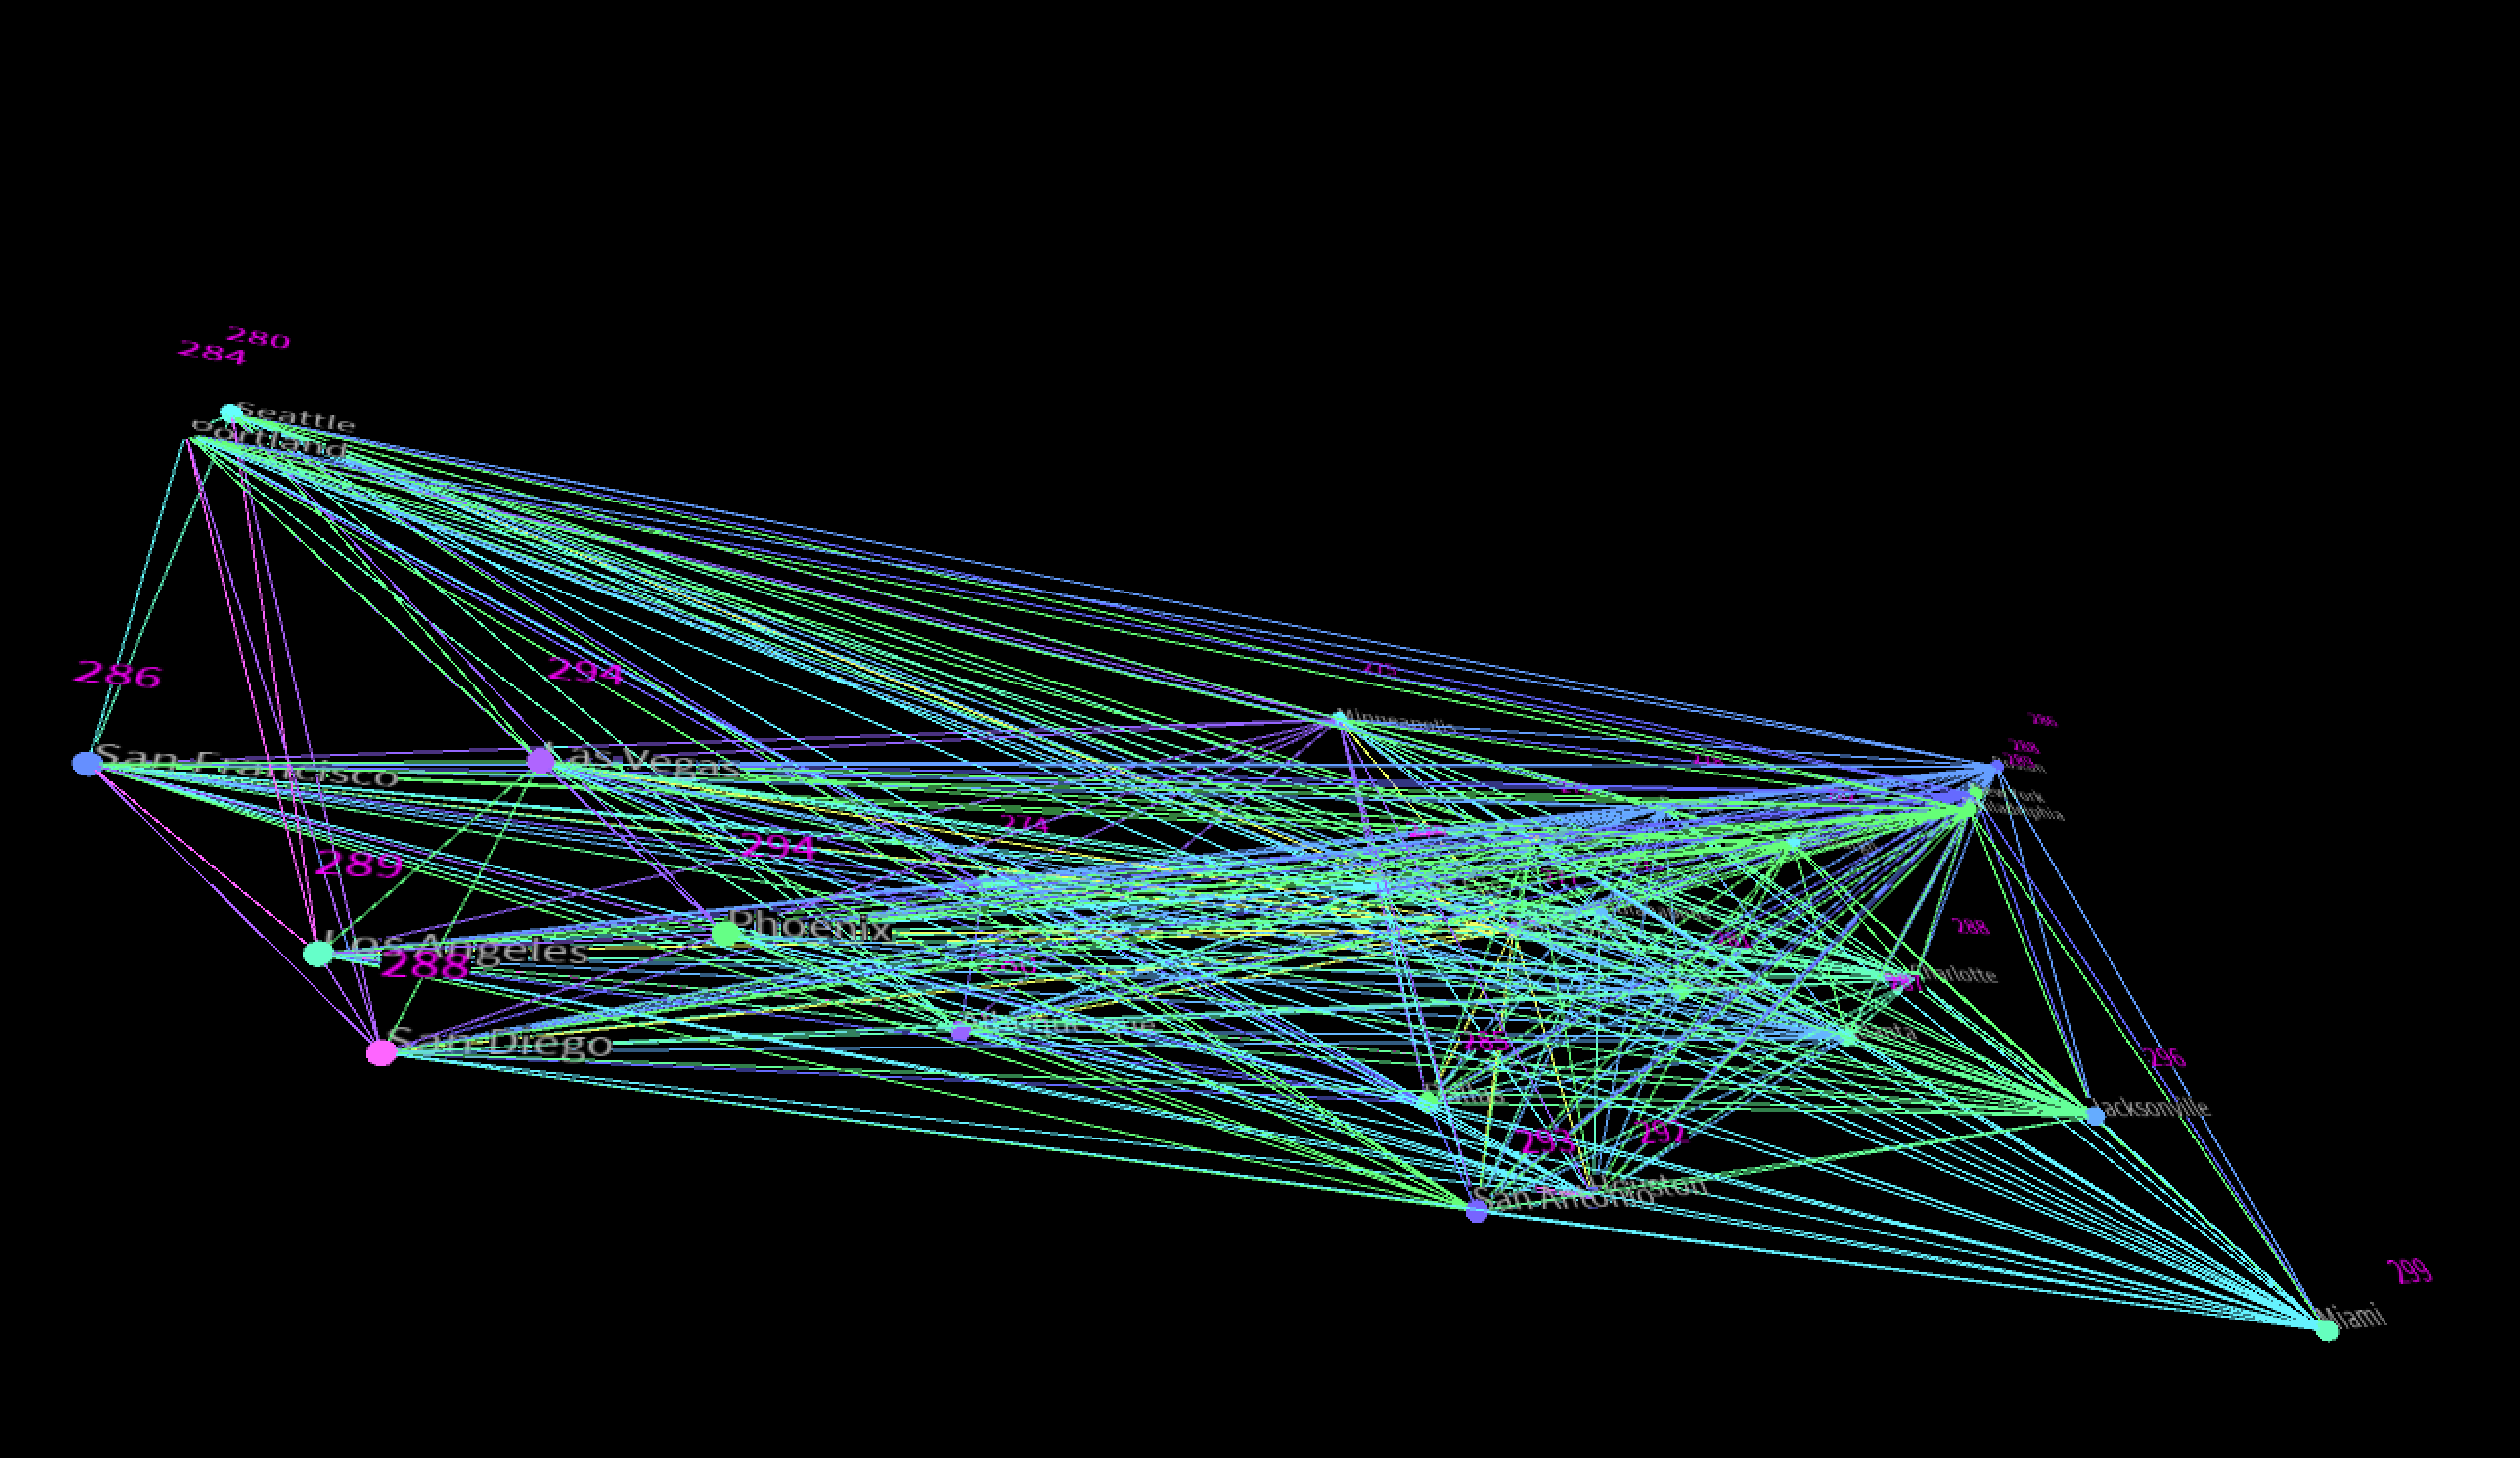
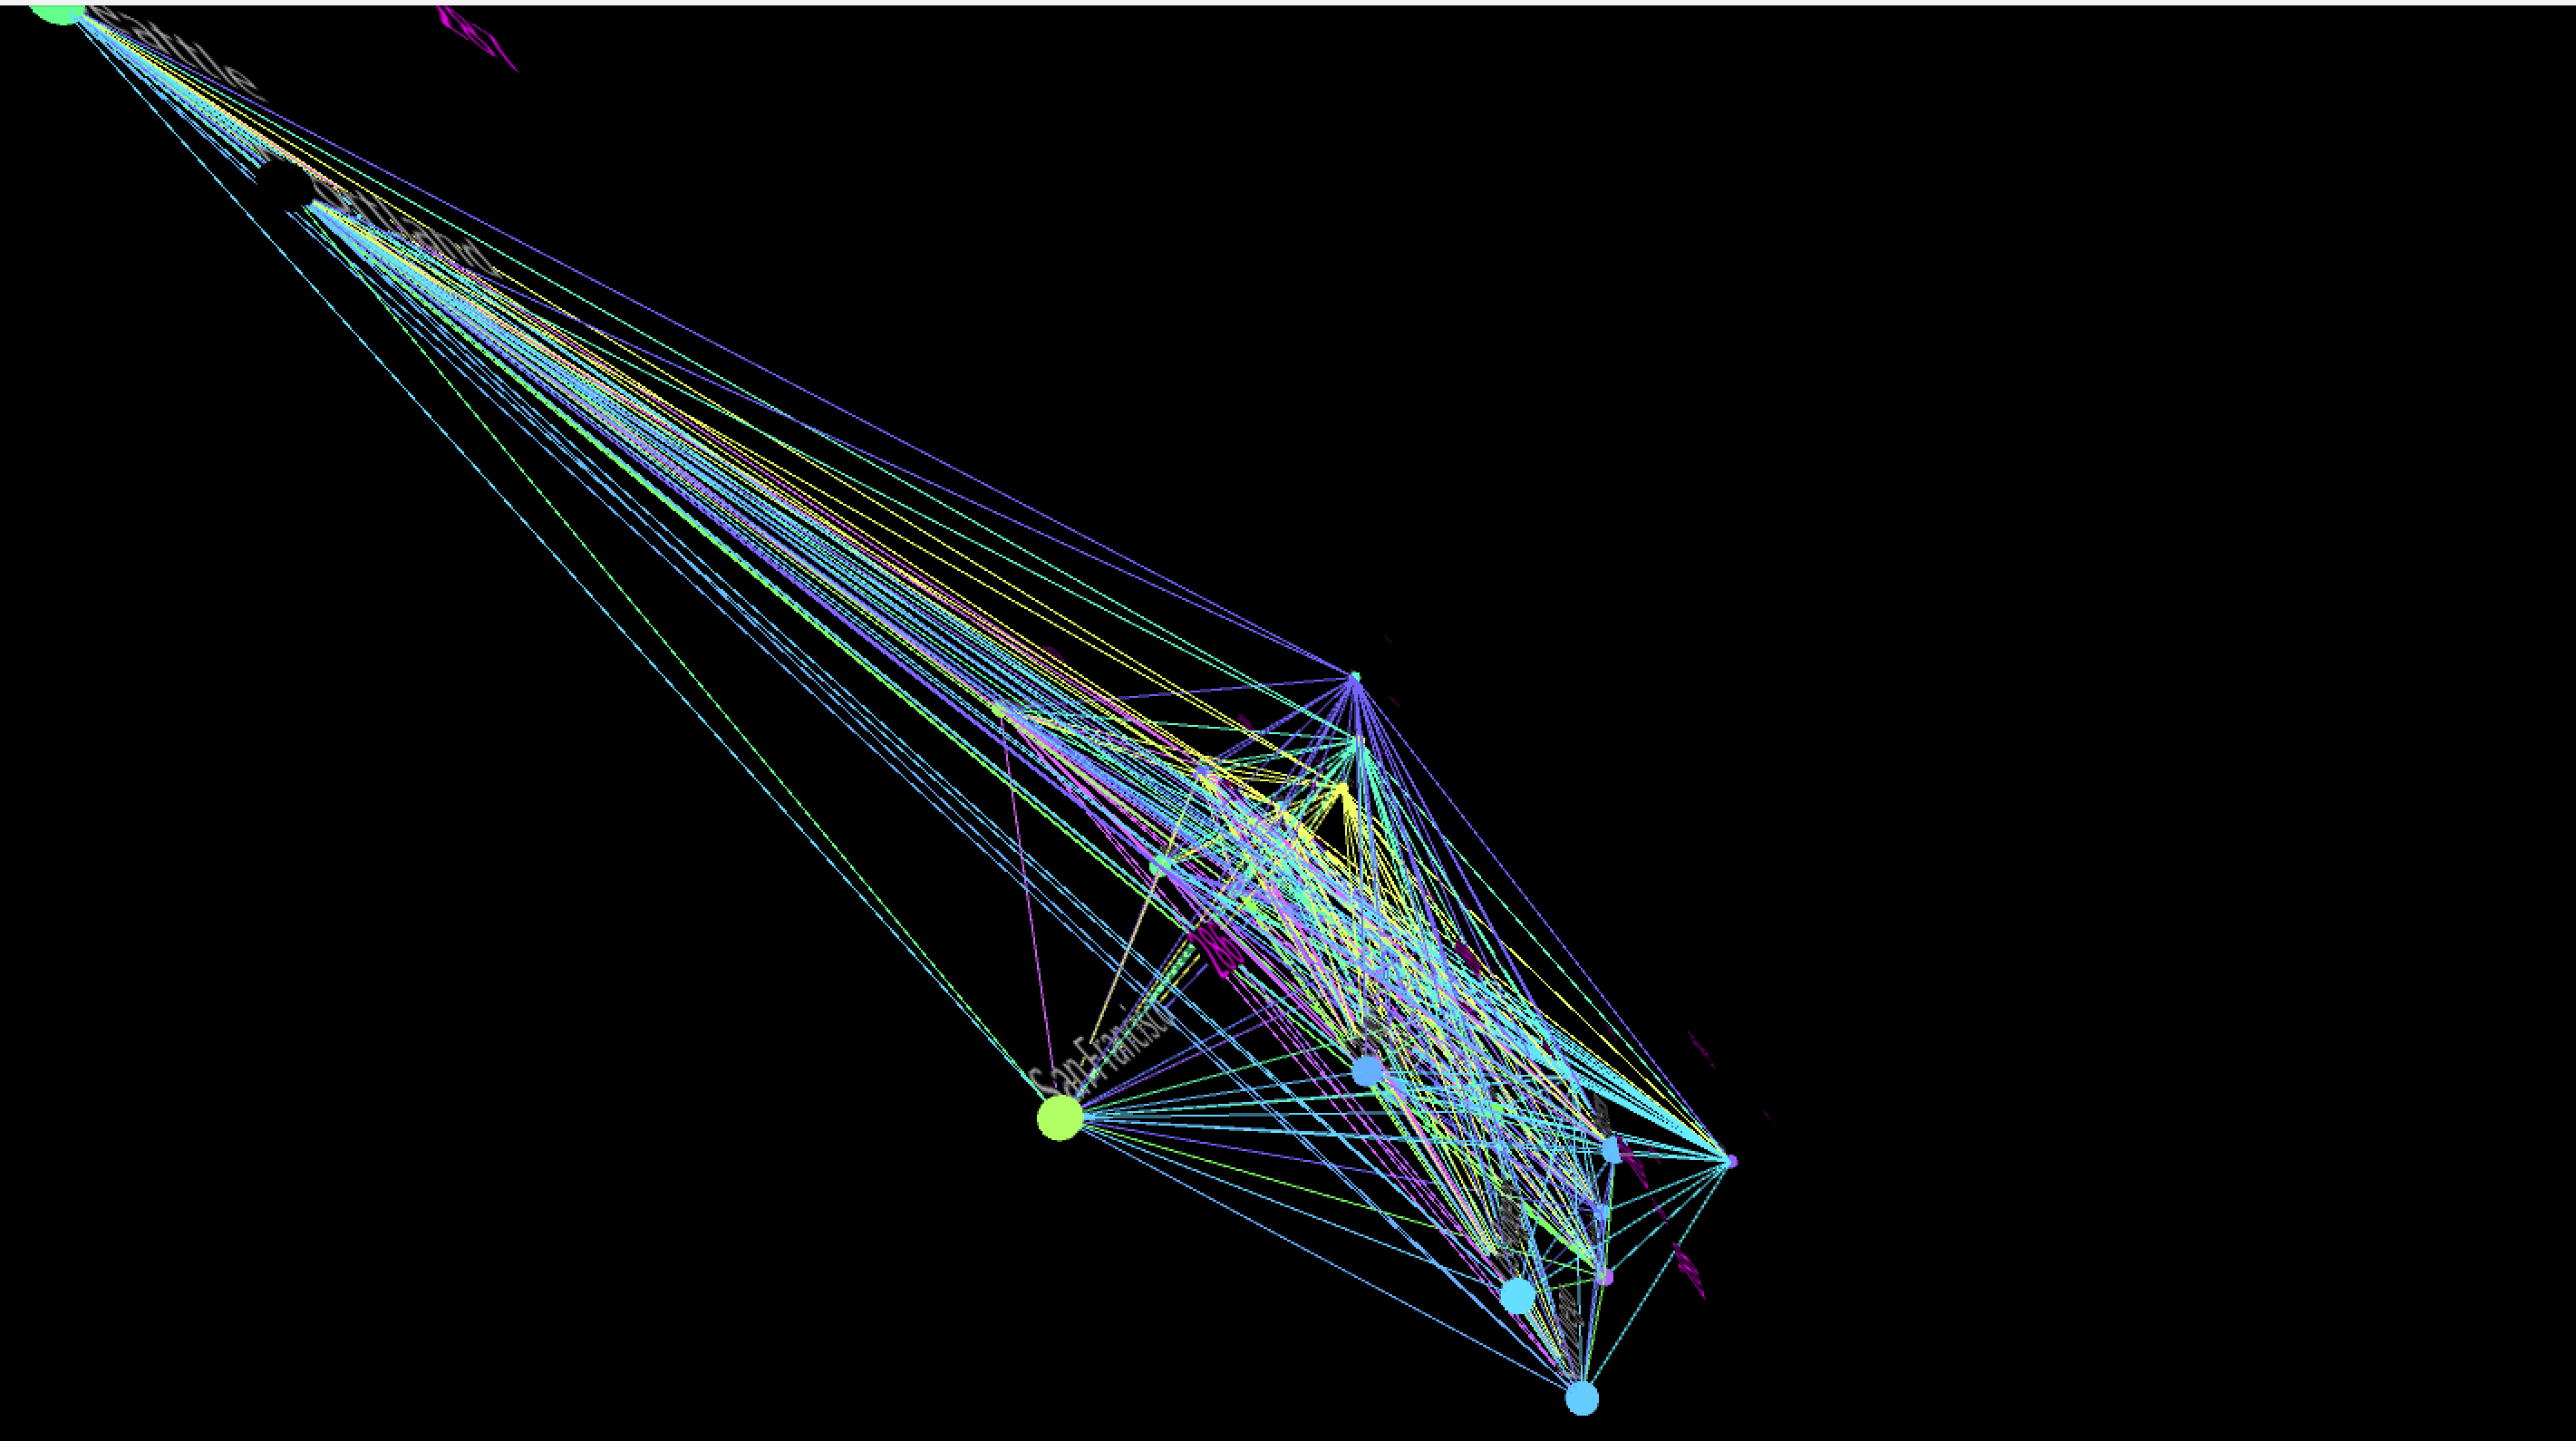
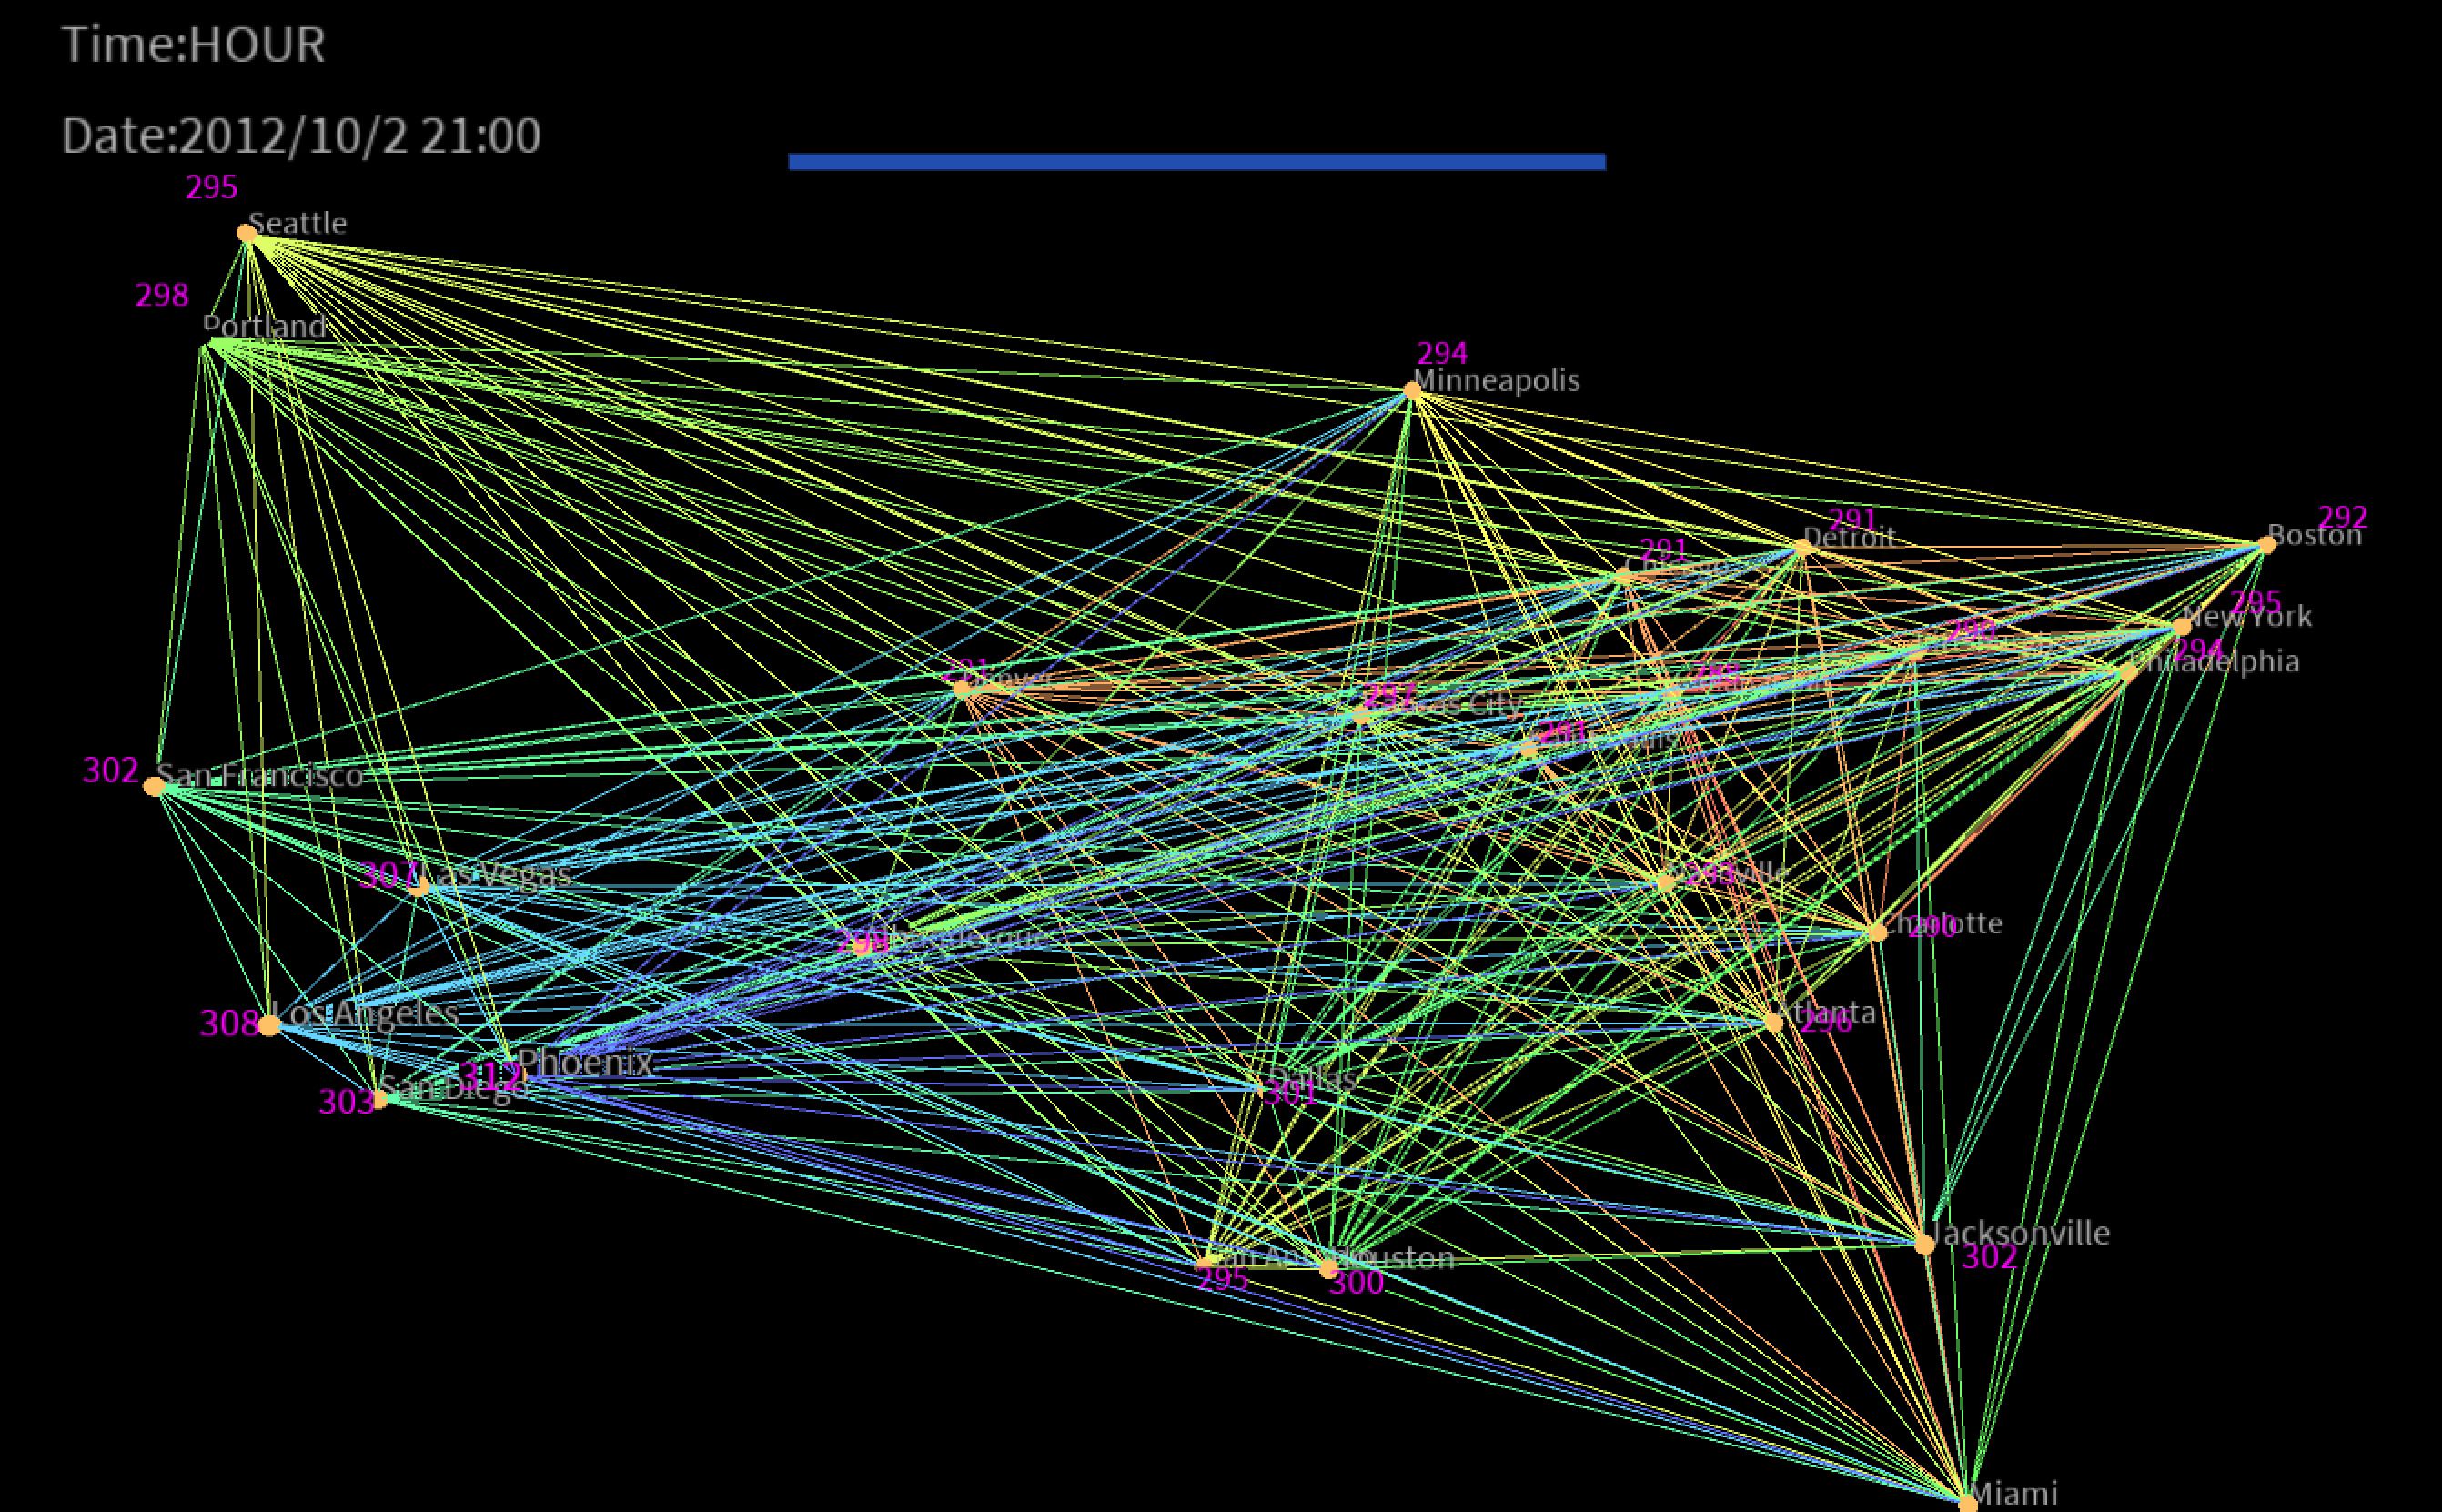
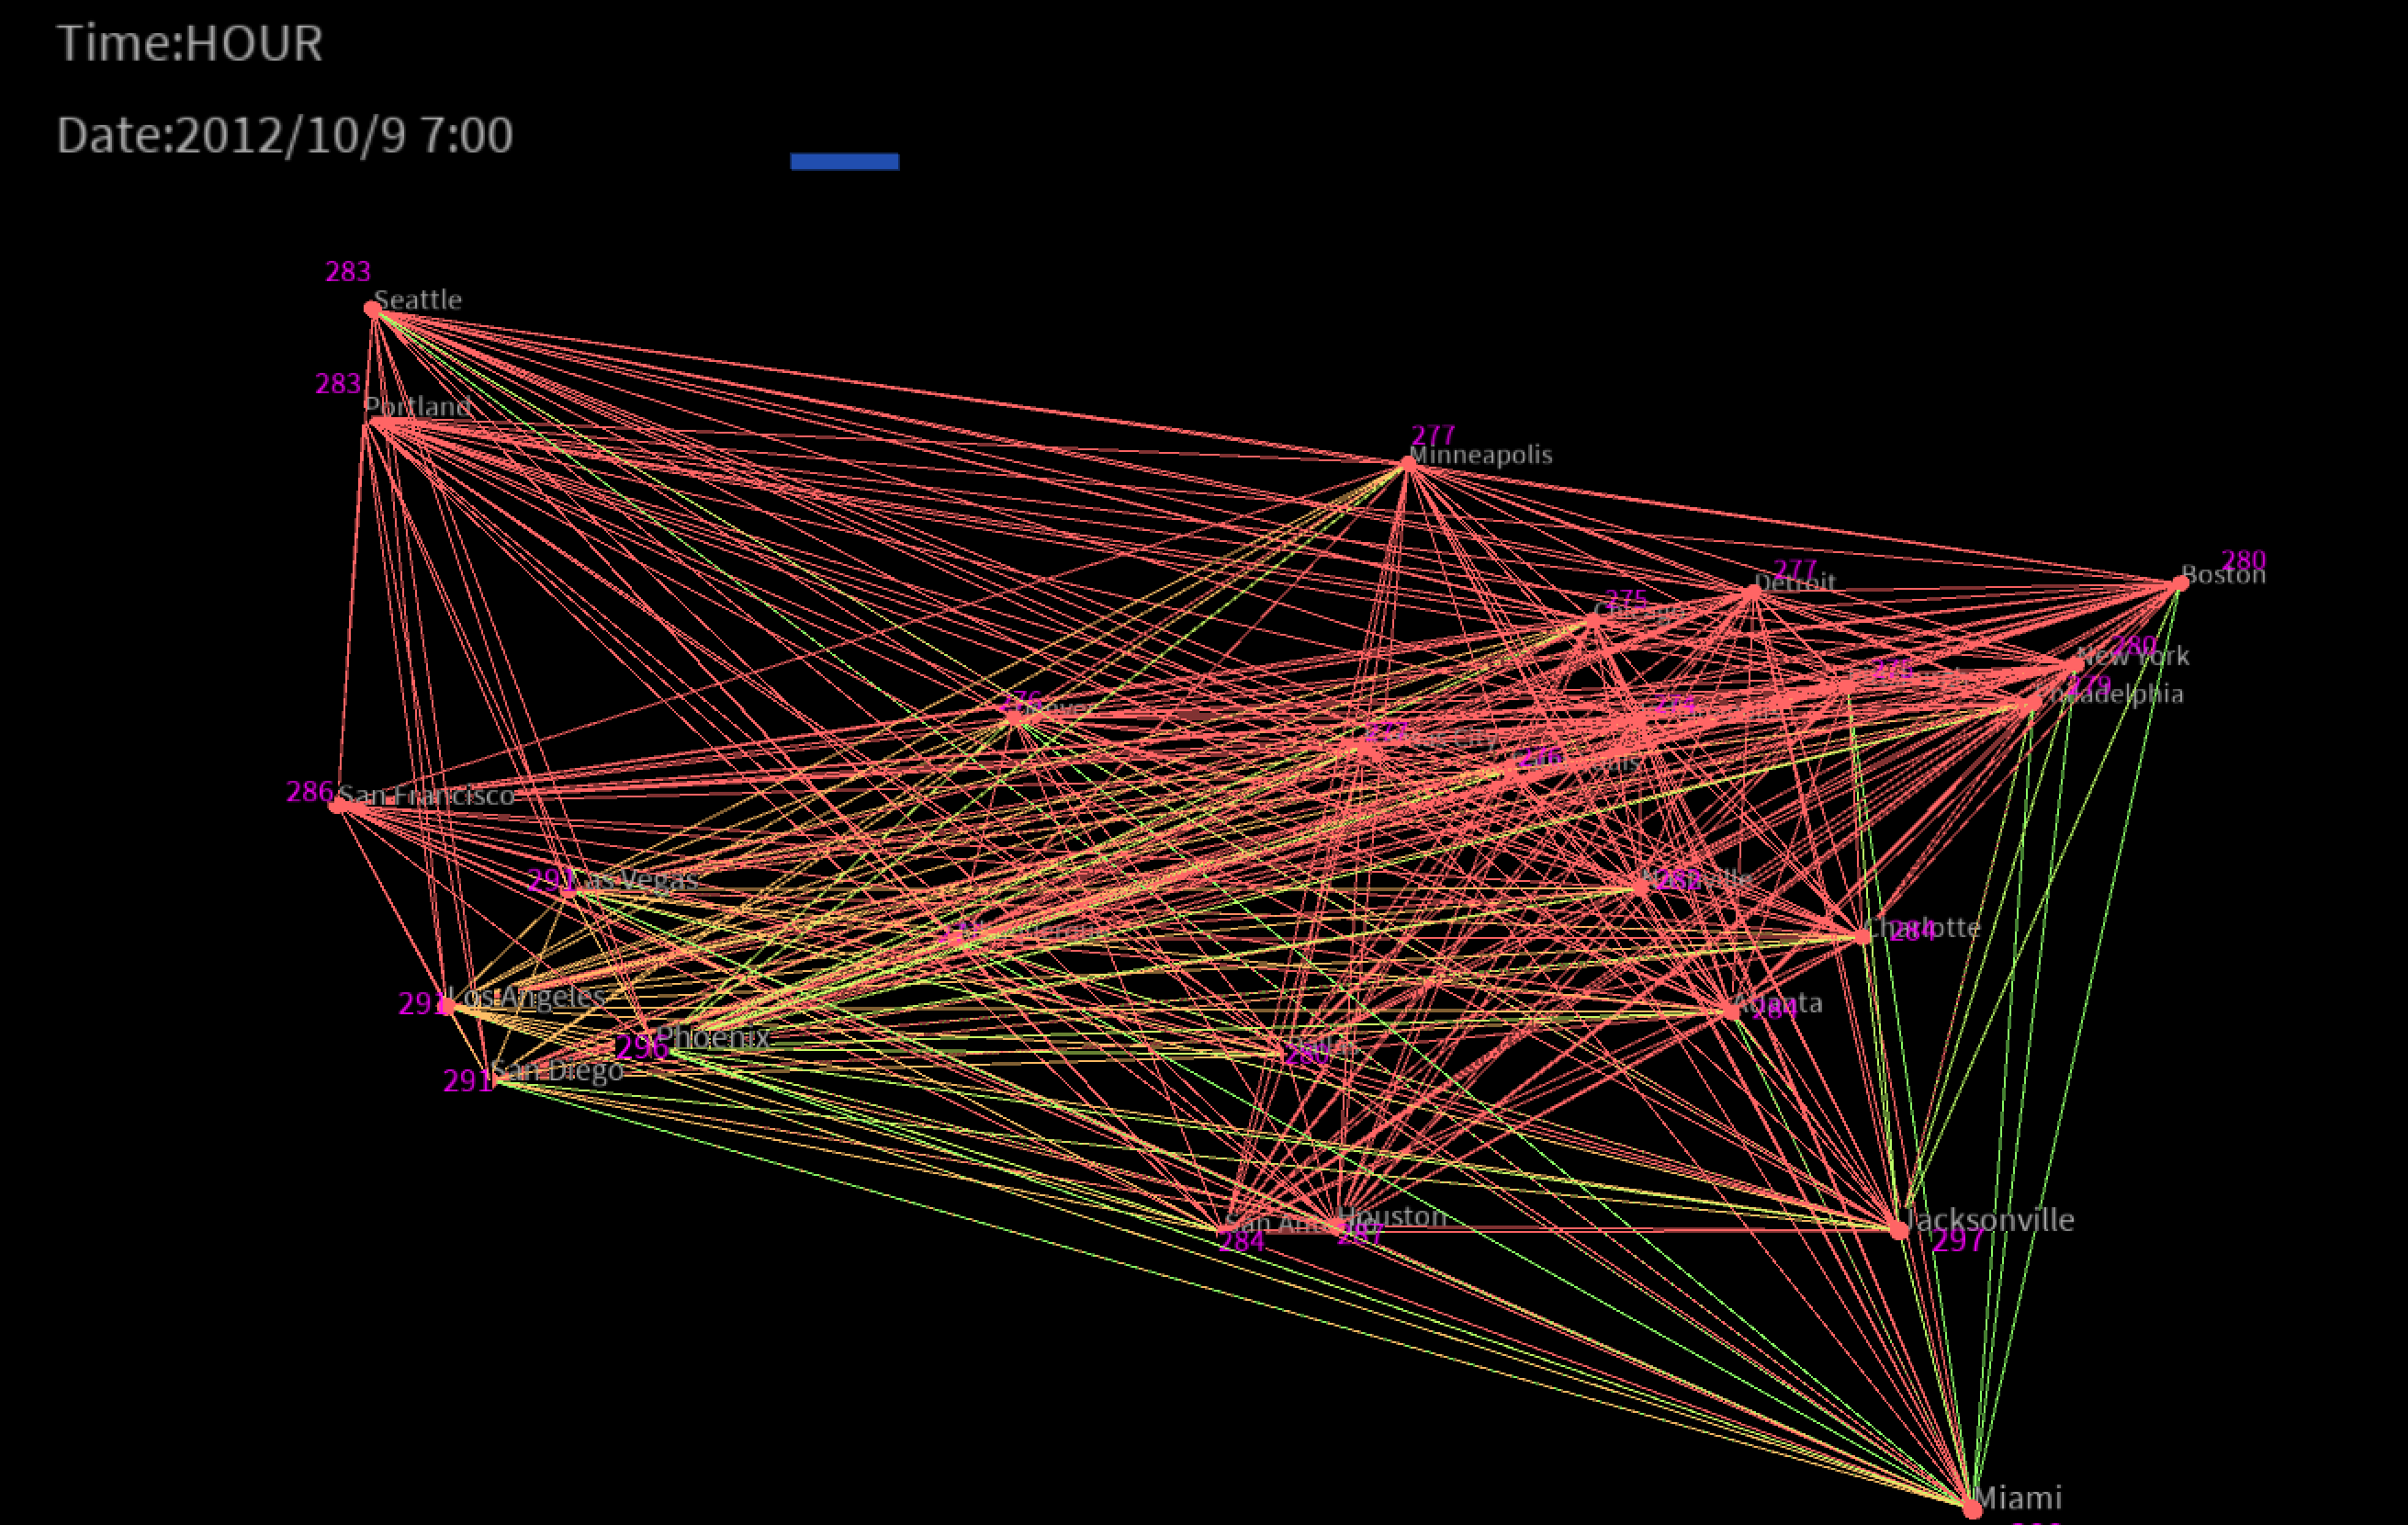
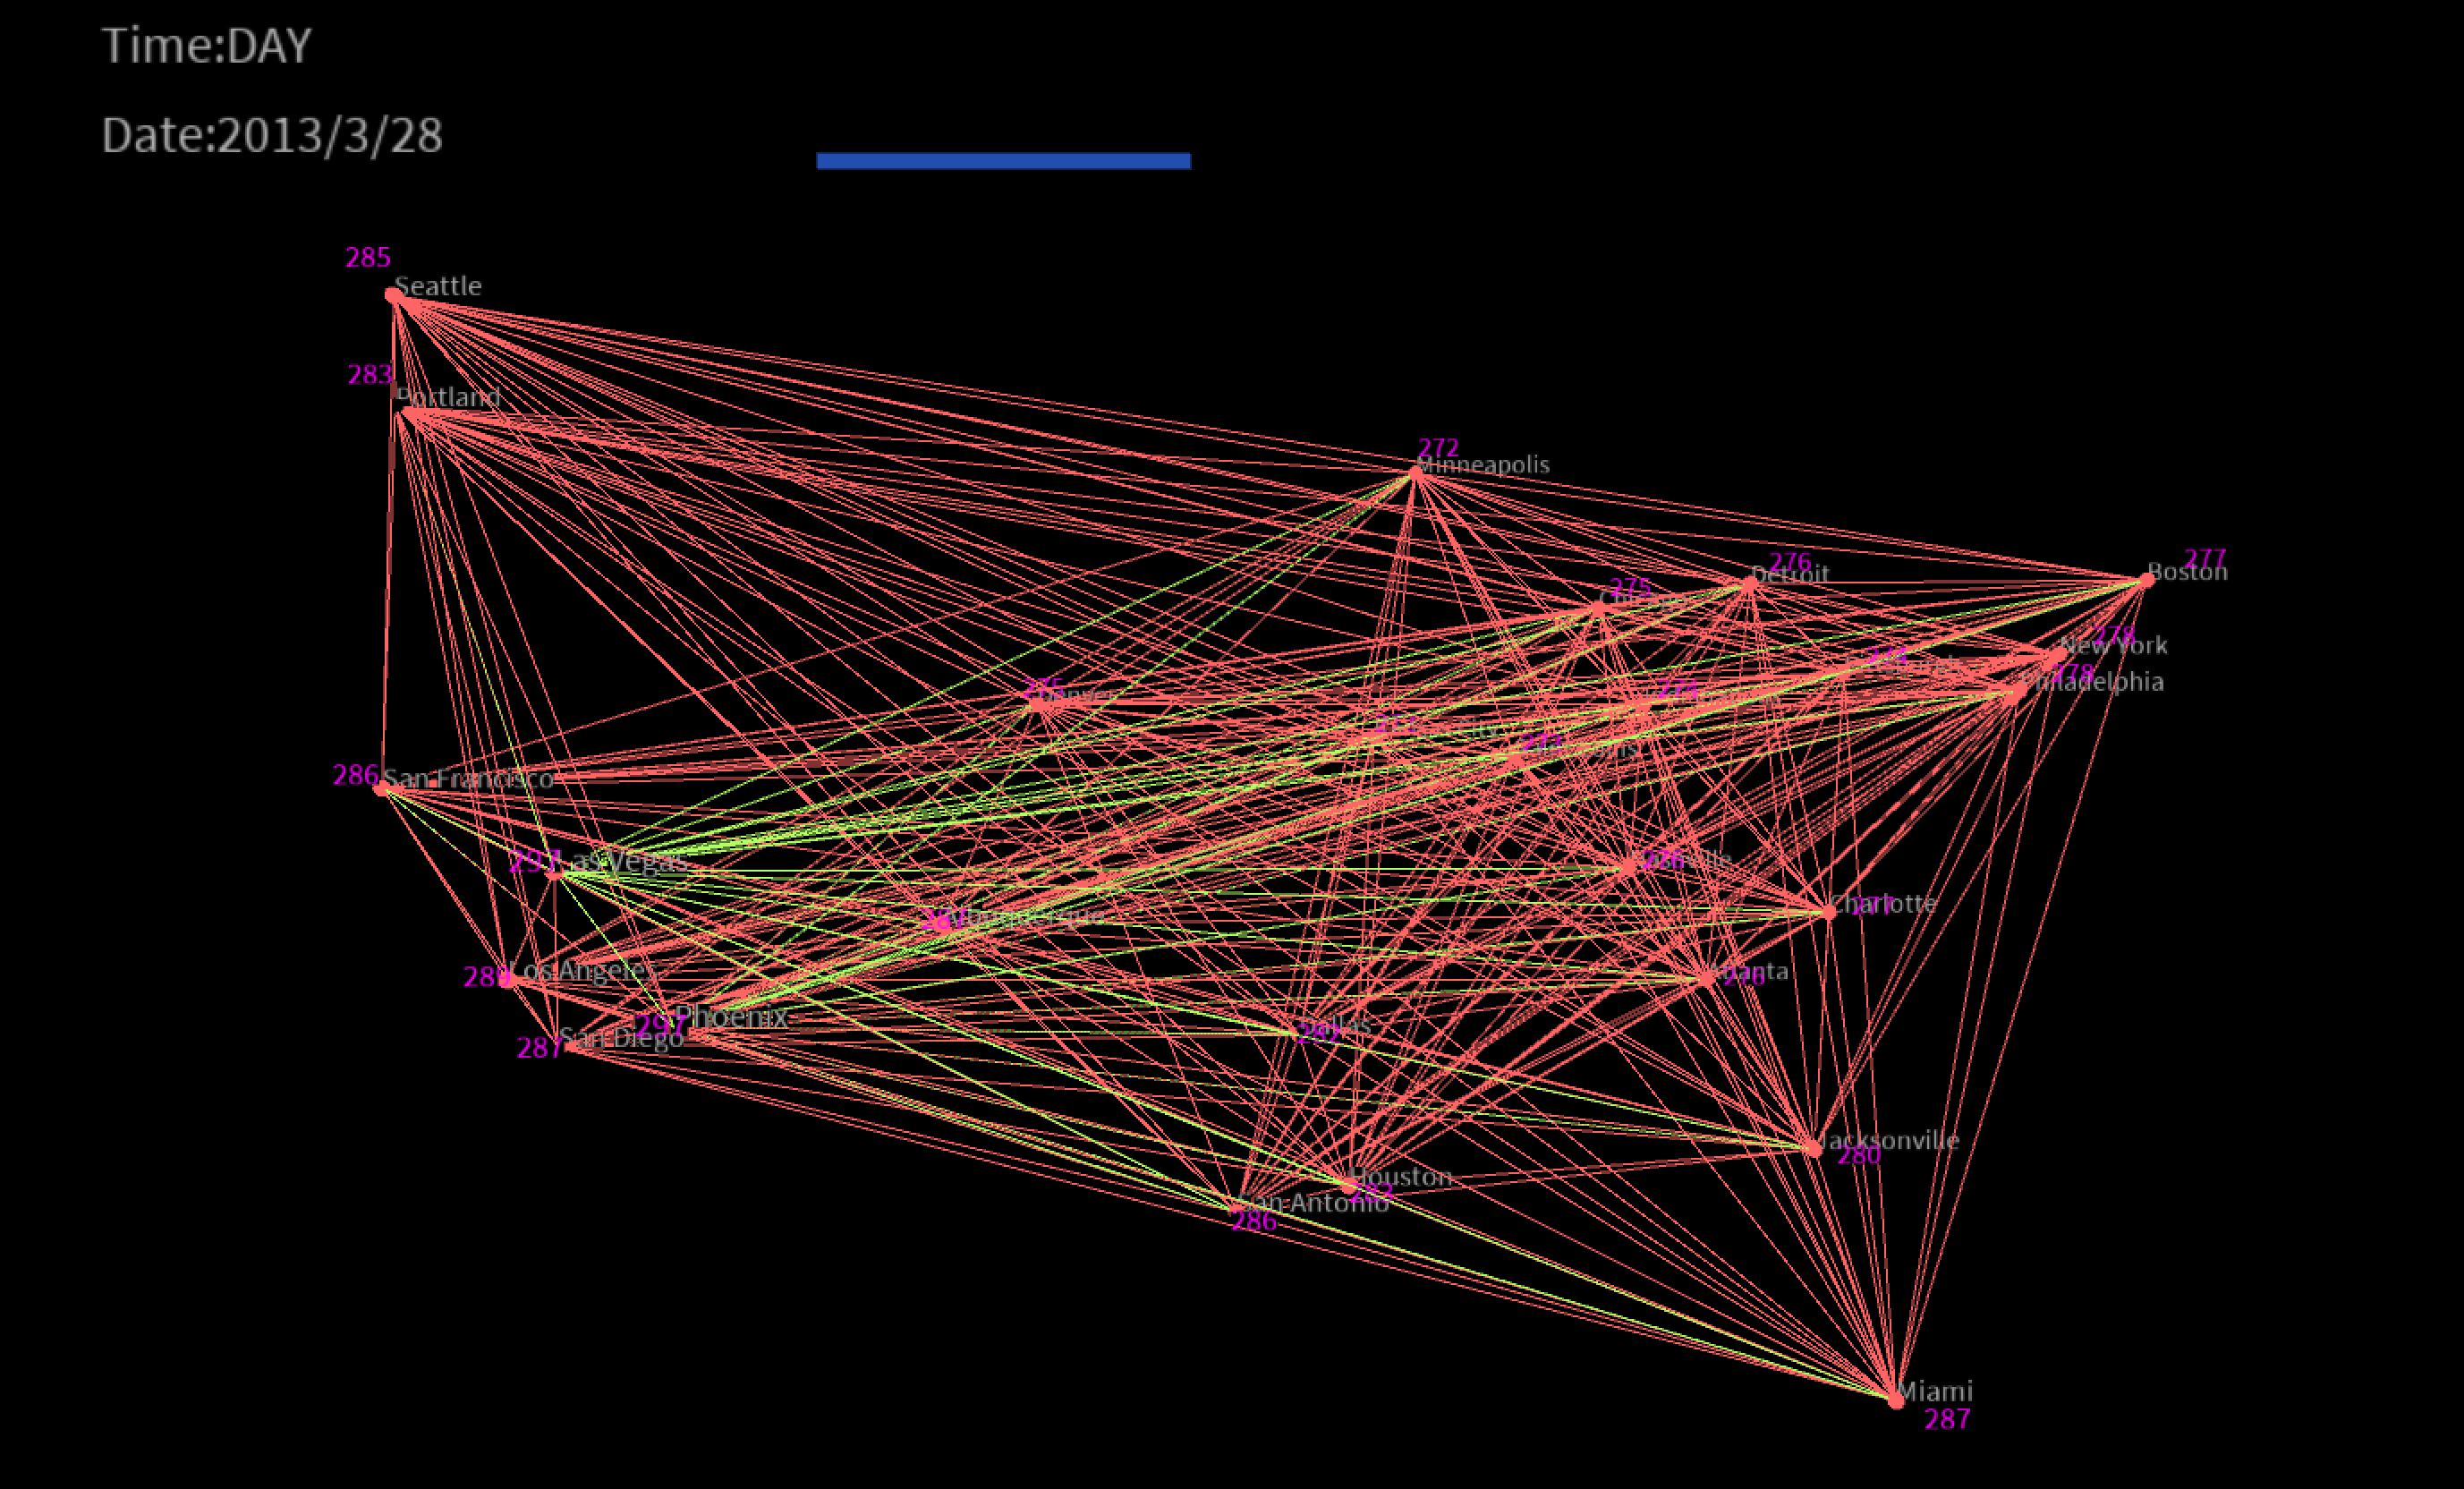
There are two modes for this visualizations, one is hourly air temperature movement and the other one is daily average temperature movement. You can simply click anywhere on the screen to switch the mode, and the mode shows on the upper left of the screen. Regarding the speed of the movement, you could justify it by moving your mousing near the slider area and dragging it without any click. To the very left of the slide, that would be the fastest speed and the opposite is the slowest. The time of the current movement is shown beside the slider as well. Also, I mark the current value of temperature along with the name of the city on each dot. Regarding the color, I use ColorMode() and HSB instead of stroke(), background(), etc. The brightness of the color is corresponding to the numerical value of the temperature. If the city's temperature is high, its color would be very light and red, and oppositely, it would be green. You could tell the difference in the temperature among cities.
please watch the YouTube video:
Here are some screenshots.
Here I upload my final movement visualization in Youtube.
There are two modes for this visualizations, one is hourly air temperature movement and the other one is daily average temperature movement. You can simply click anywhere on the screen to switch the mode, and the mode shows on the upper left of the screen. Regarding the speed of the movement, you could justify it by moving your mousing near the slider area and dragging it without any click. To the very left of the slide, that would be the fastest speed and the opposite is the slowest. The time of the current movement is shown beside the slider as well. Also, I mark the current value of temperature along with the name of the city on each dot. Regarding the color, I use ColorMode() and HSB instead of stroke(), background(), etc. The brightness of the color is corresponding to the numerical value of the temperature. If the city's temperature is high, its color would be very light and red, and oppositely, it would be green. You could tell the difference in the temperature among cities.
please watch the YouTube video:
Here are some screenshots.
Code