2021 Youtube Trending Videos Analysis on Three Categories
MAT 259, 2022
Lijuan Cheng
Concept
Due to Covid-19, most of the people have to work from home or study online, so there are a significant growth in the view counts of different kinds of videos. Hence, my research topic of the final project is to find some interesting results from the analysis of youtube trending videos. I have narrowed down the dataset to three major categorys, which are Howto & Style (category_id 26), Education(category_id 27), and Science & Technology(category_id 28).
Process
Data cleaning
I used python to clean the primary data and stored them in three new data files. I parsed the original date and time information into three new columns, which are published date, published time and trending day. Then I create a new column of response count which is the sum of likes, dislikes and comment_count. In the new dataset, there are 8 columns including title, channelTitle, categoryId, view_count, response_count, published_date, published_time and trending_day. Every row represents a record of one trending video. Although some videos have the same title, published_date, and published_time, they have different view_count, response_count and trending_day. Hence, through analyzing these videos, you can see the trend of the change in their counting data.
Visualization
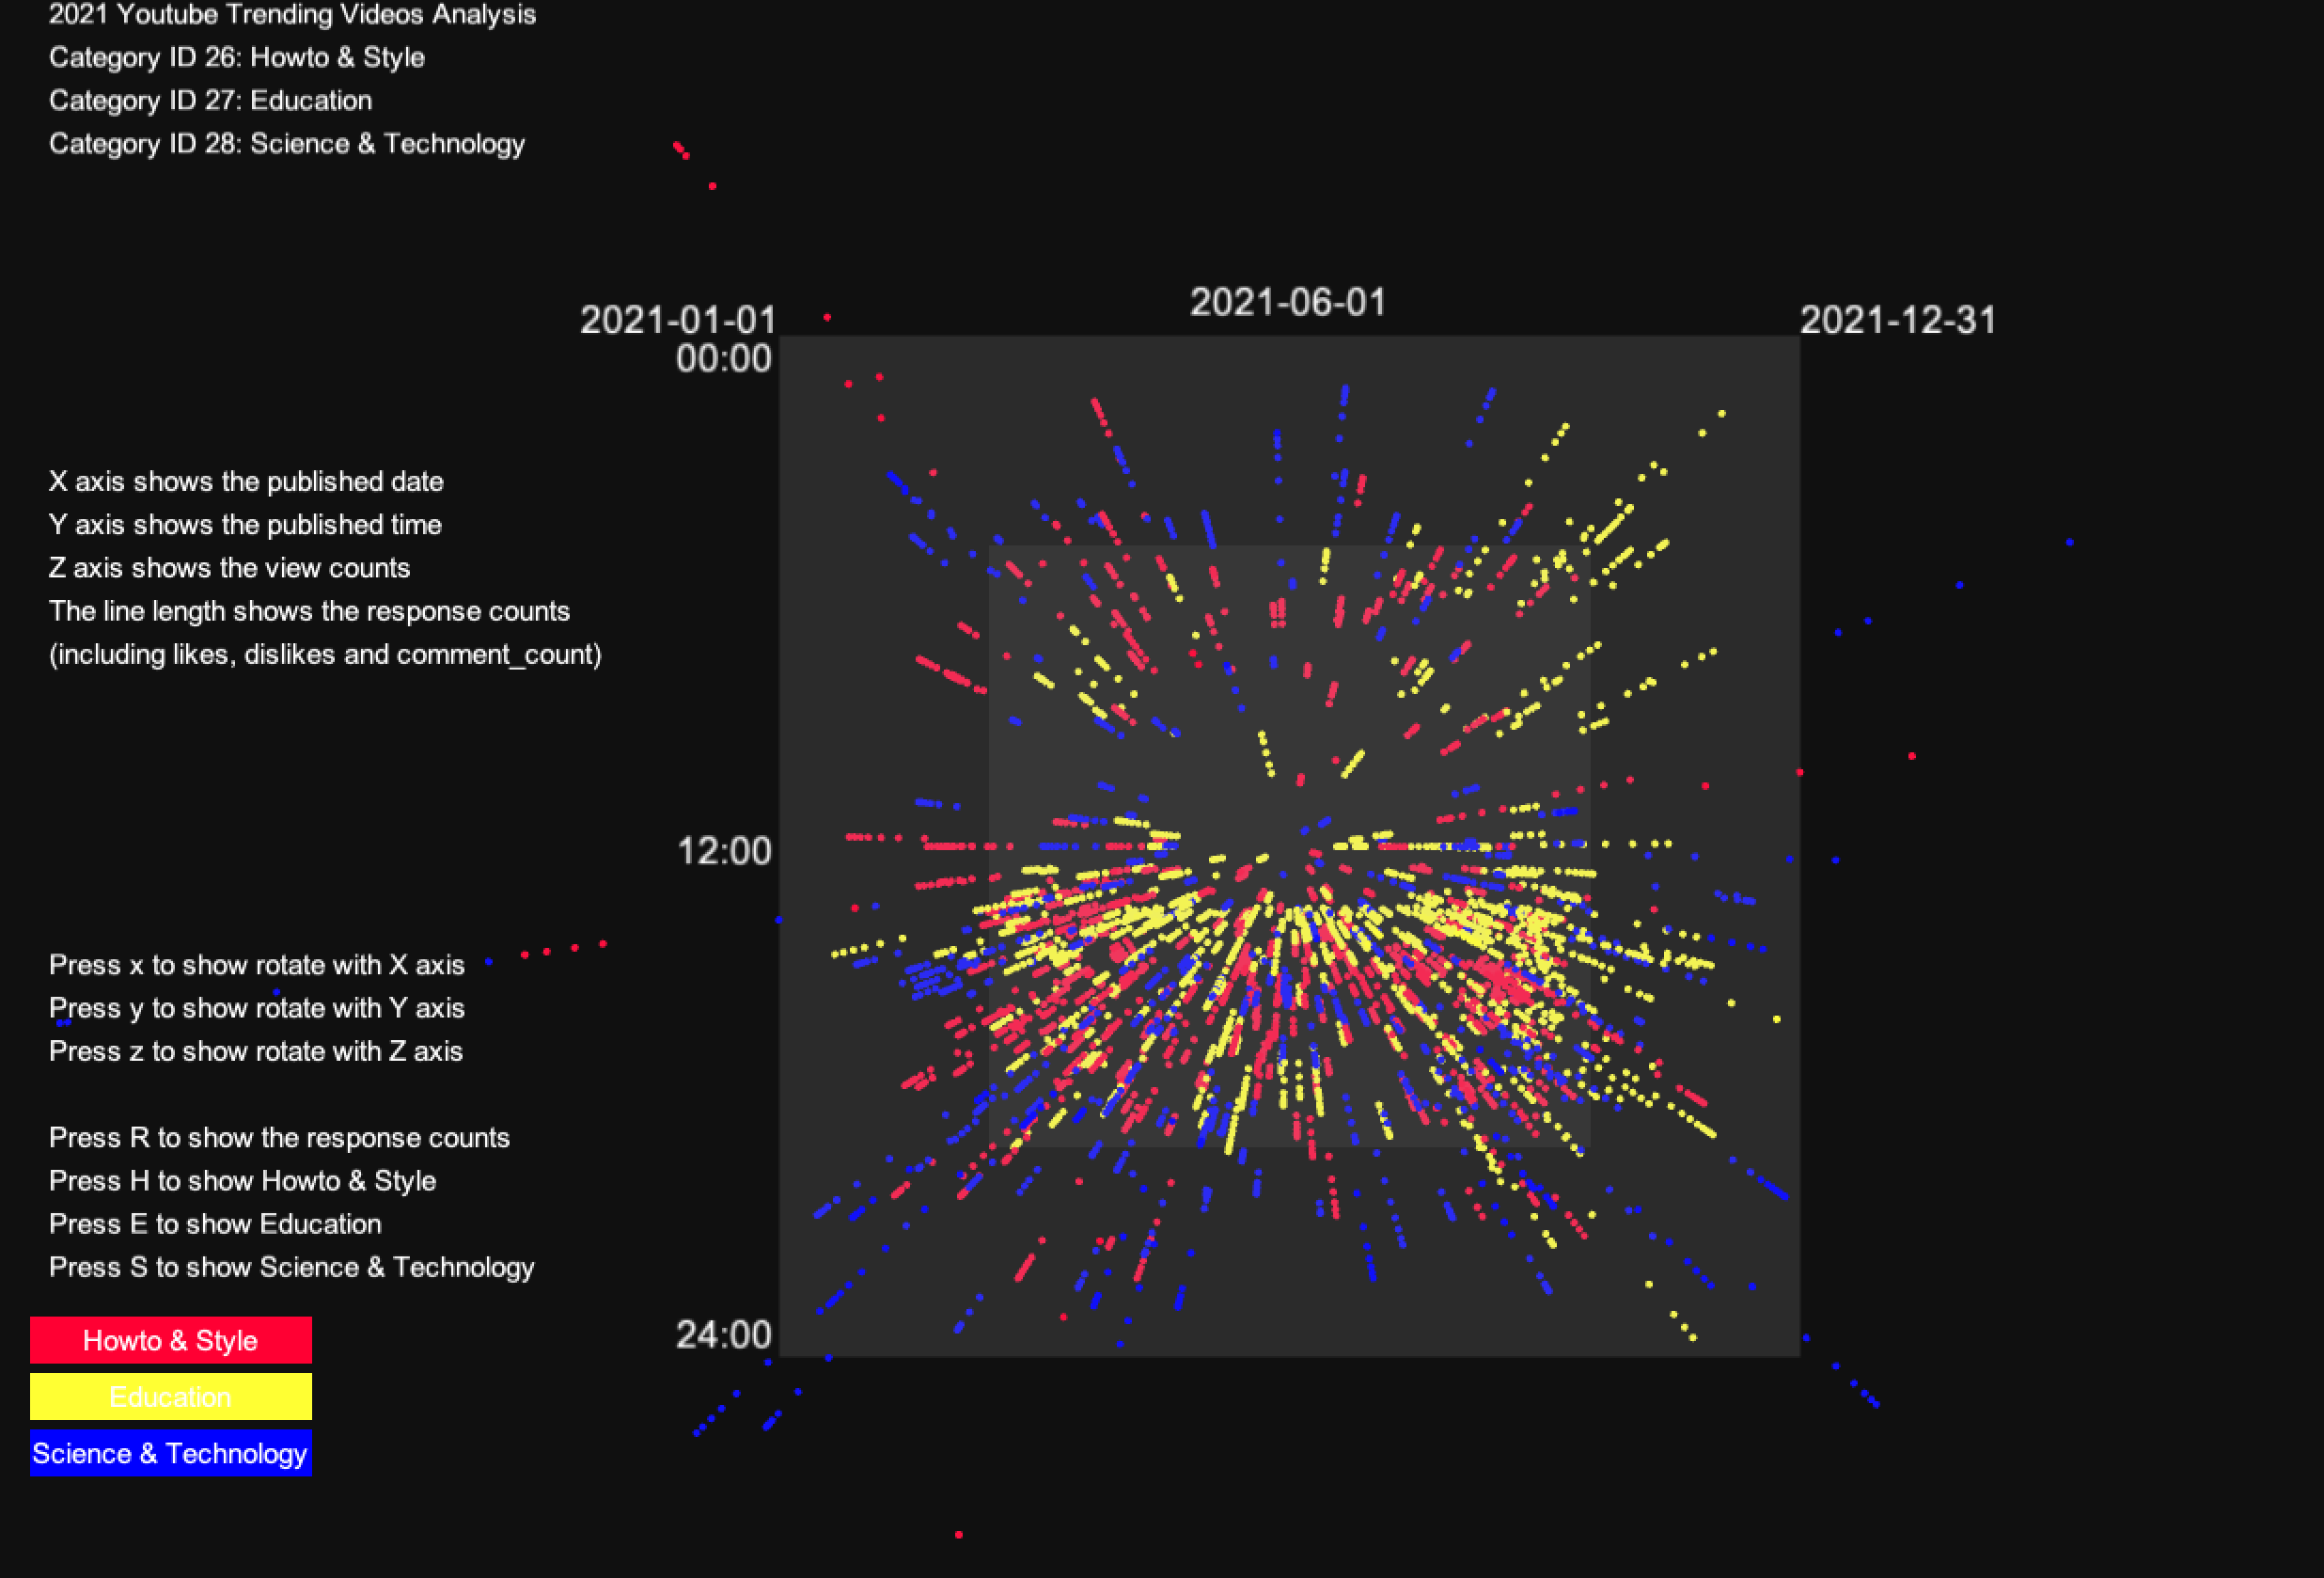
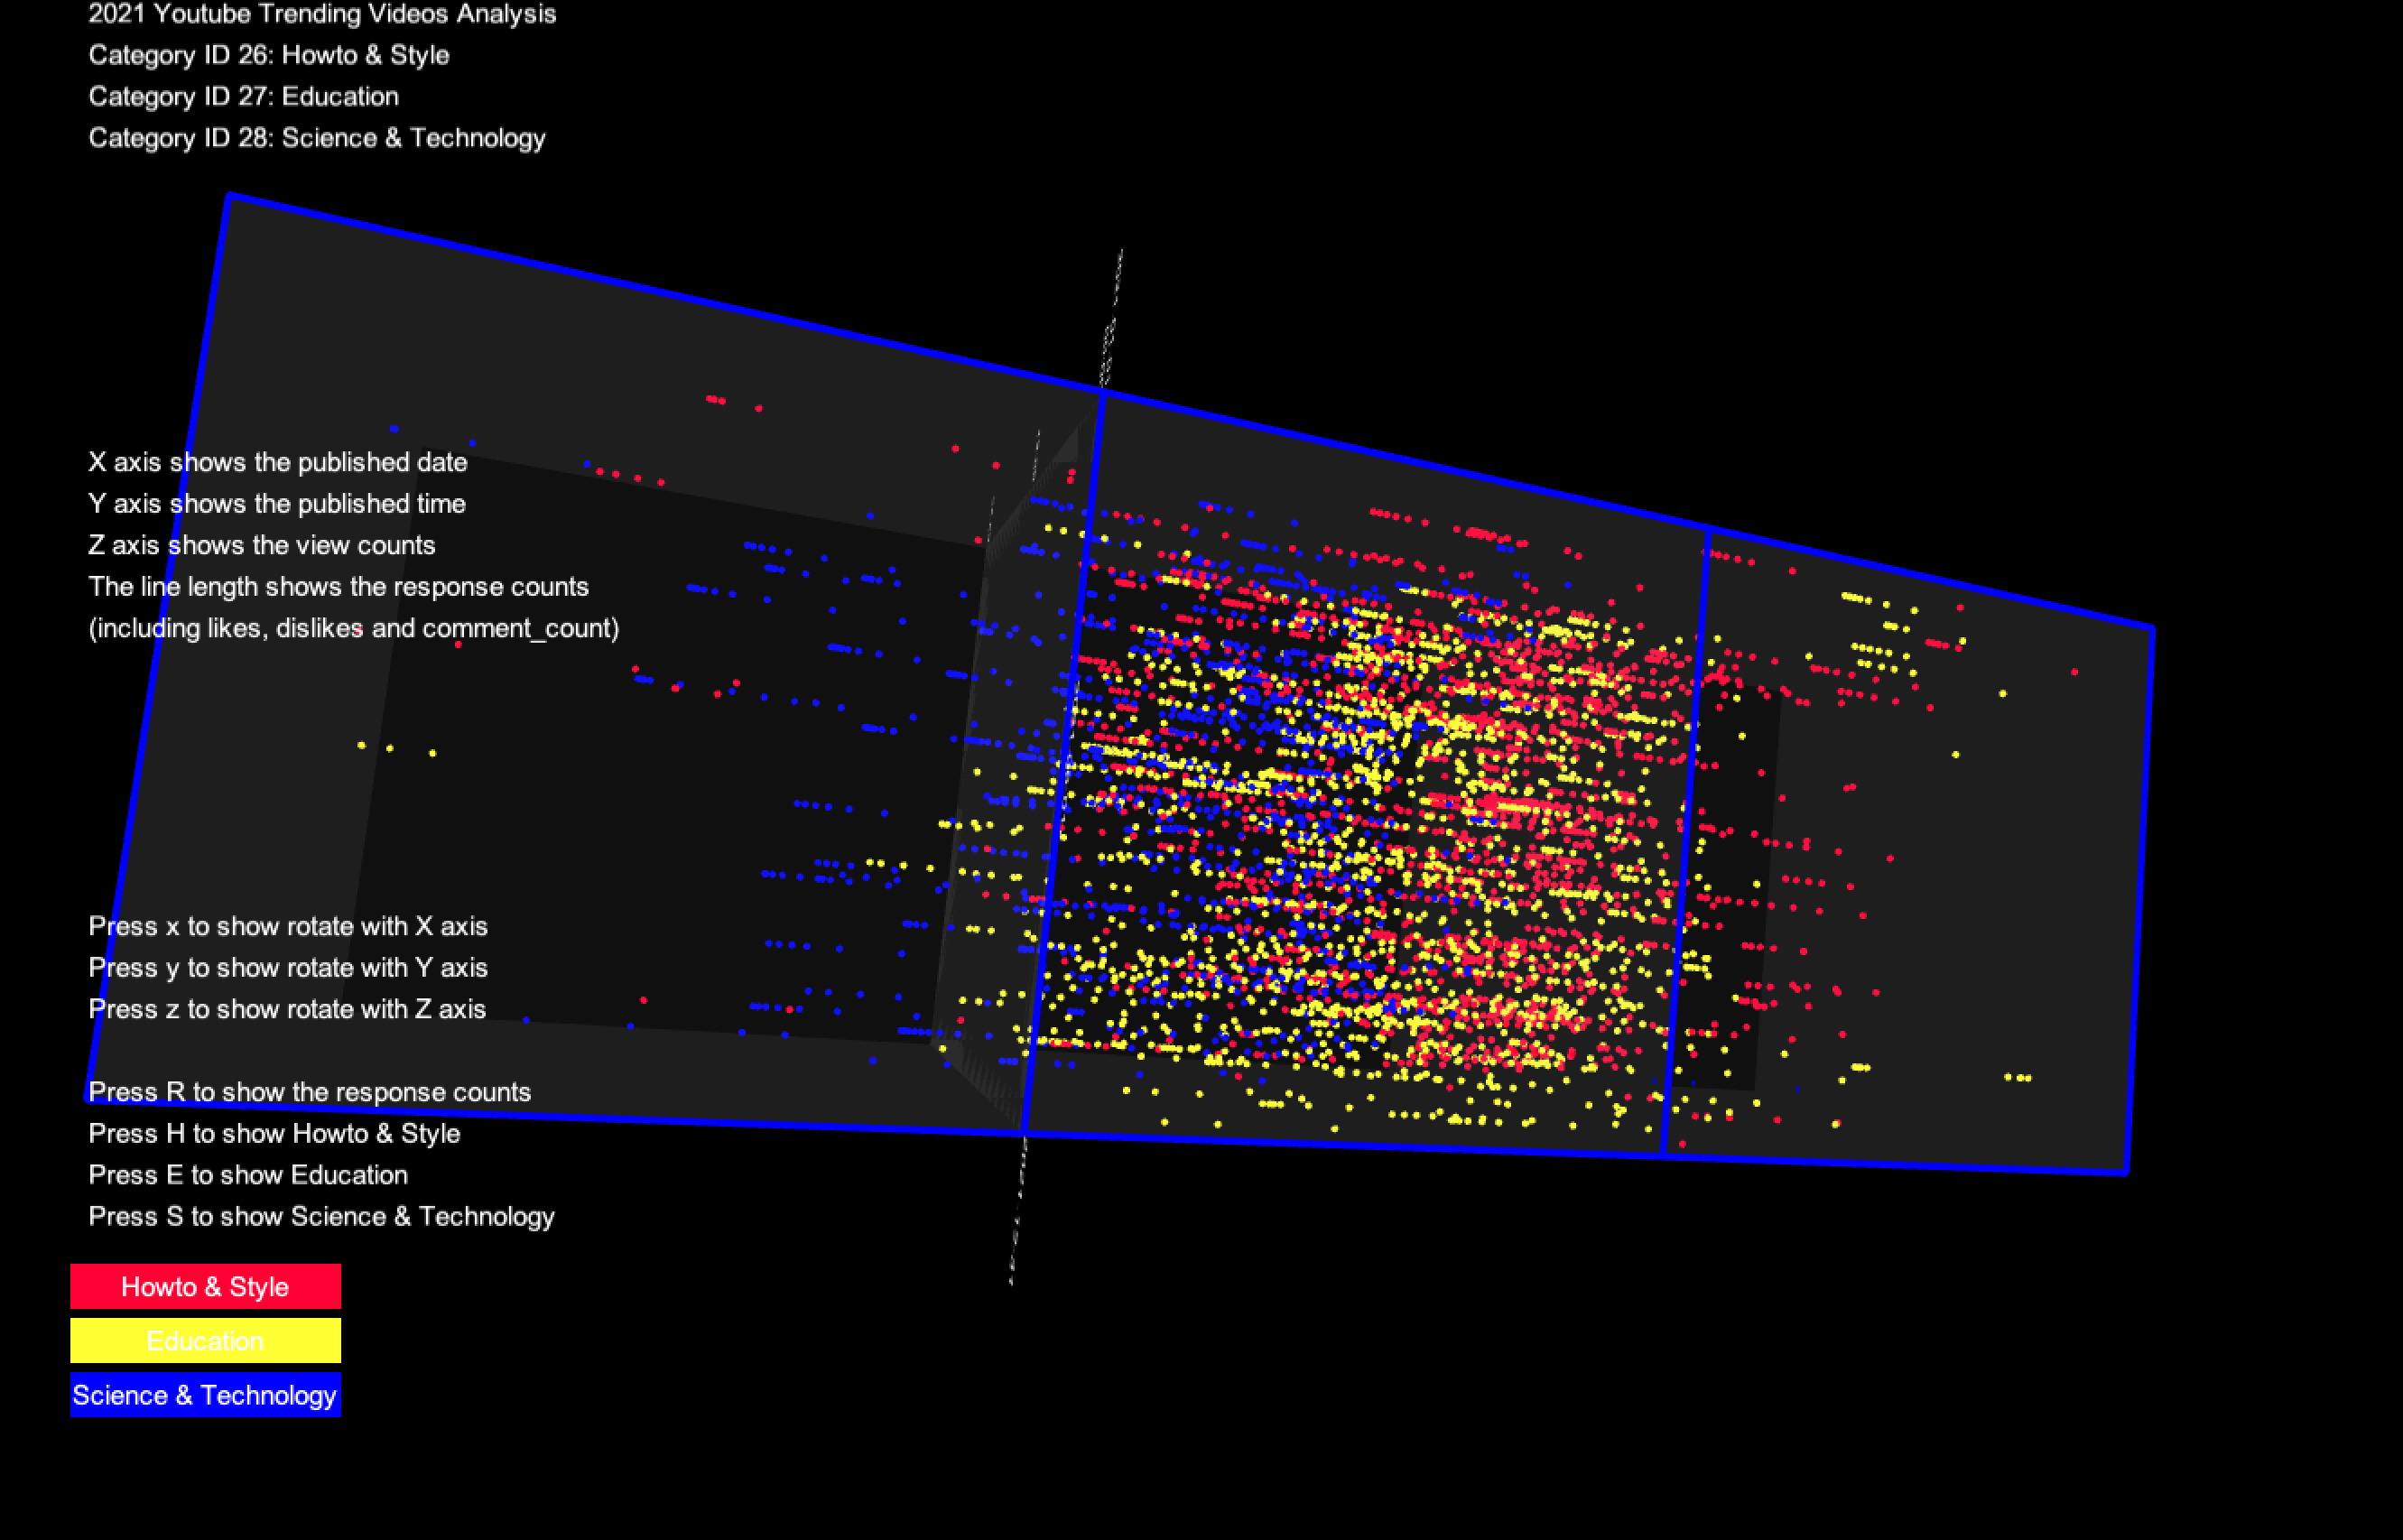
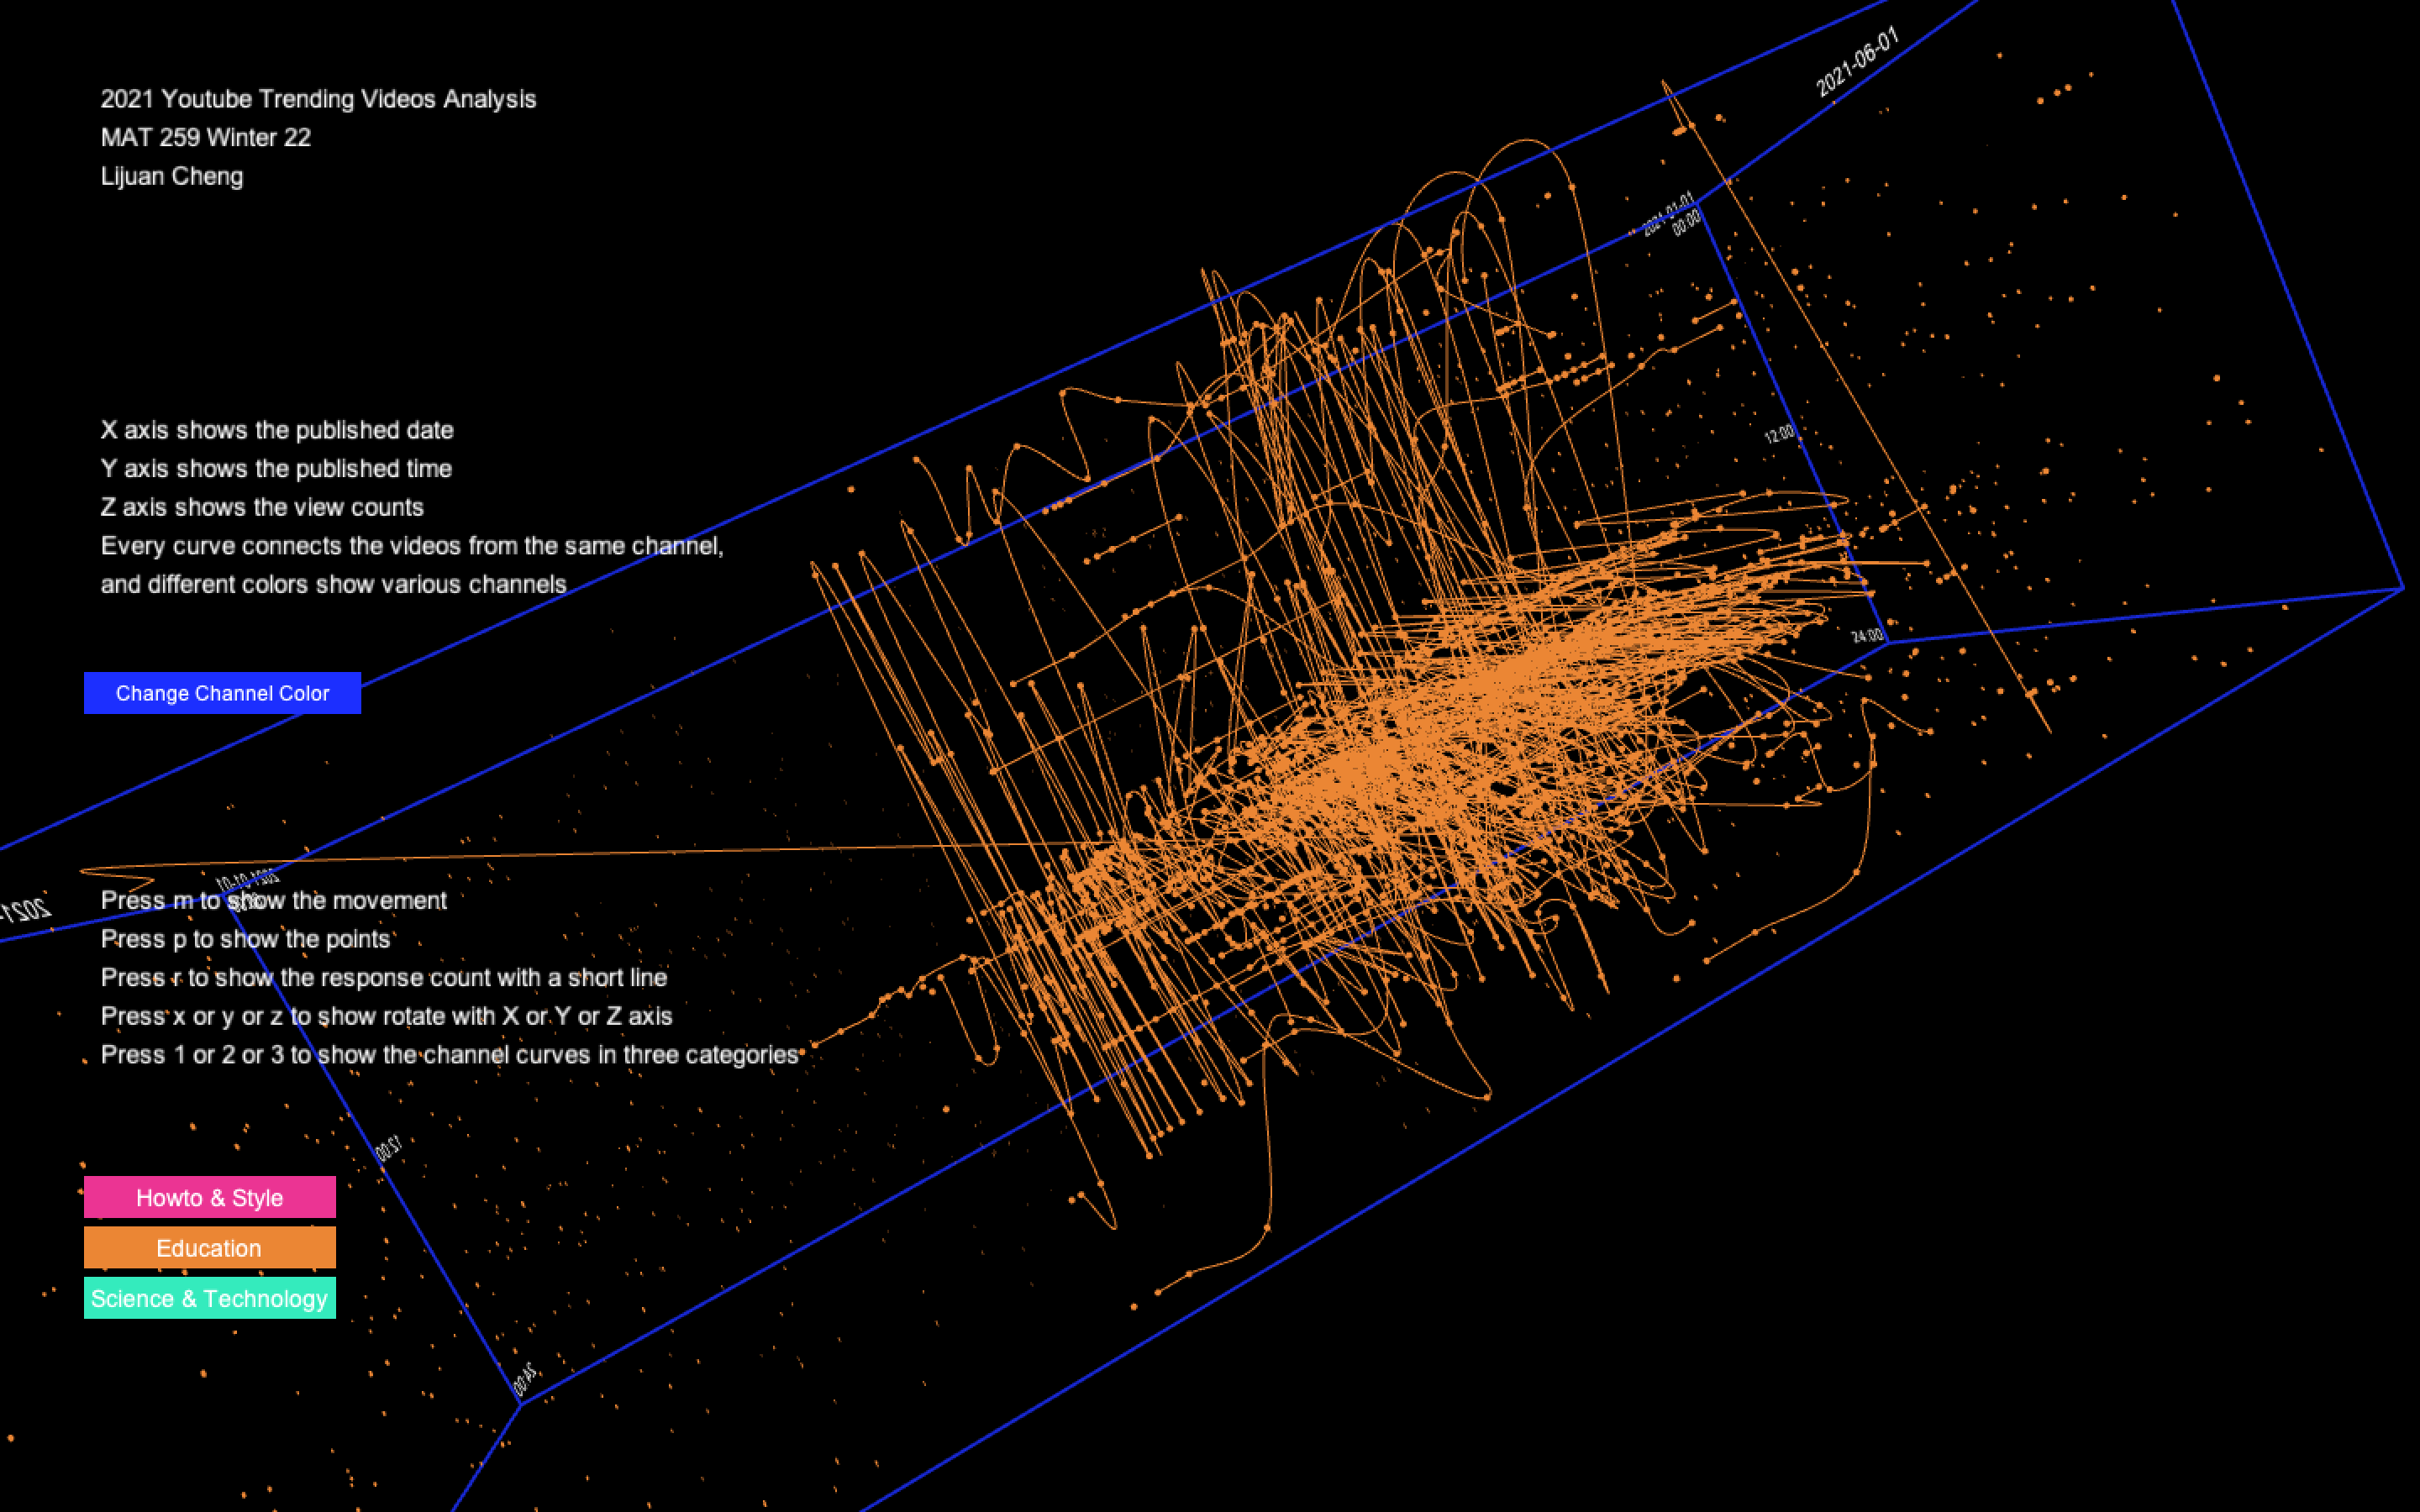
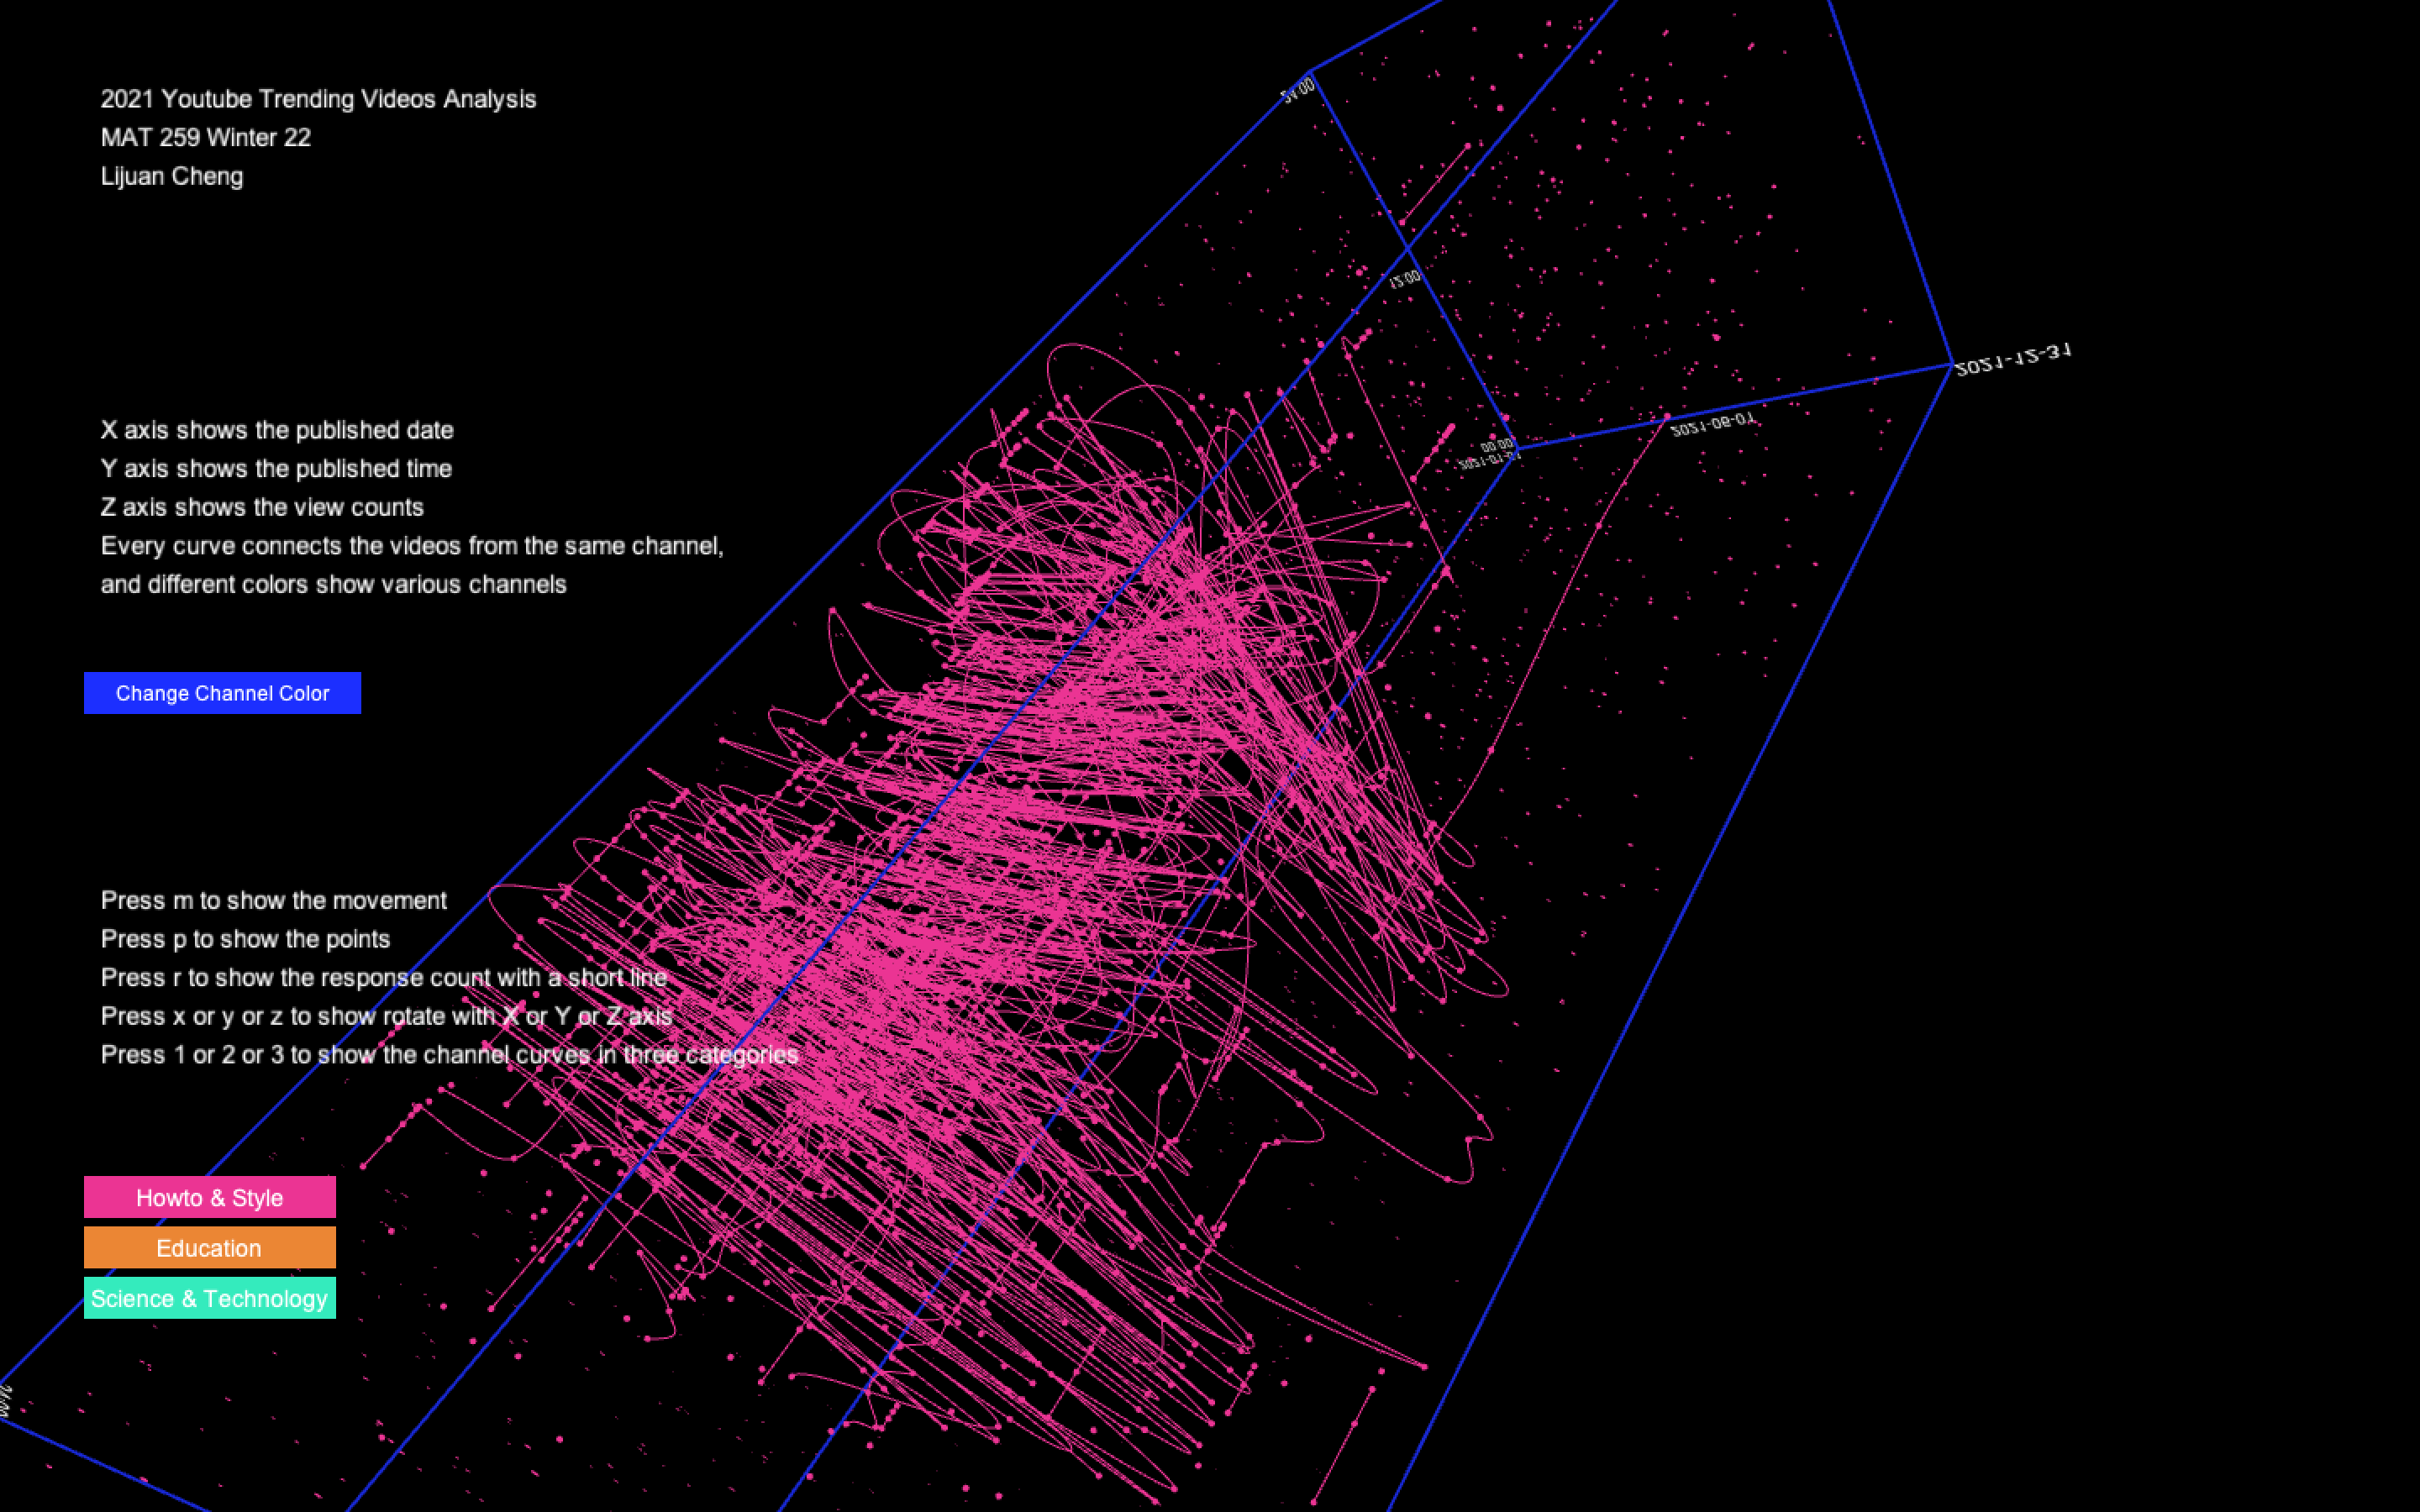
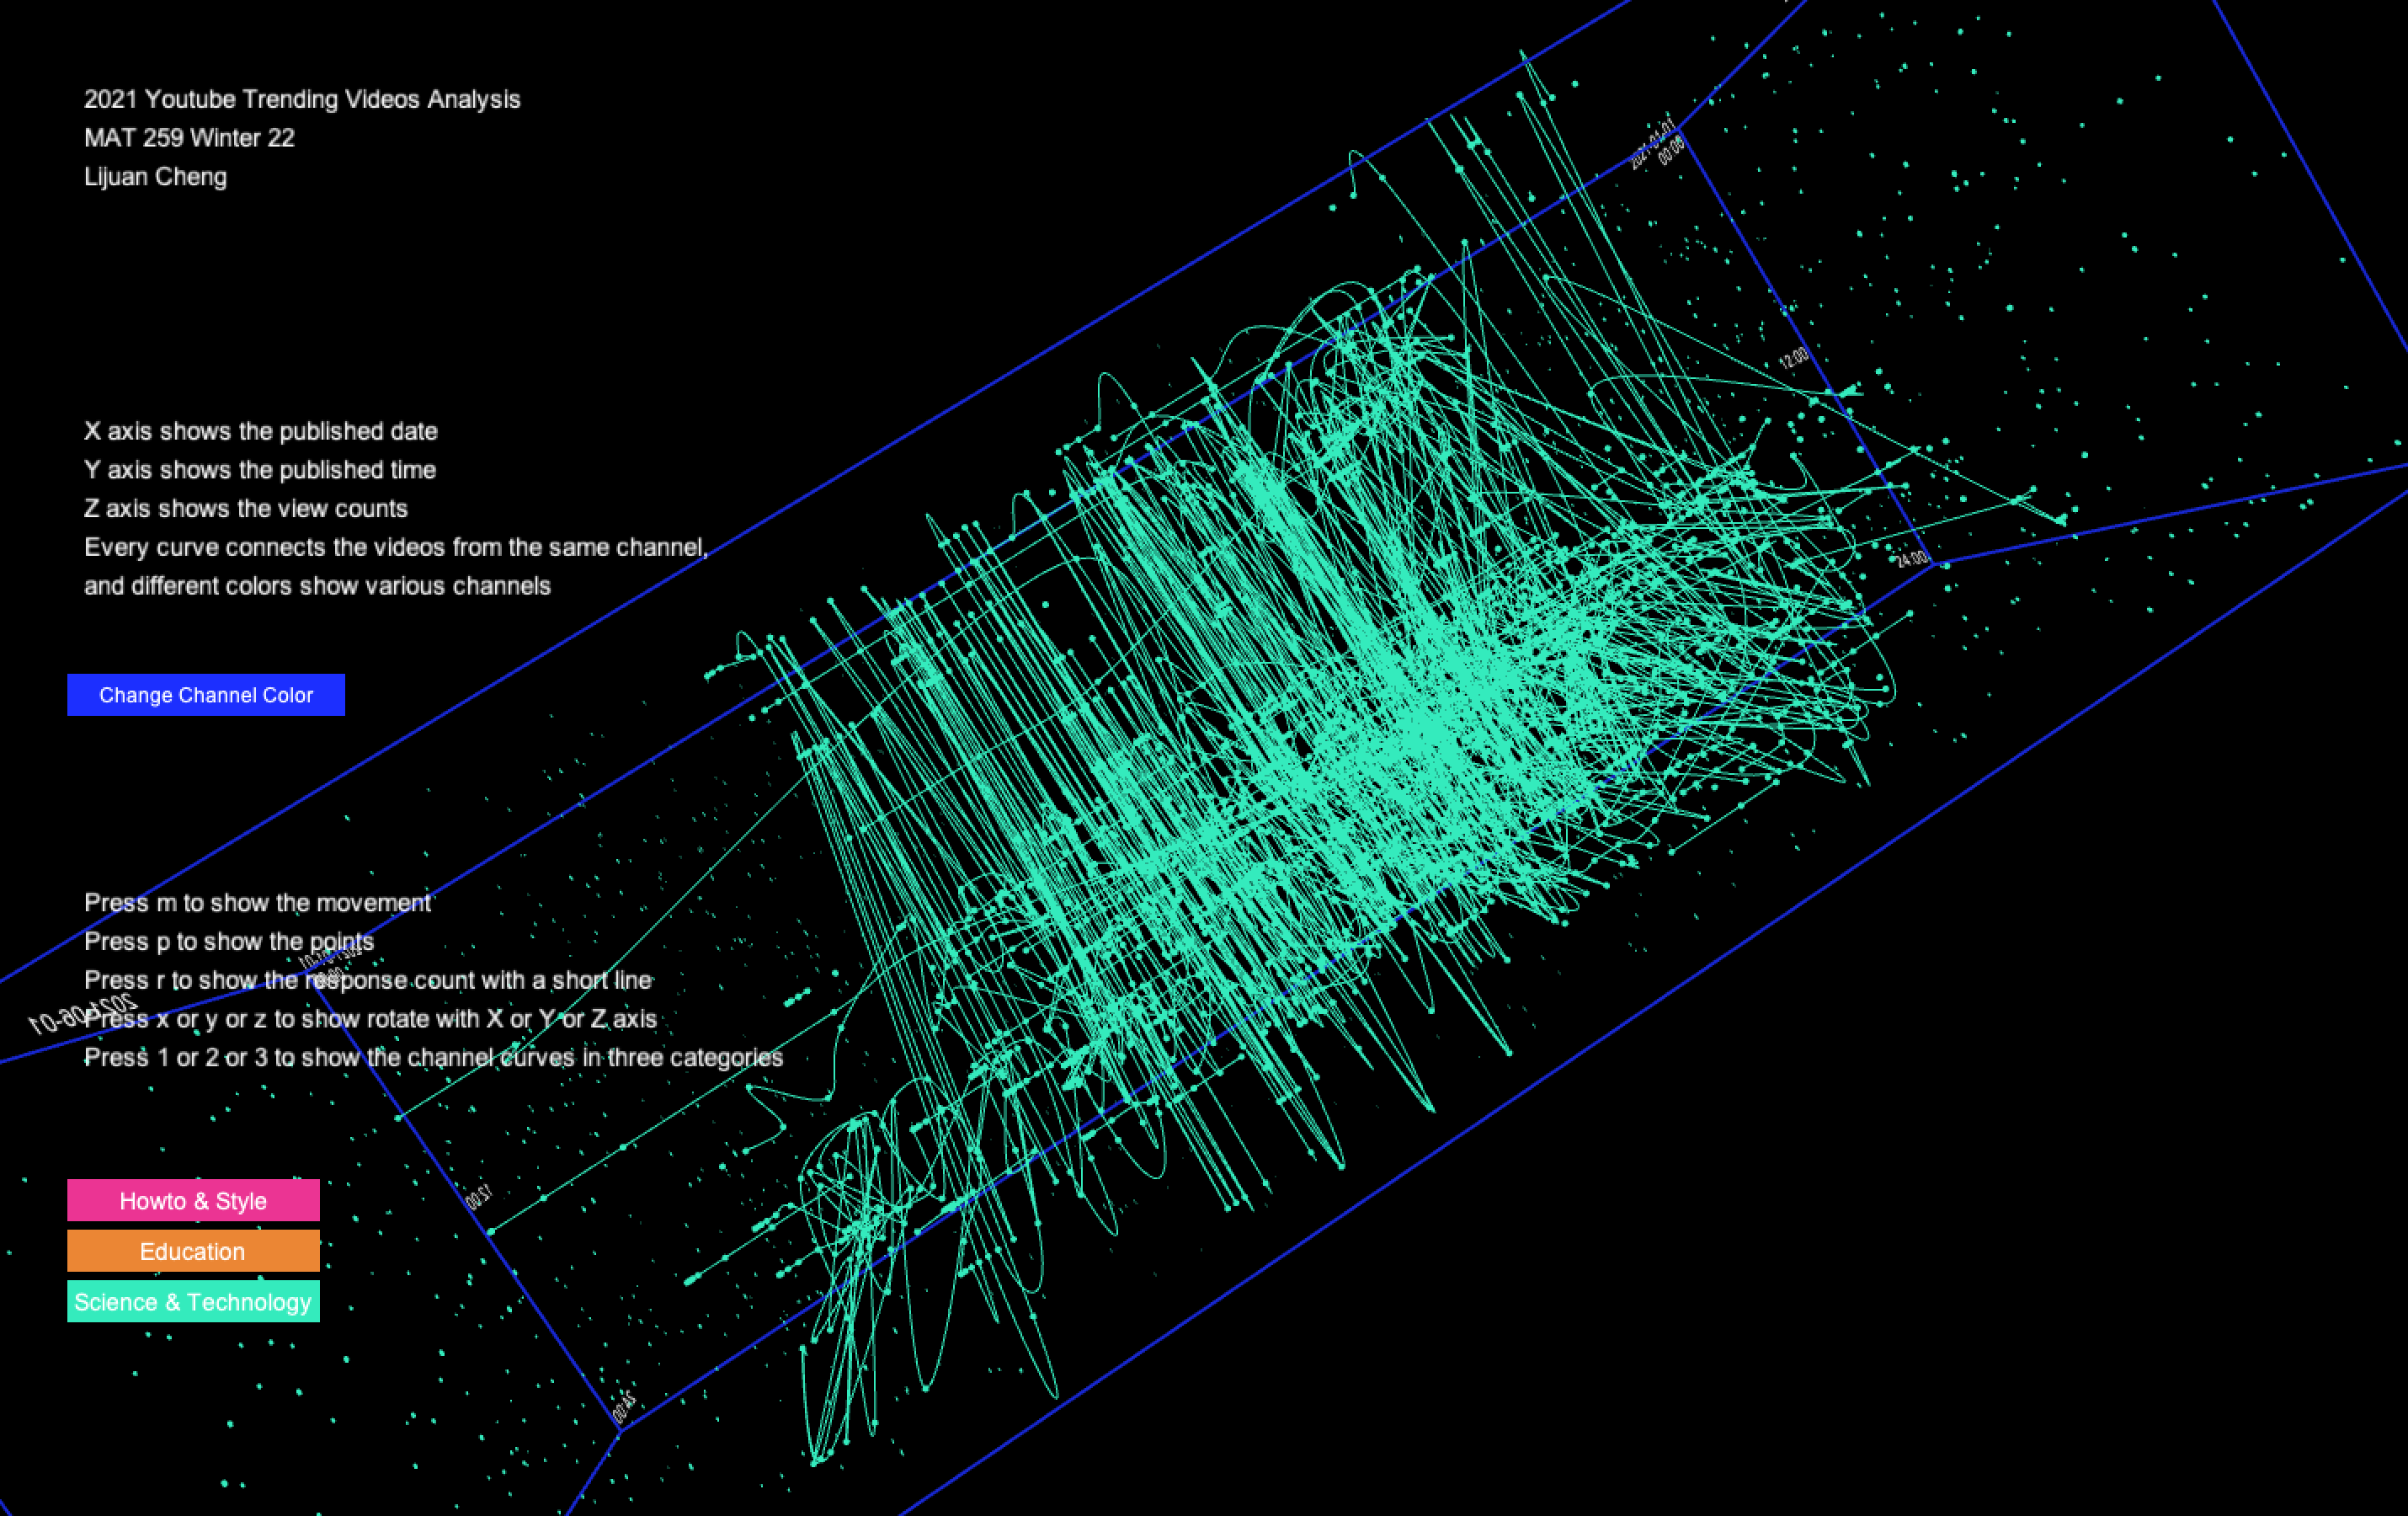
In the visualization process, I draw every video record as a 3D point and design the coordinates like this, X axis showing the published_date, Y axis showing the published_time and Z axis showing the view_count. Meanwhile, I also use the response_count as the length of the line starting with the video point. The categoryId will decide the color of every video, such as the red is the color of category Howto & Style, the yellow being the color of Education and the blue being the color of Science & Technology. Due to the view_count number being significantly larger than the days and times, I mapped the X axis and Y axis between -200 and 200, whereas mapped the Z axis between - 600 and 600 for clearly showing the variations among the view_count of different video points. Moreover, I also designed some interactions and rotating effects with the controlP5 buttons and keyboard pressing. The following images illustrate the latest progress in my visualization results.
I used python to clean the primary data and stored them in three new data files. I parsed the original date and time information into three new columns, which are published date, published time and trending day. Then I create a new column of response count which is the sum of likes, dislikes and comment_count. In the new dataset, there are 8 columns including title, channelTitle, categoryId, view_count, response_count, published_date, published_time and trending_day. Every row represents a record of one trending video. Although some videos have the same title, published_date, and published_time, they have different view_count, response_count and trending_day. Hence, through analyzing these videos, you can see the trend of the change in their counting data.
Visualization
In the visualization process, I draw every video record as a 3D point and design the coordinates like this, X axis showing the published_date, Y axis showing the published_time and Z axis showing the view_count. Meanwhile, I also use the response_count as the length of the line starting with the video point. The categoryId will decide the color of every video, such as the red is the color of category Howto & Style, the yellow being the color of Education and the blue being the color of Science & Technology. Due to the view_count number being significantly larger than the days and times, I mapped the X axis and Y axis between -200 and 200, whereas mapped the Z axis between - 600 and 600 for clearly showing the variations among the view_count of different video points. Moreover, I also designed some interactions and rotating effects with the controlP5 buttons and keyboard pressing. The following images illustrate the latest progress in my visualization results.
Final result
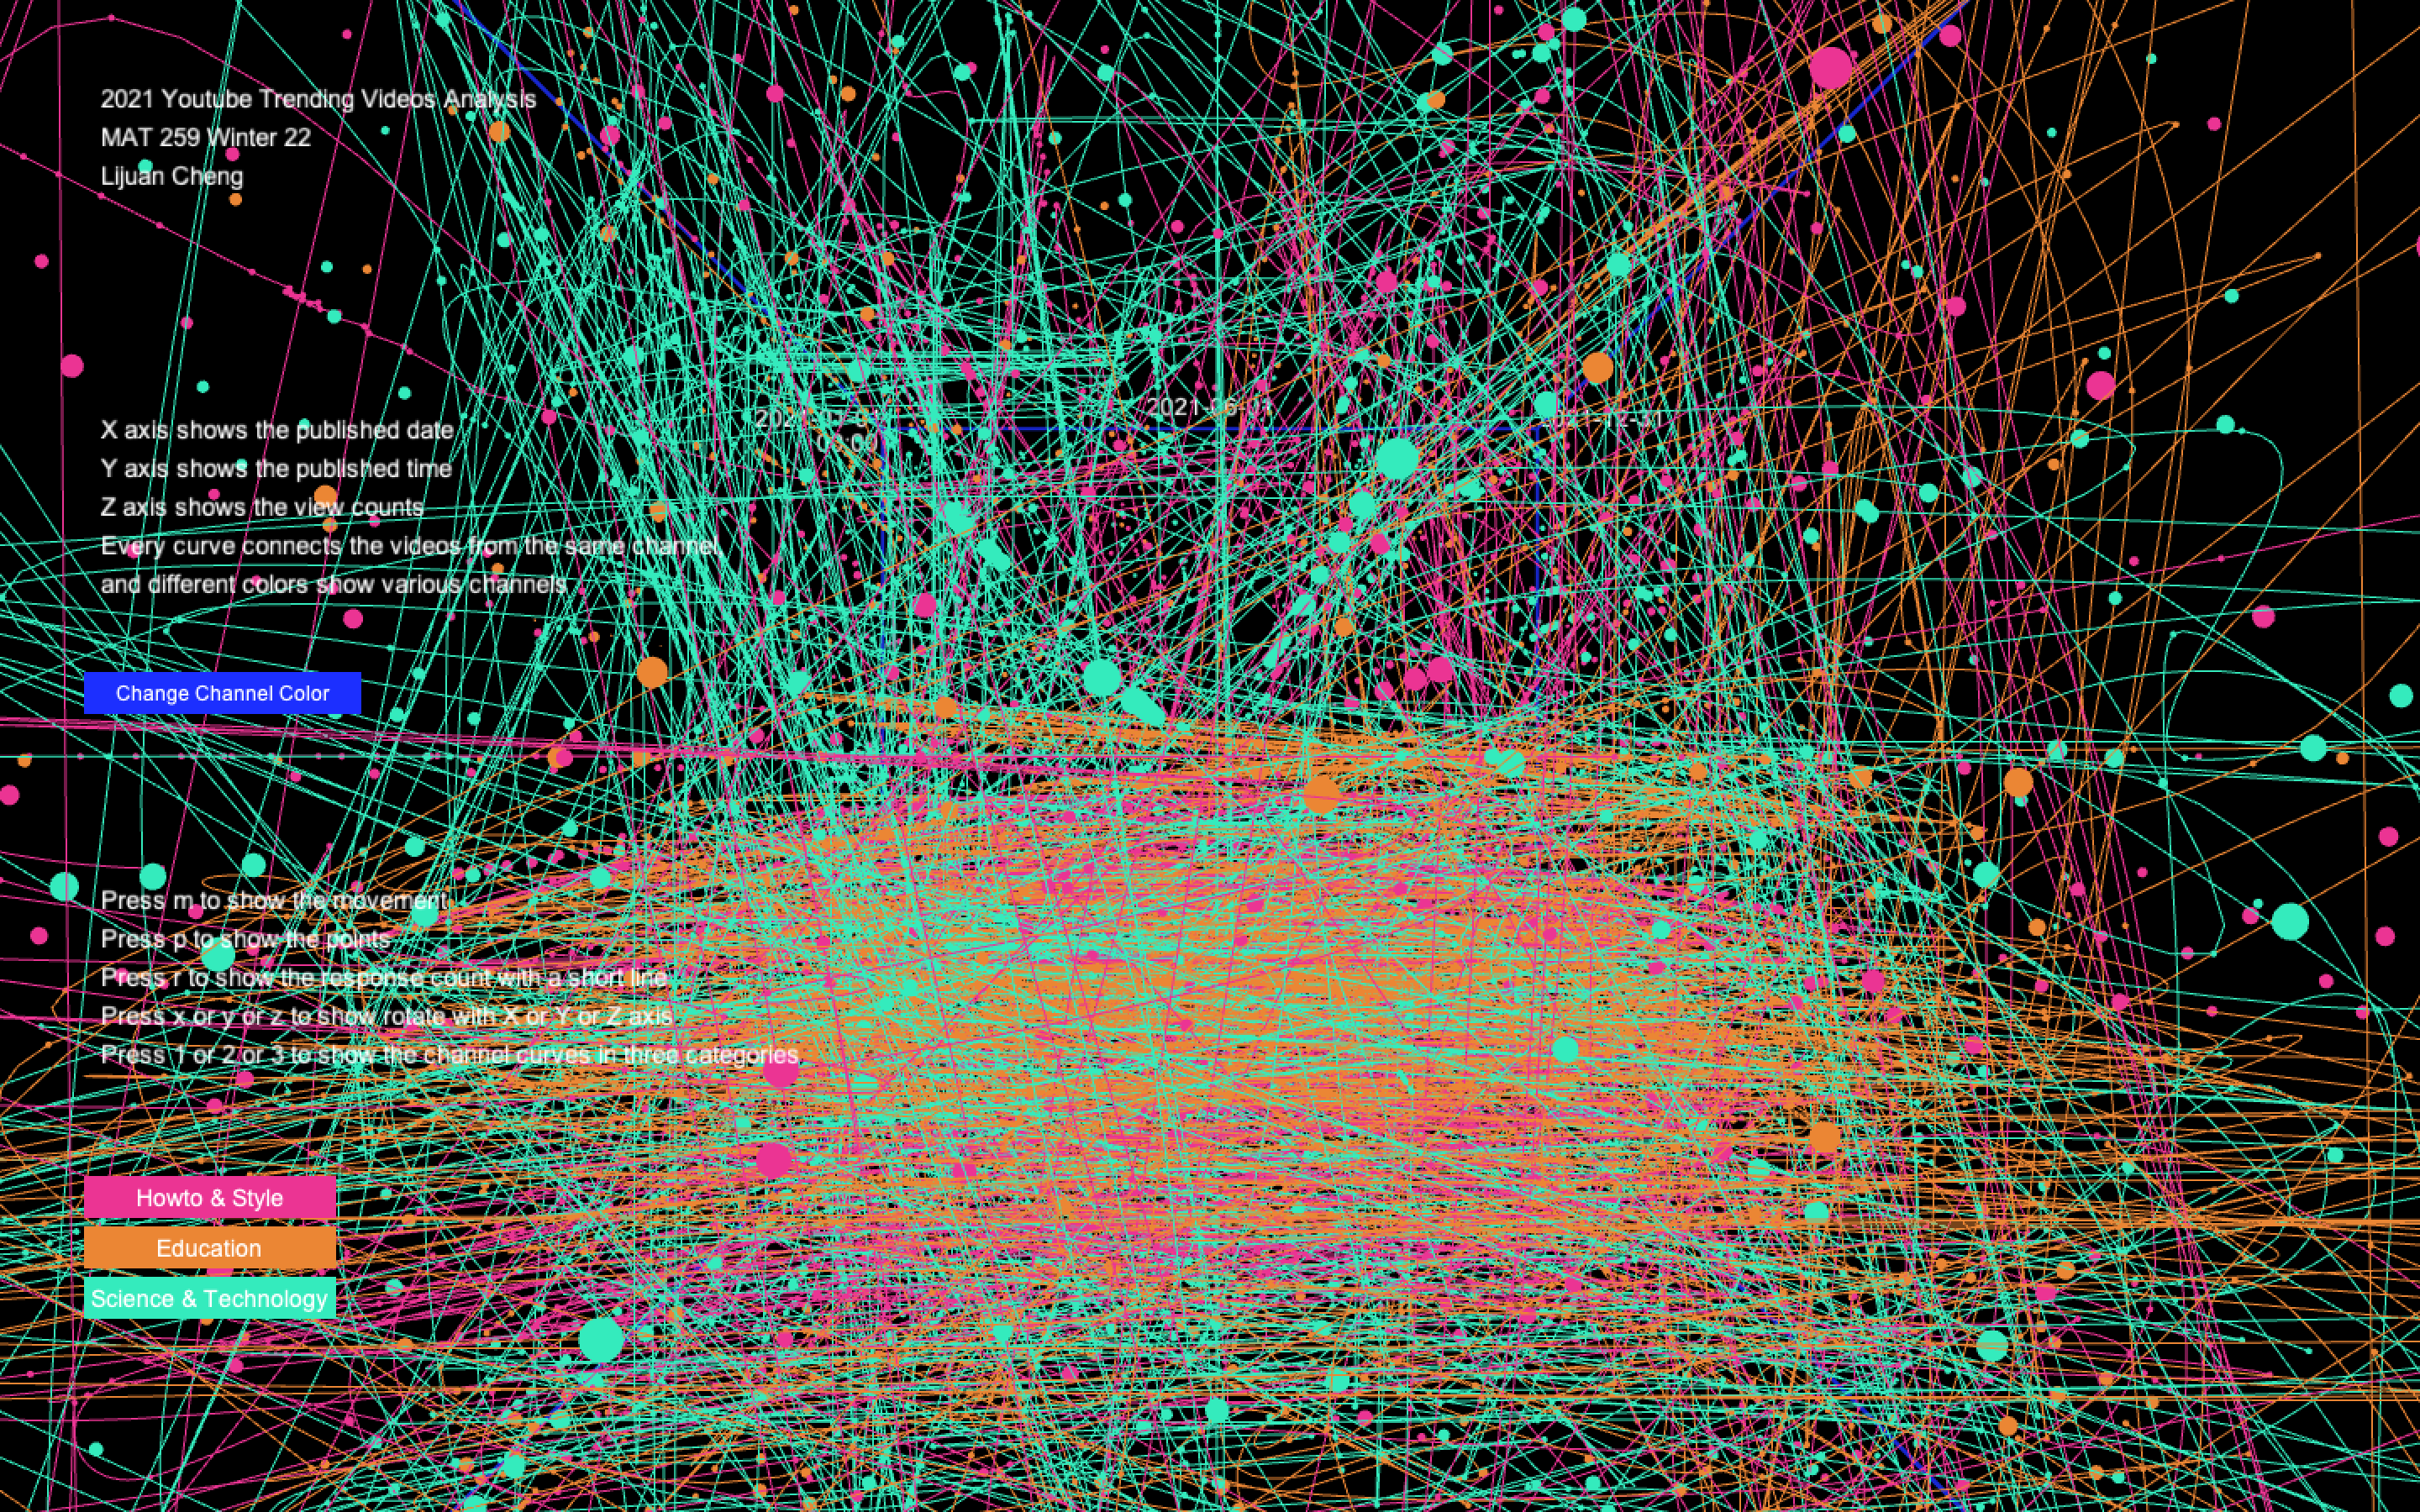
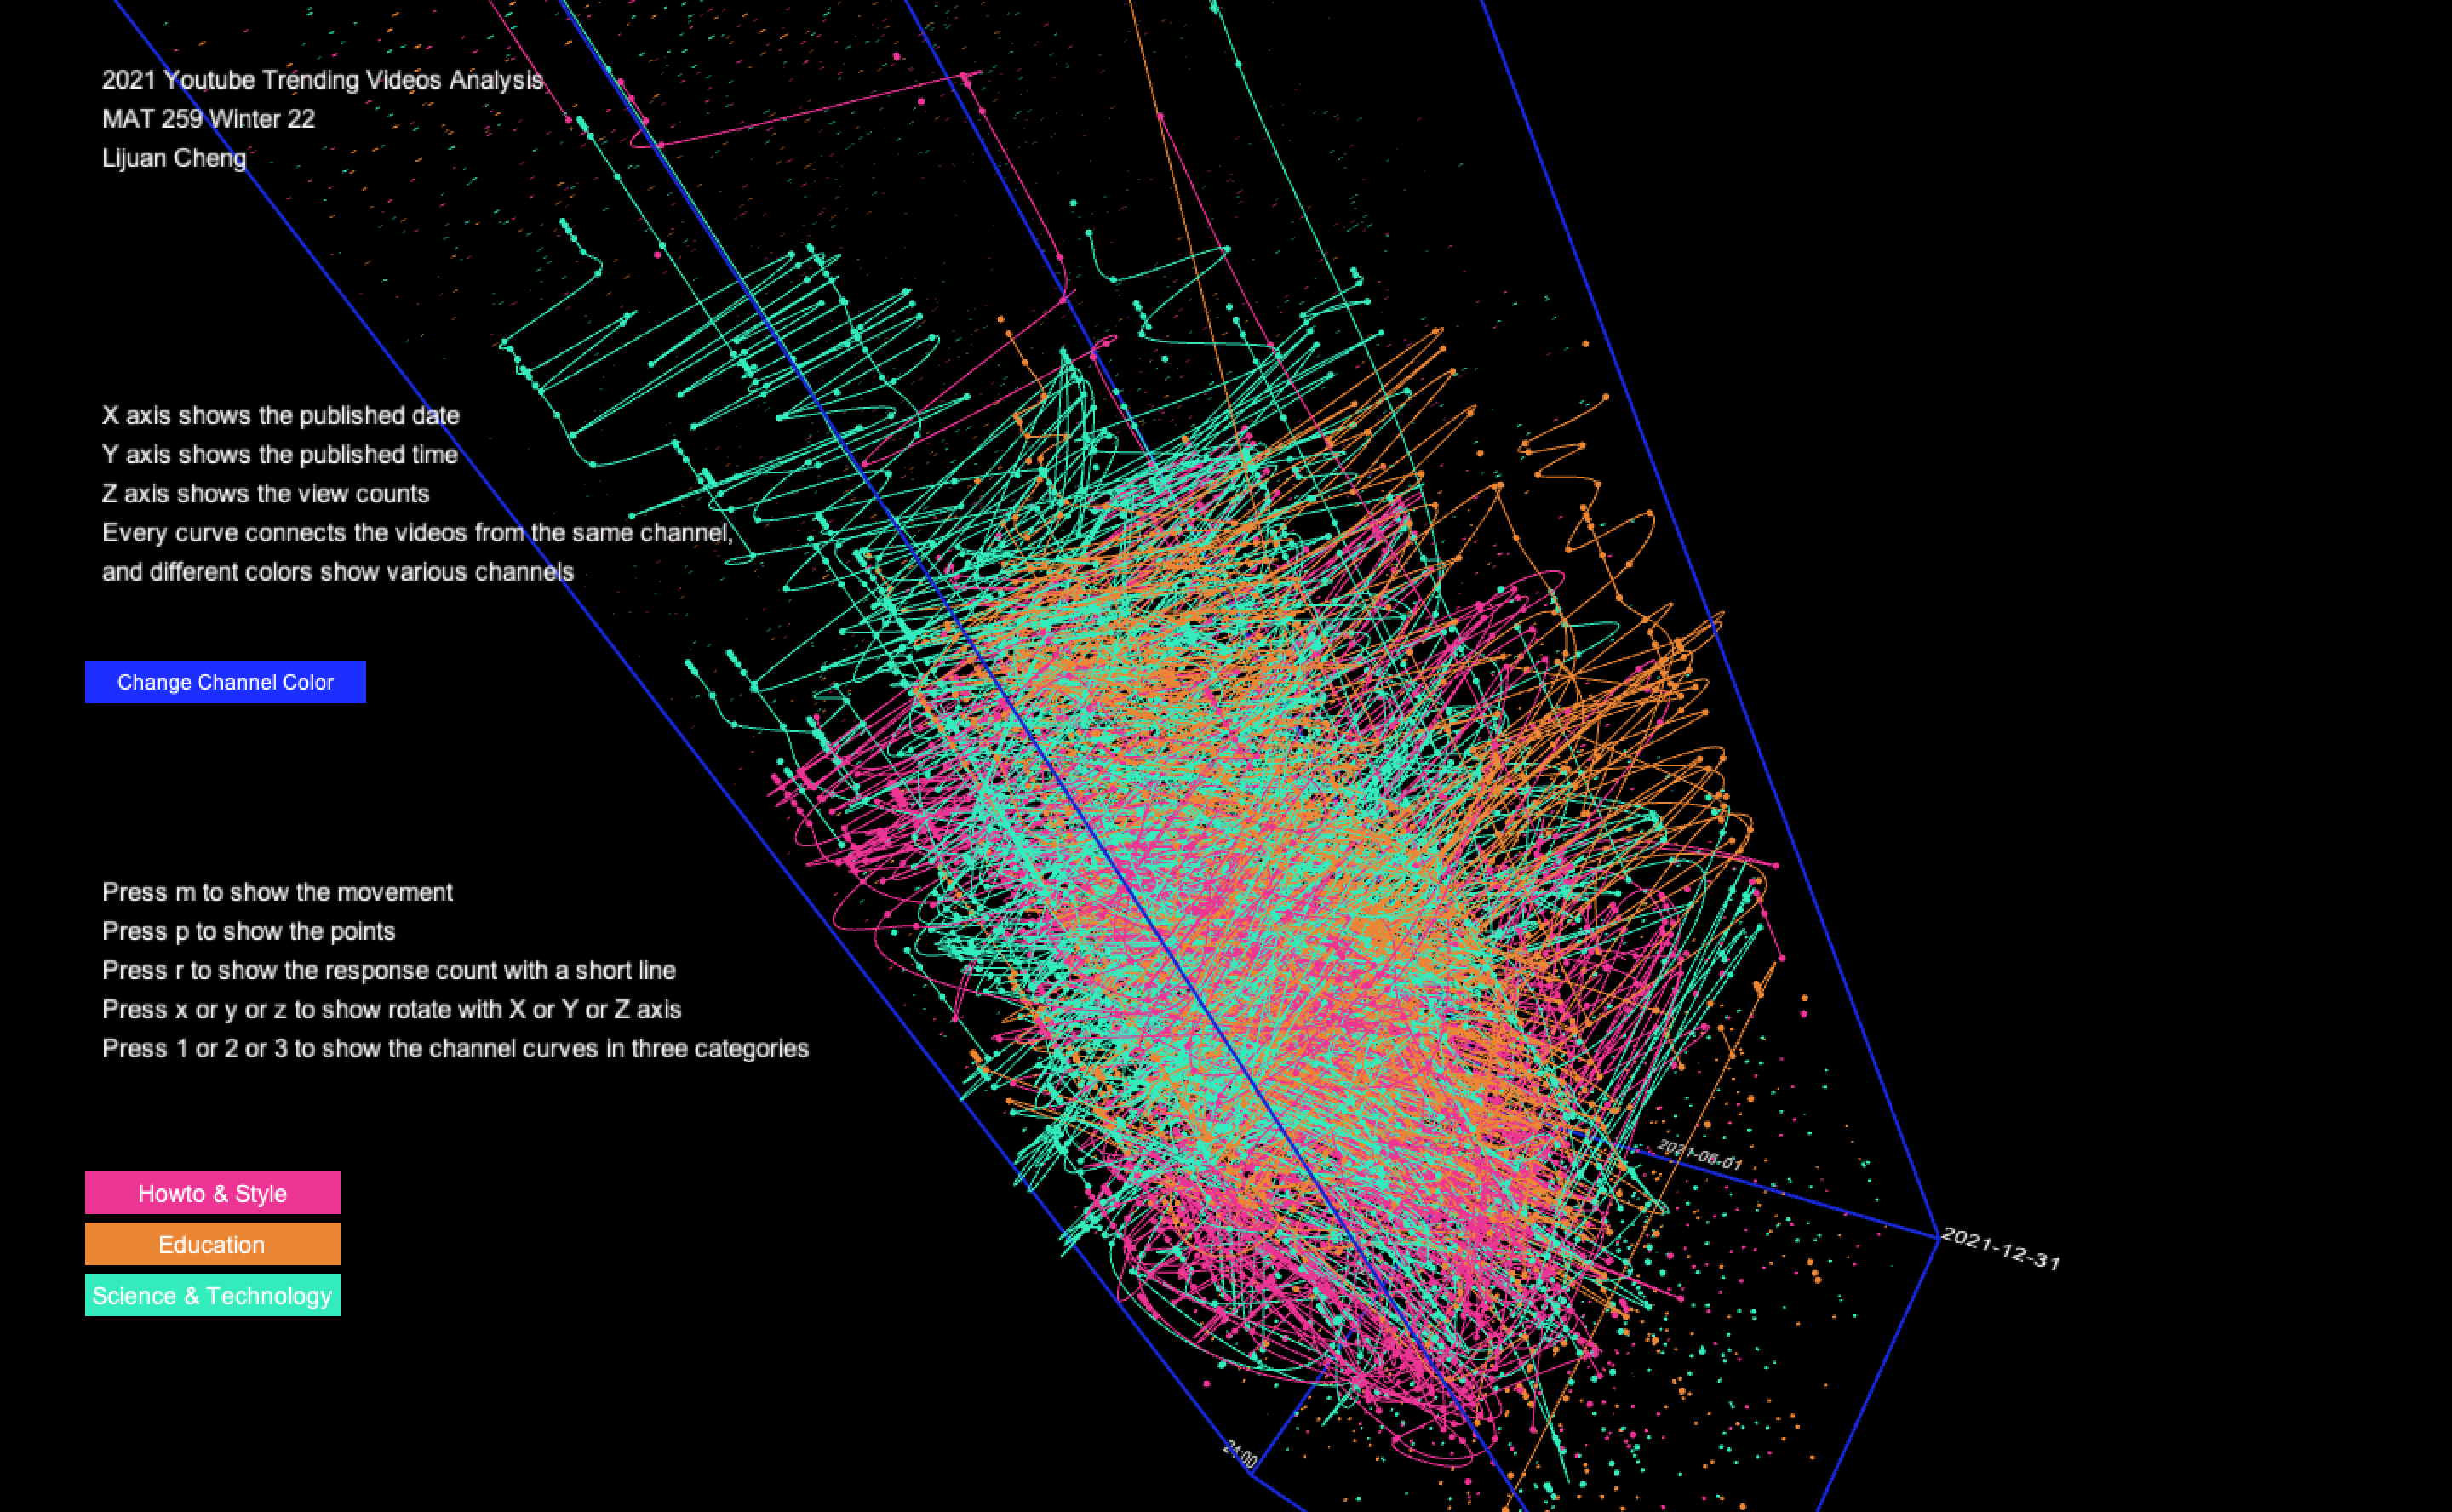
In the final version, I changed the colors representing the three categories. And then I drew the curves connecting all the videos from the same channel. Besides that, I also added the feature to move all the points randomly inside the box. Furthermore, I also added some interactions, such as controlling the show of points, movement, curves etc.
Code