3D Visualization for MoMA Dataset
MAT 259, 2022
Jiaxin Wu
Concept
I got the dataset Museum of Modern Art Collection on Kaggle https://www.kaggle.com/momanyc/museum-collection. The MoMA dataset includes two datasets, the artworks dataset, and the artists dataset. The artworks dataset contains 130,262 records, representing all of the works that have been accessioned into MoMA’s collection and cataloged in our database. It includes basic metadata for each work, including title, artist, date, medium, dimensions, and date acquired by the Museum. The artists dataset contains 15,091 records, representing all the artists who have work in MoMA's collection and have been cataloged in our database. It includes basic metadata for each artist, including name, nationality, gender, birth year, and death year.
I merged the two datasets and did some basic data preprocessing for them. And then I use labelencoder to map strings in data to integers. After that, I use the TSNE algorithm https://scikit-learn.org/stable/modules/generated/sklearn.manifold.TSNE.html to reduce the dimension of the data to 3D. I use TSNE to calculate the x, y, z coordinates of each artwork and artist.
Final result
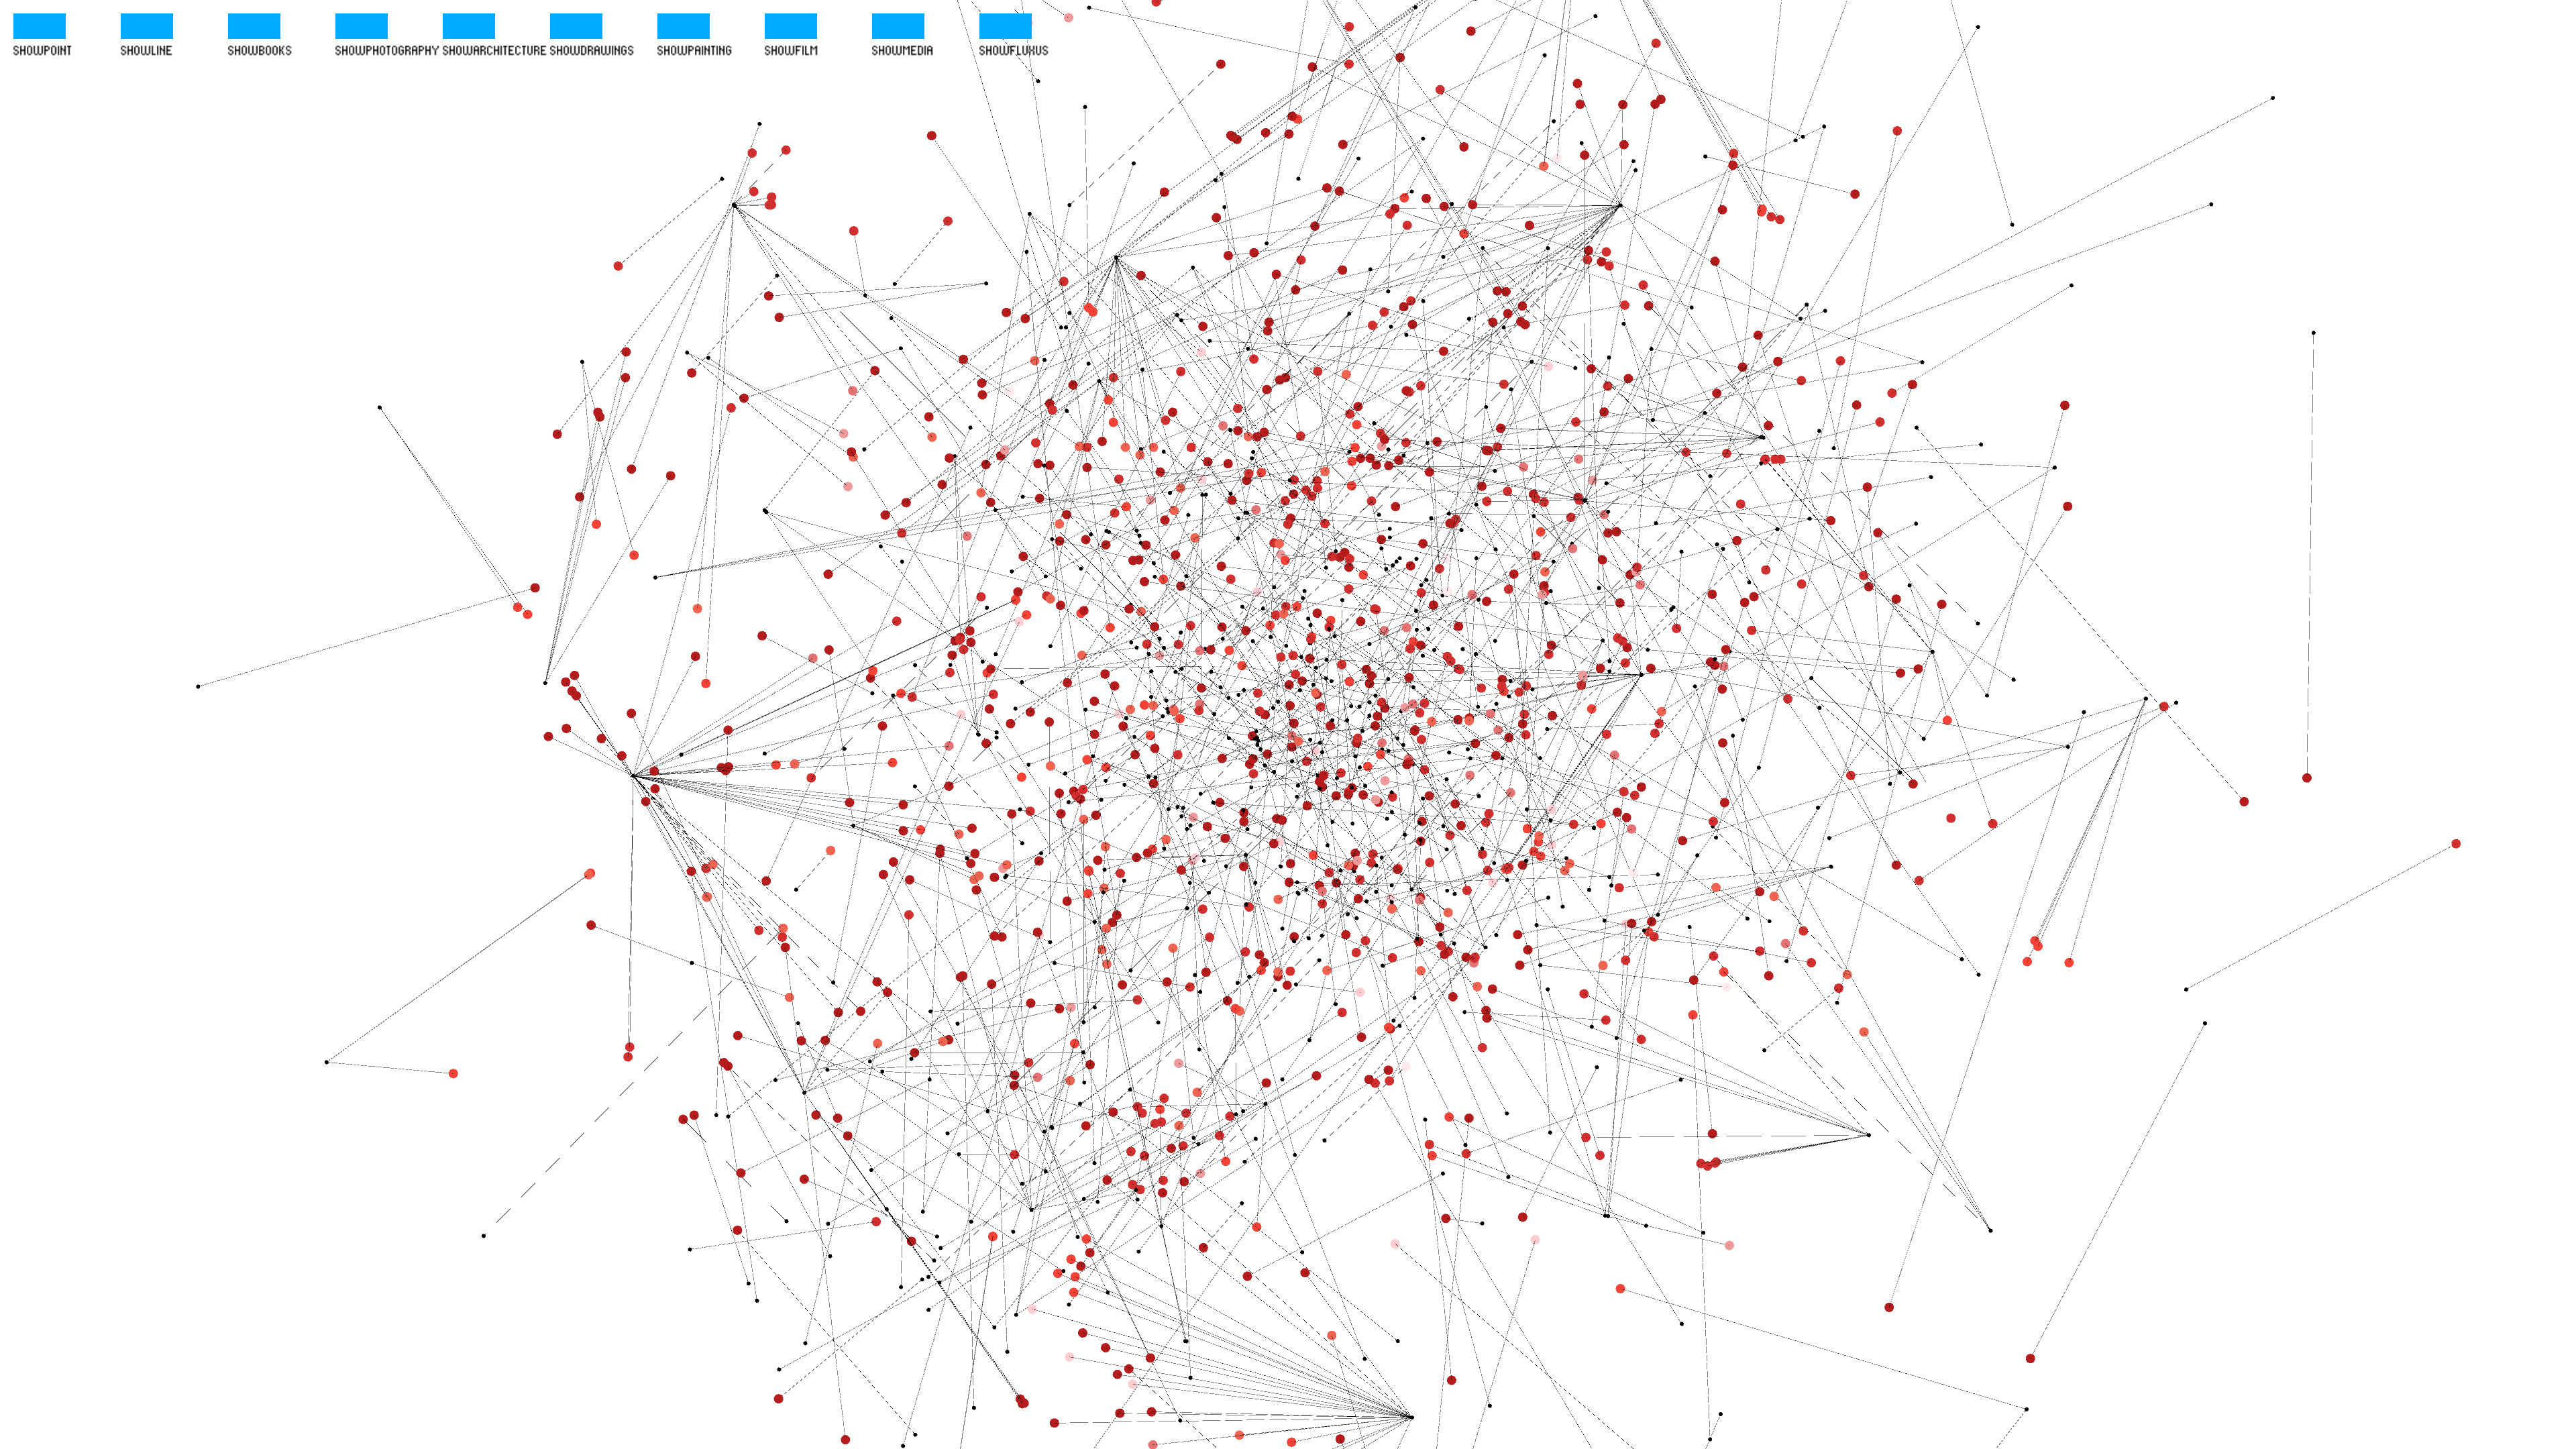
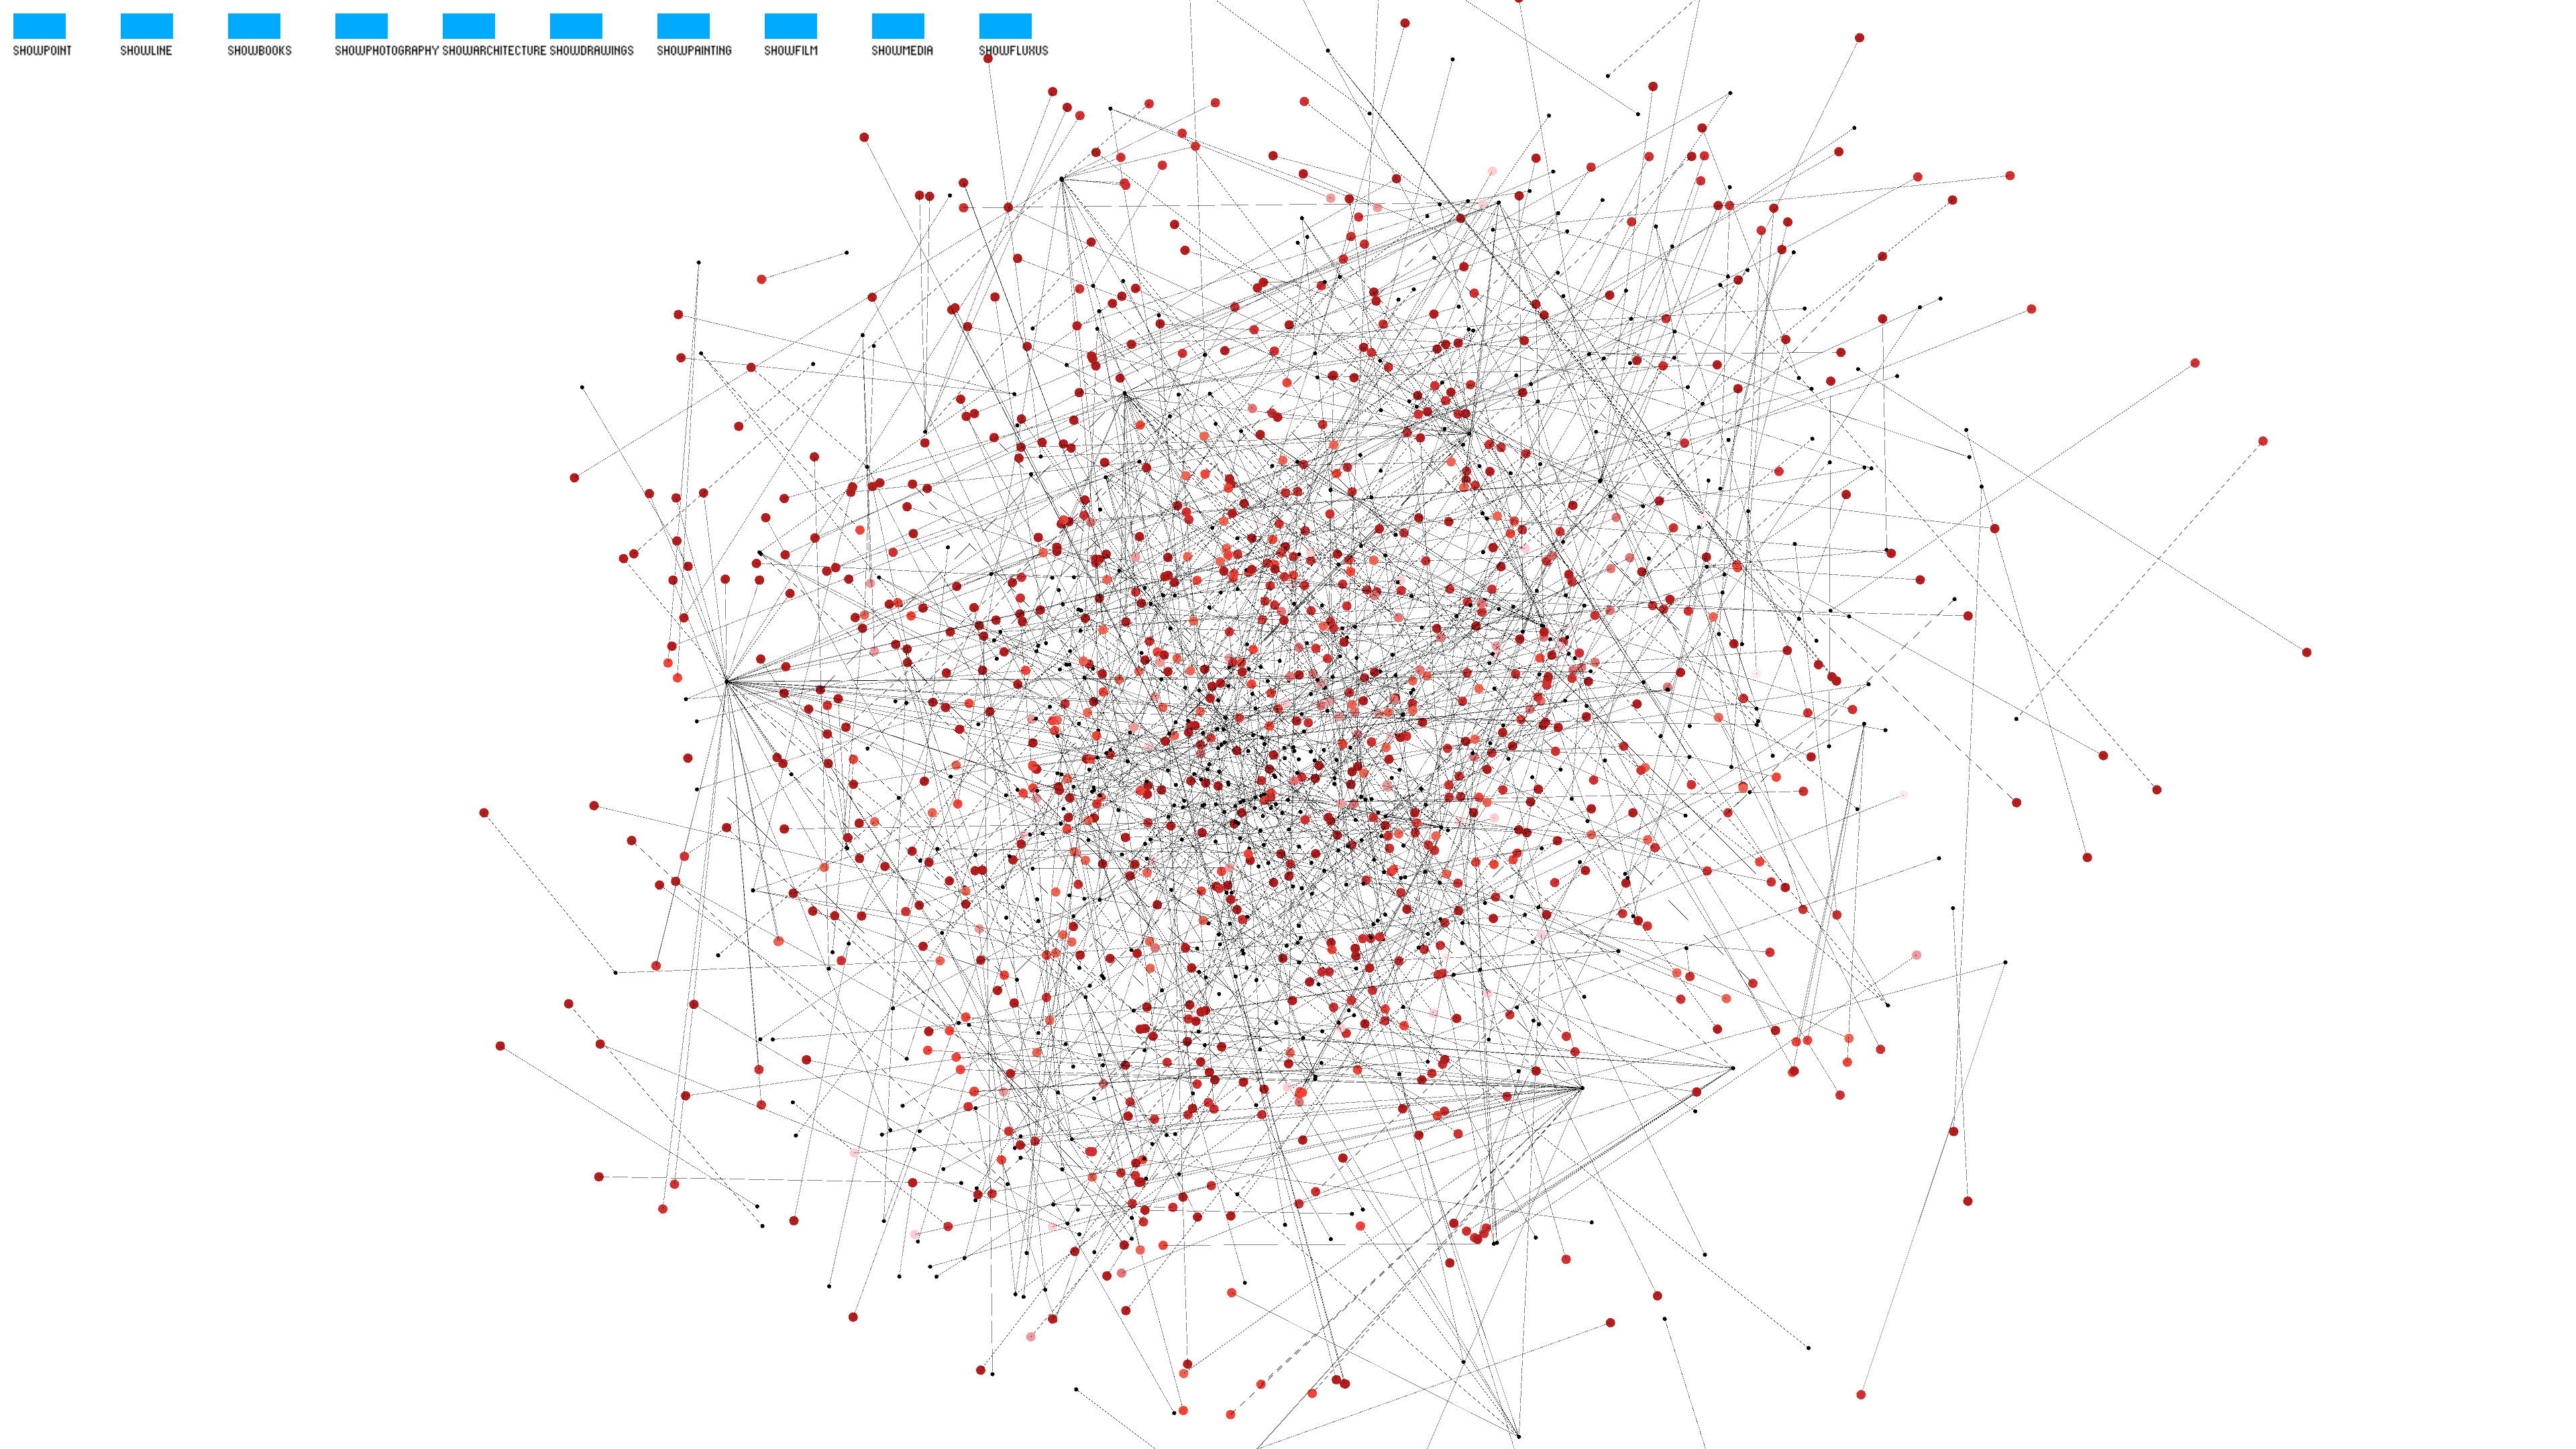
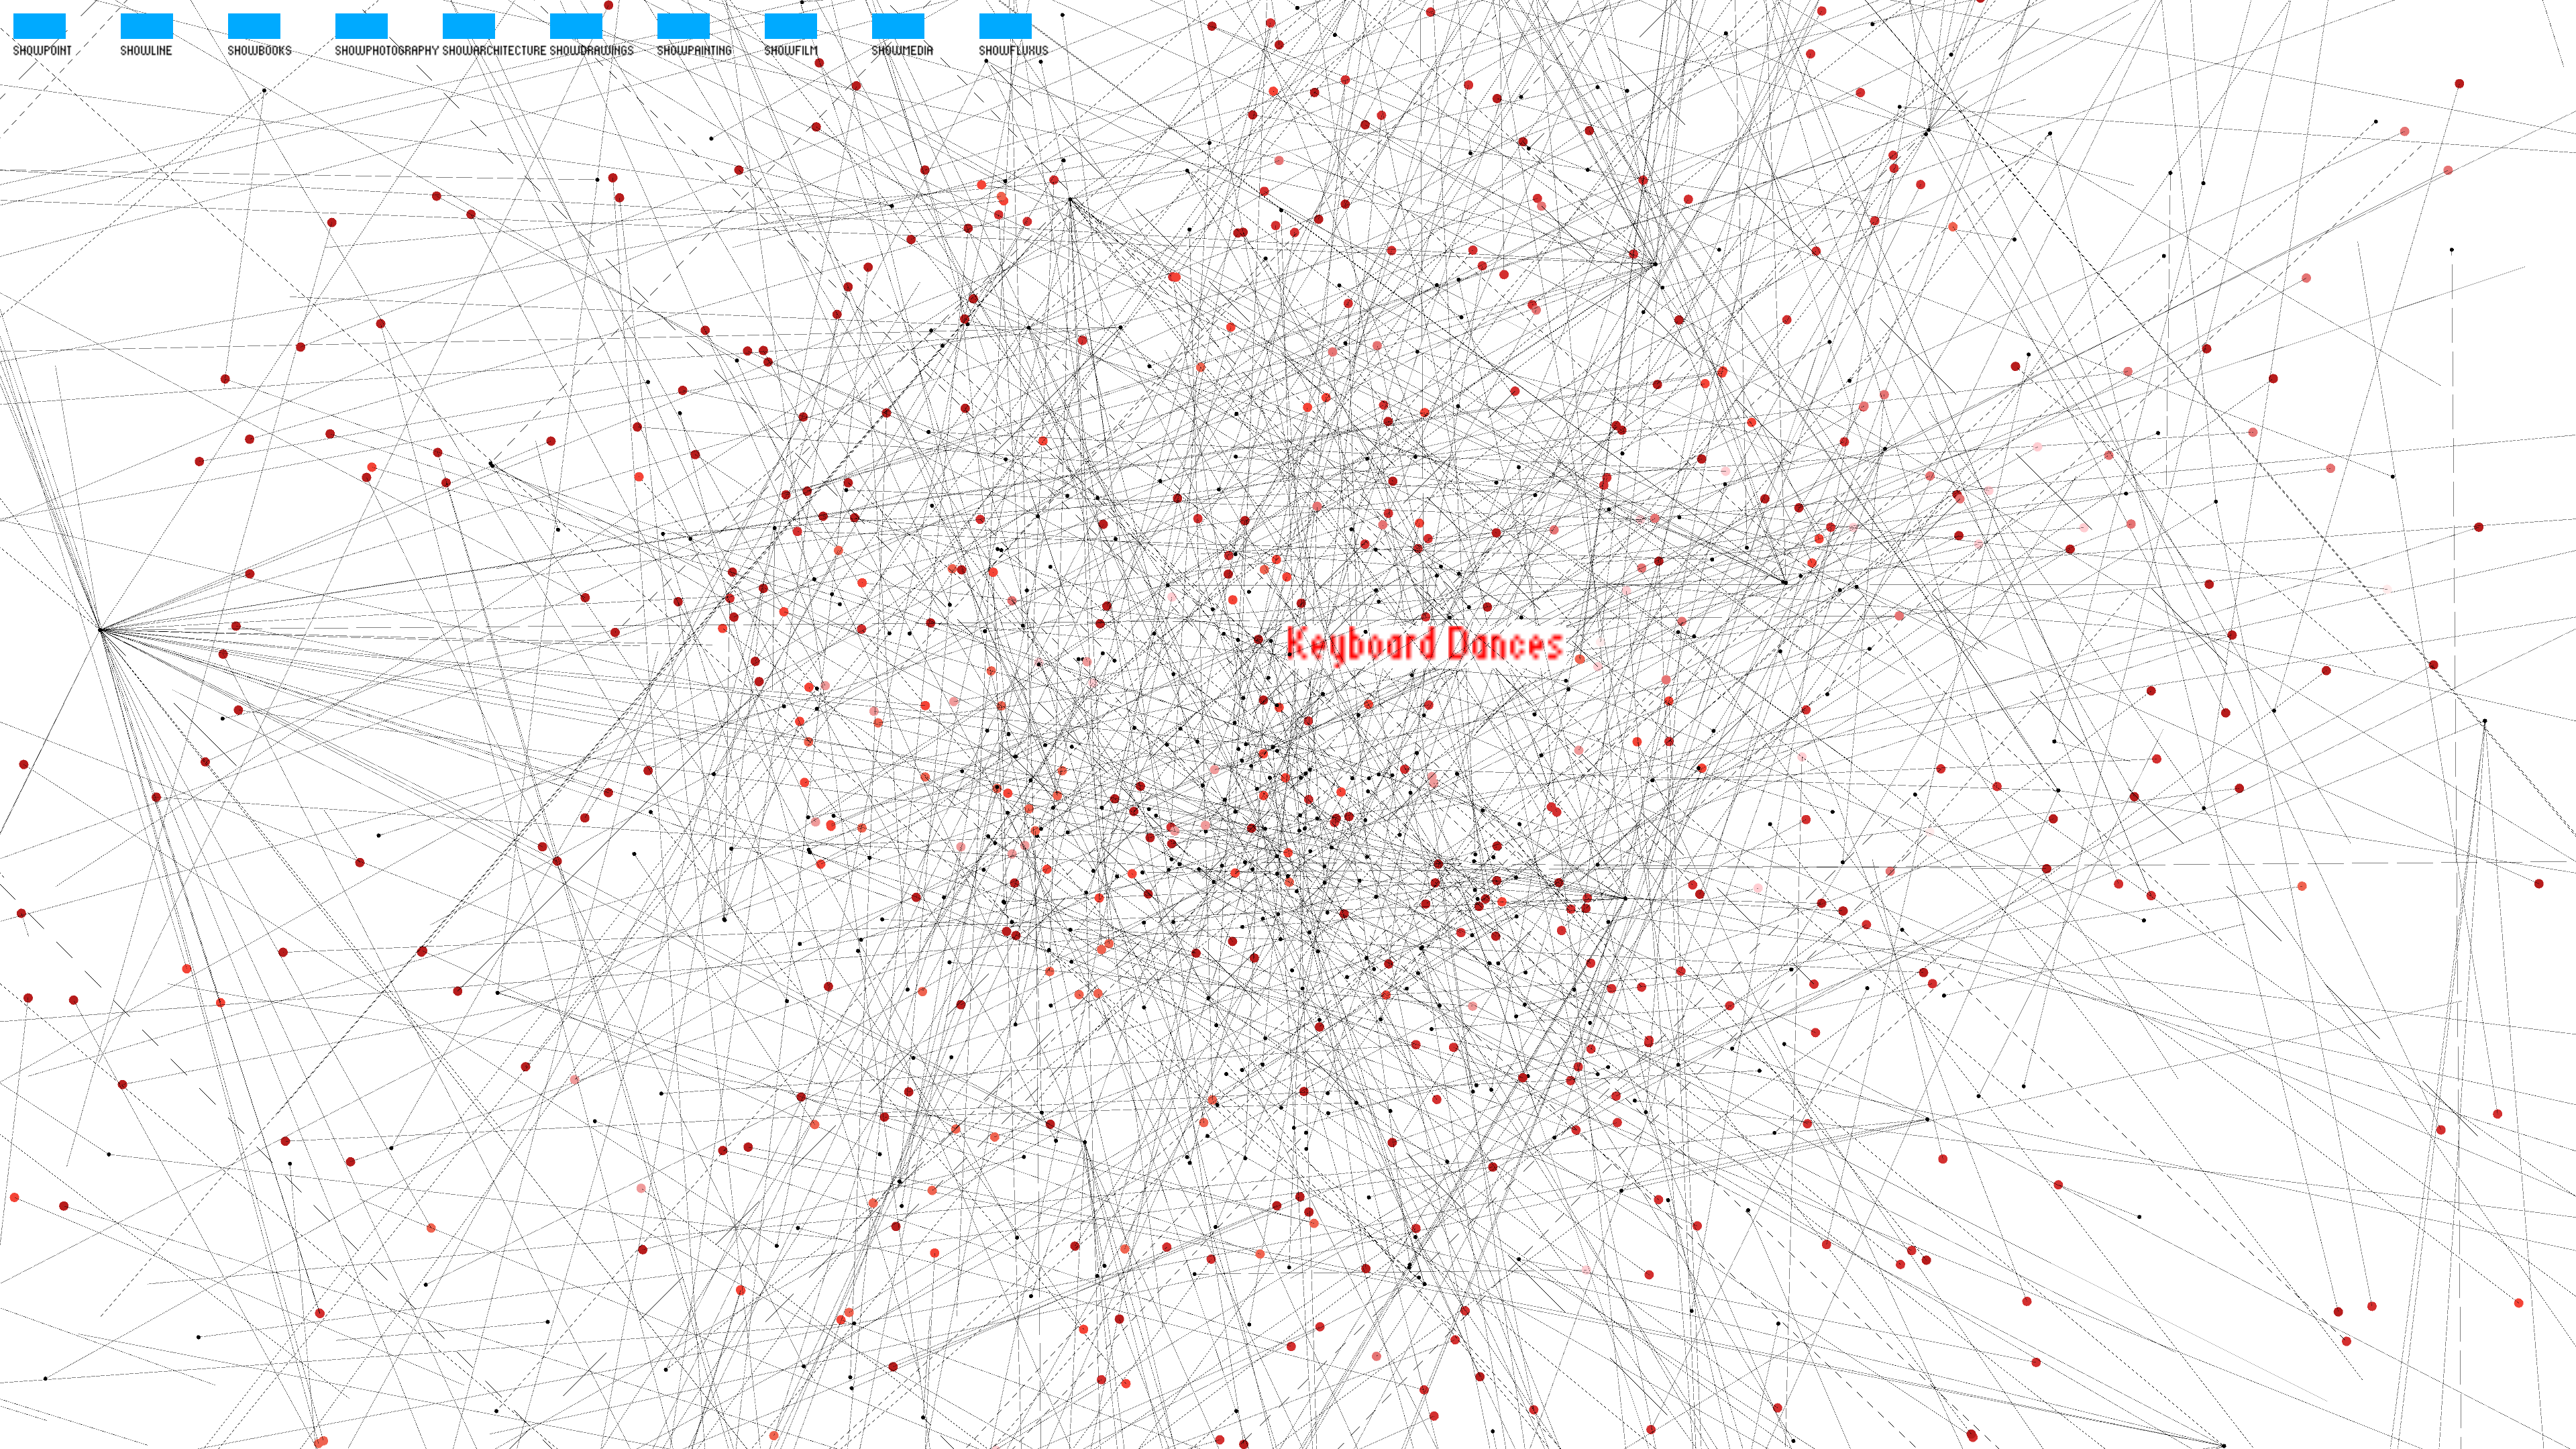
Then I link the coordinates of each artwork and artist. The black points represent artists and the red points represent artworks. Specifically, I use different kinds of red to represent artworks from different departments. I visualize the movement of each artwork to show how it was created by the artist.
Code