Checkouts and Tesla Stock Price
MAT 259, 2022
Senyuan(Russell) Liu
Concept
My project 2 is focused on visualizing the correlation between Tesla's Stock Price (from 2011 to 2021) and Checkouts from Seatle Public Library in 3D, realizing in Processing. By doing so, I would like to find out if people are borrowing more/less related books as Tesla's Stock Price increases/decreases in a time period. I only fetched the stock data started in 2011 because it wasn't a public company via IPO on NASDAQ until 2010 June, and thus fetching checkouts data starting in 2011.
Query1
select *
from spl_2016.outraw
where (
LOWER(title) like '% Elon Musk %'
or LOWER(title) like '% Tesla %'
or LOWER(title) like '% Panasonic %'
or LOWER(title) like '% Lithium Iron Phosphate %'
or LOWER(title) like '% Battery %'
or LOWER(title) like '% stock %'
or LOWER(title) like '% stock market %'
or LOWER(title) like '% investment %'
)AND YEAR(cout) BETWEEN 2010 AND 2021
Query2
SELECT YEAR
( cout ),
title,
COUNT( 1 ) 'checkouts'
FROM
spl_2016.outraw
WHERE
( INSTR( title, 'stock market' )> 0 OR INSTR( title, 'Tesla' )> 0 OR INSTR( title, 'Elon Musk' )> 0 OR
INSTR( title, 'investment' )> 0 OR INSTR( title, 'Battery' )> 0 OR INSTR( title, 'stock' )> 0)
AND YEAR ( cout ) BETWEEN 2010
AND 2021
GROUP BY
YEAR ( cout ),
title
Preliminary sketches
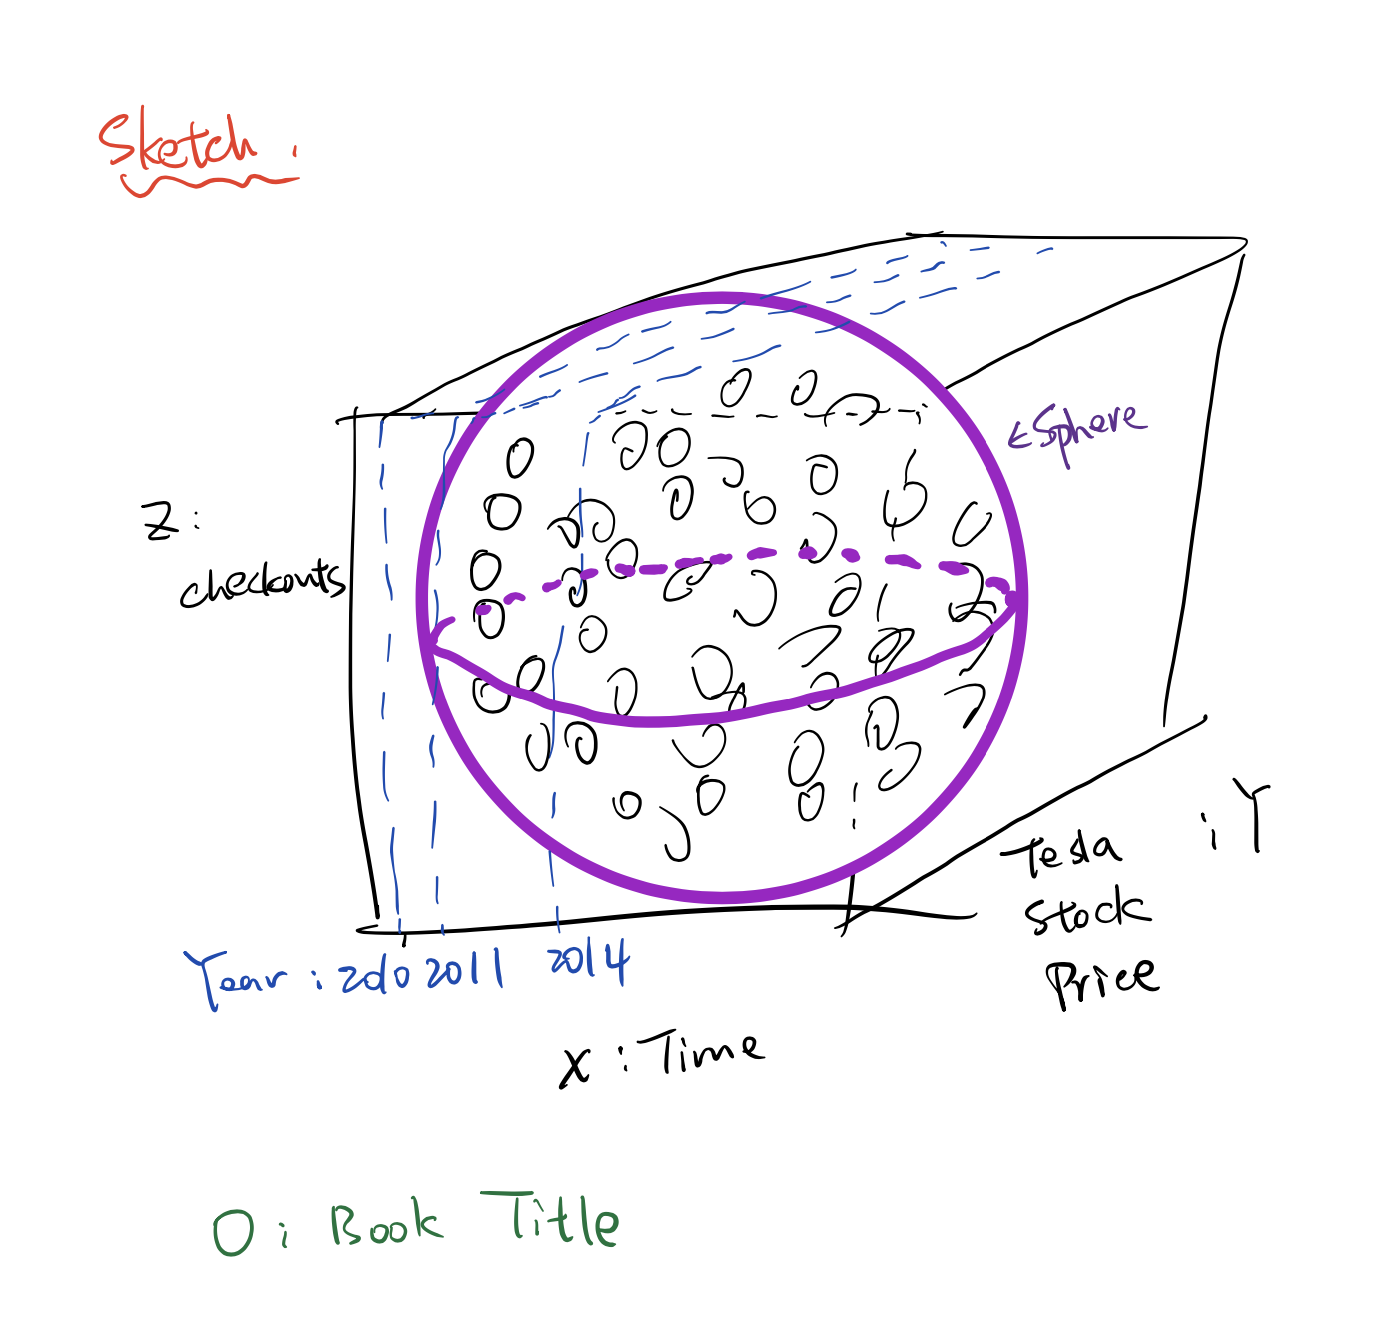
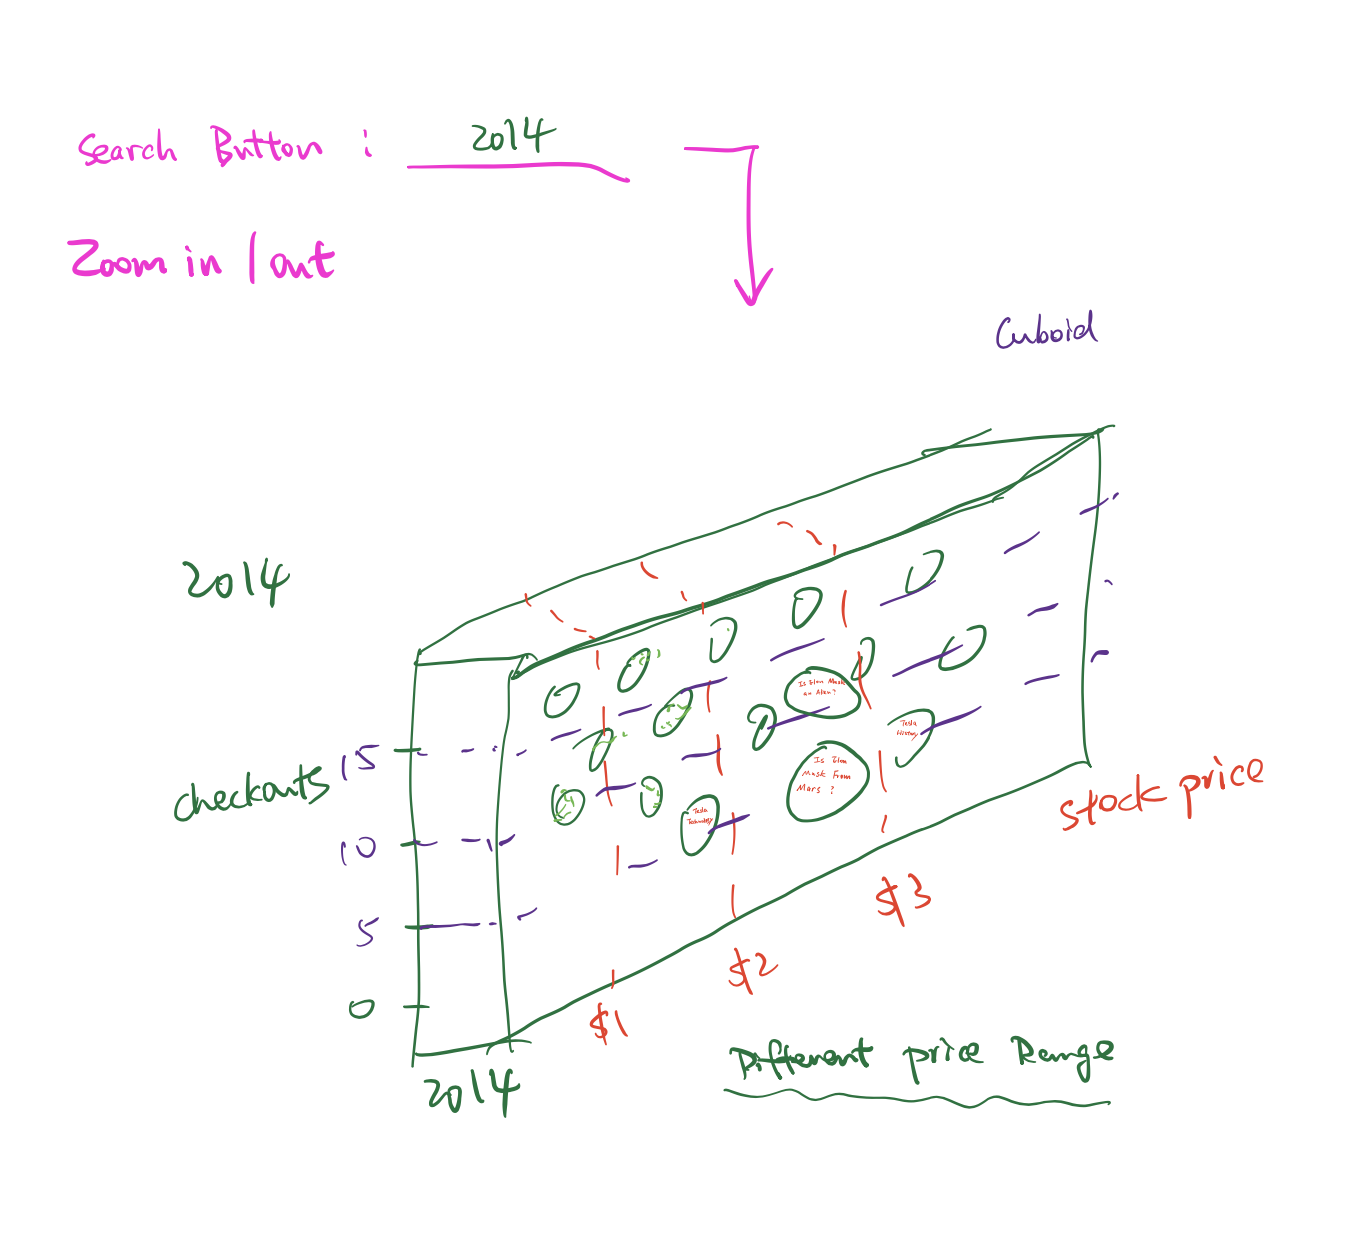
Process
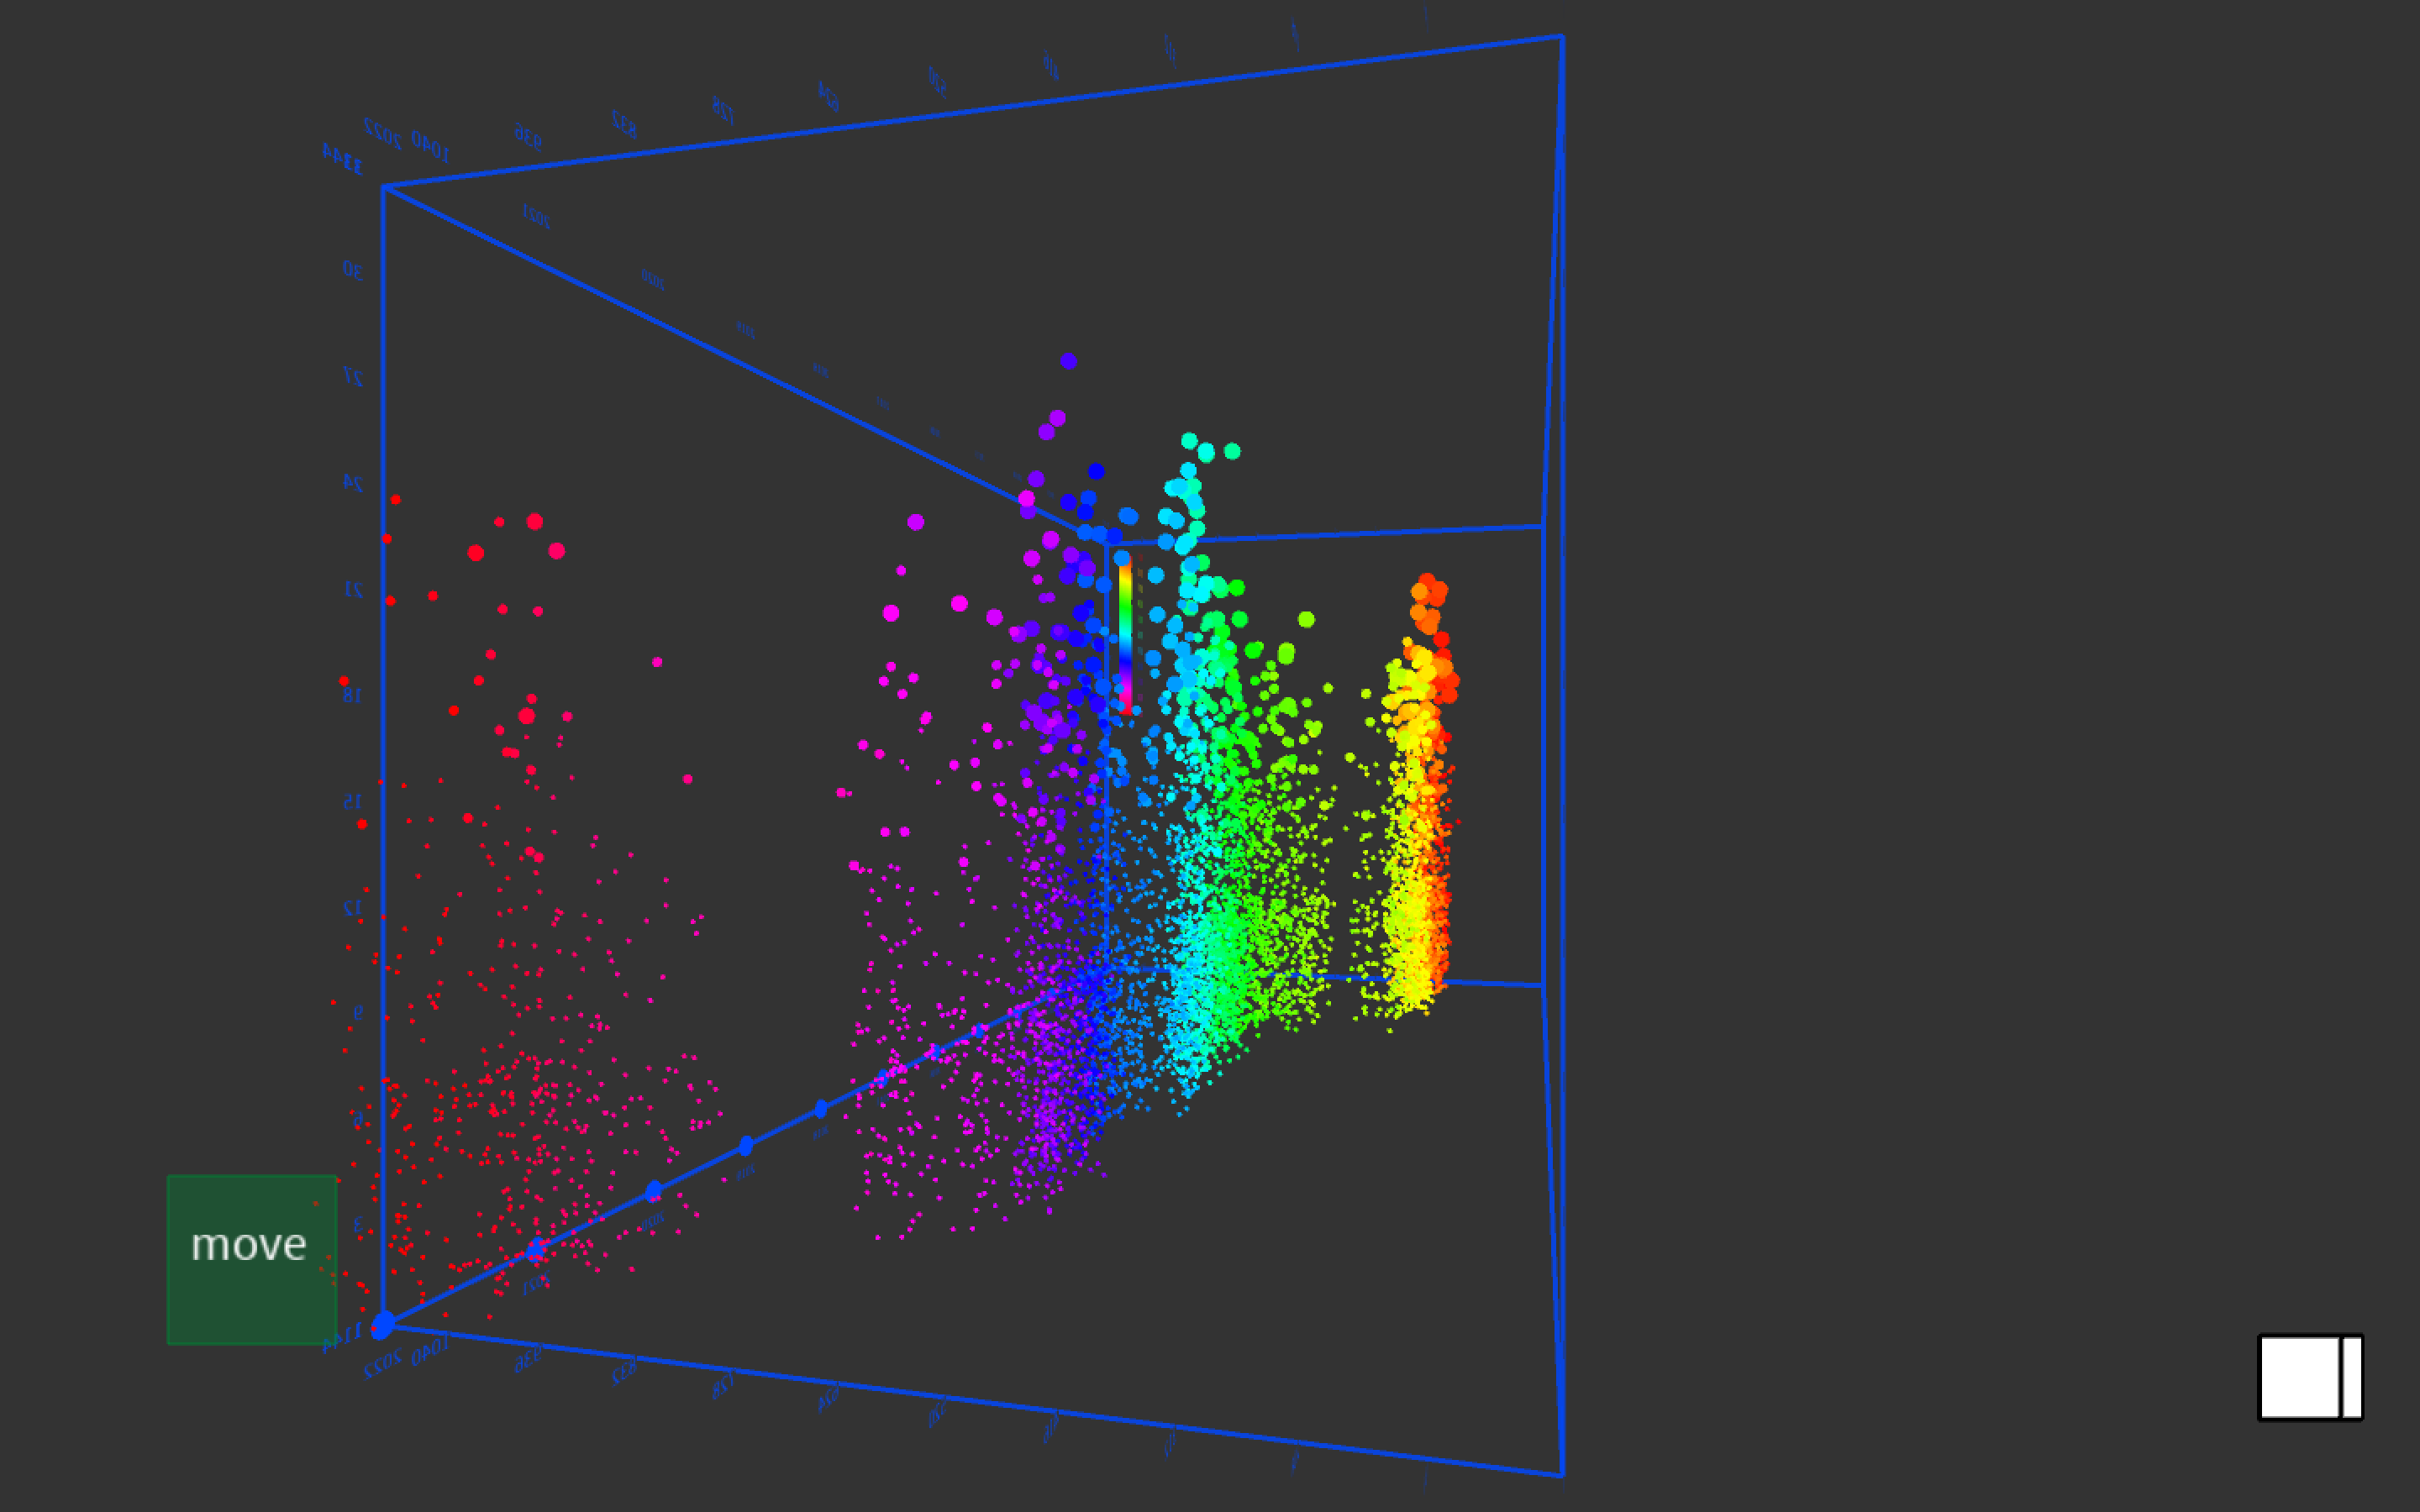
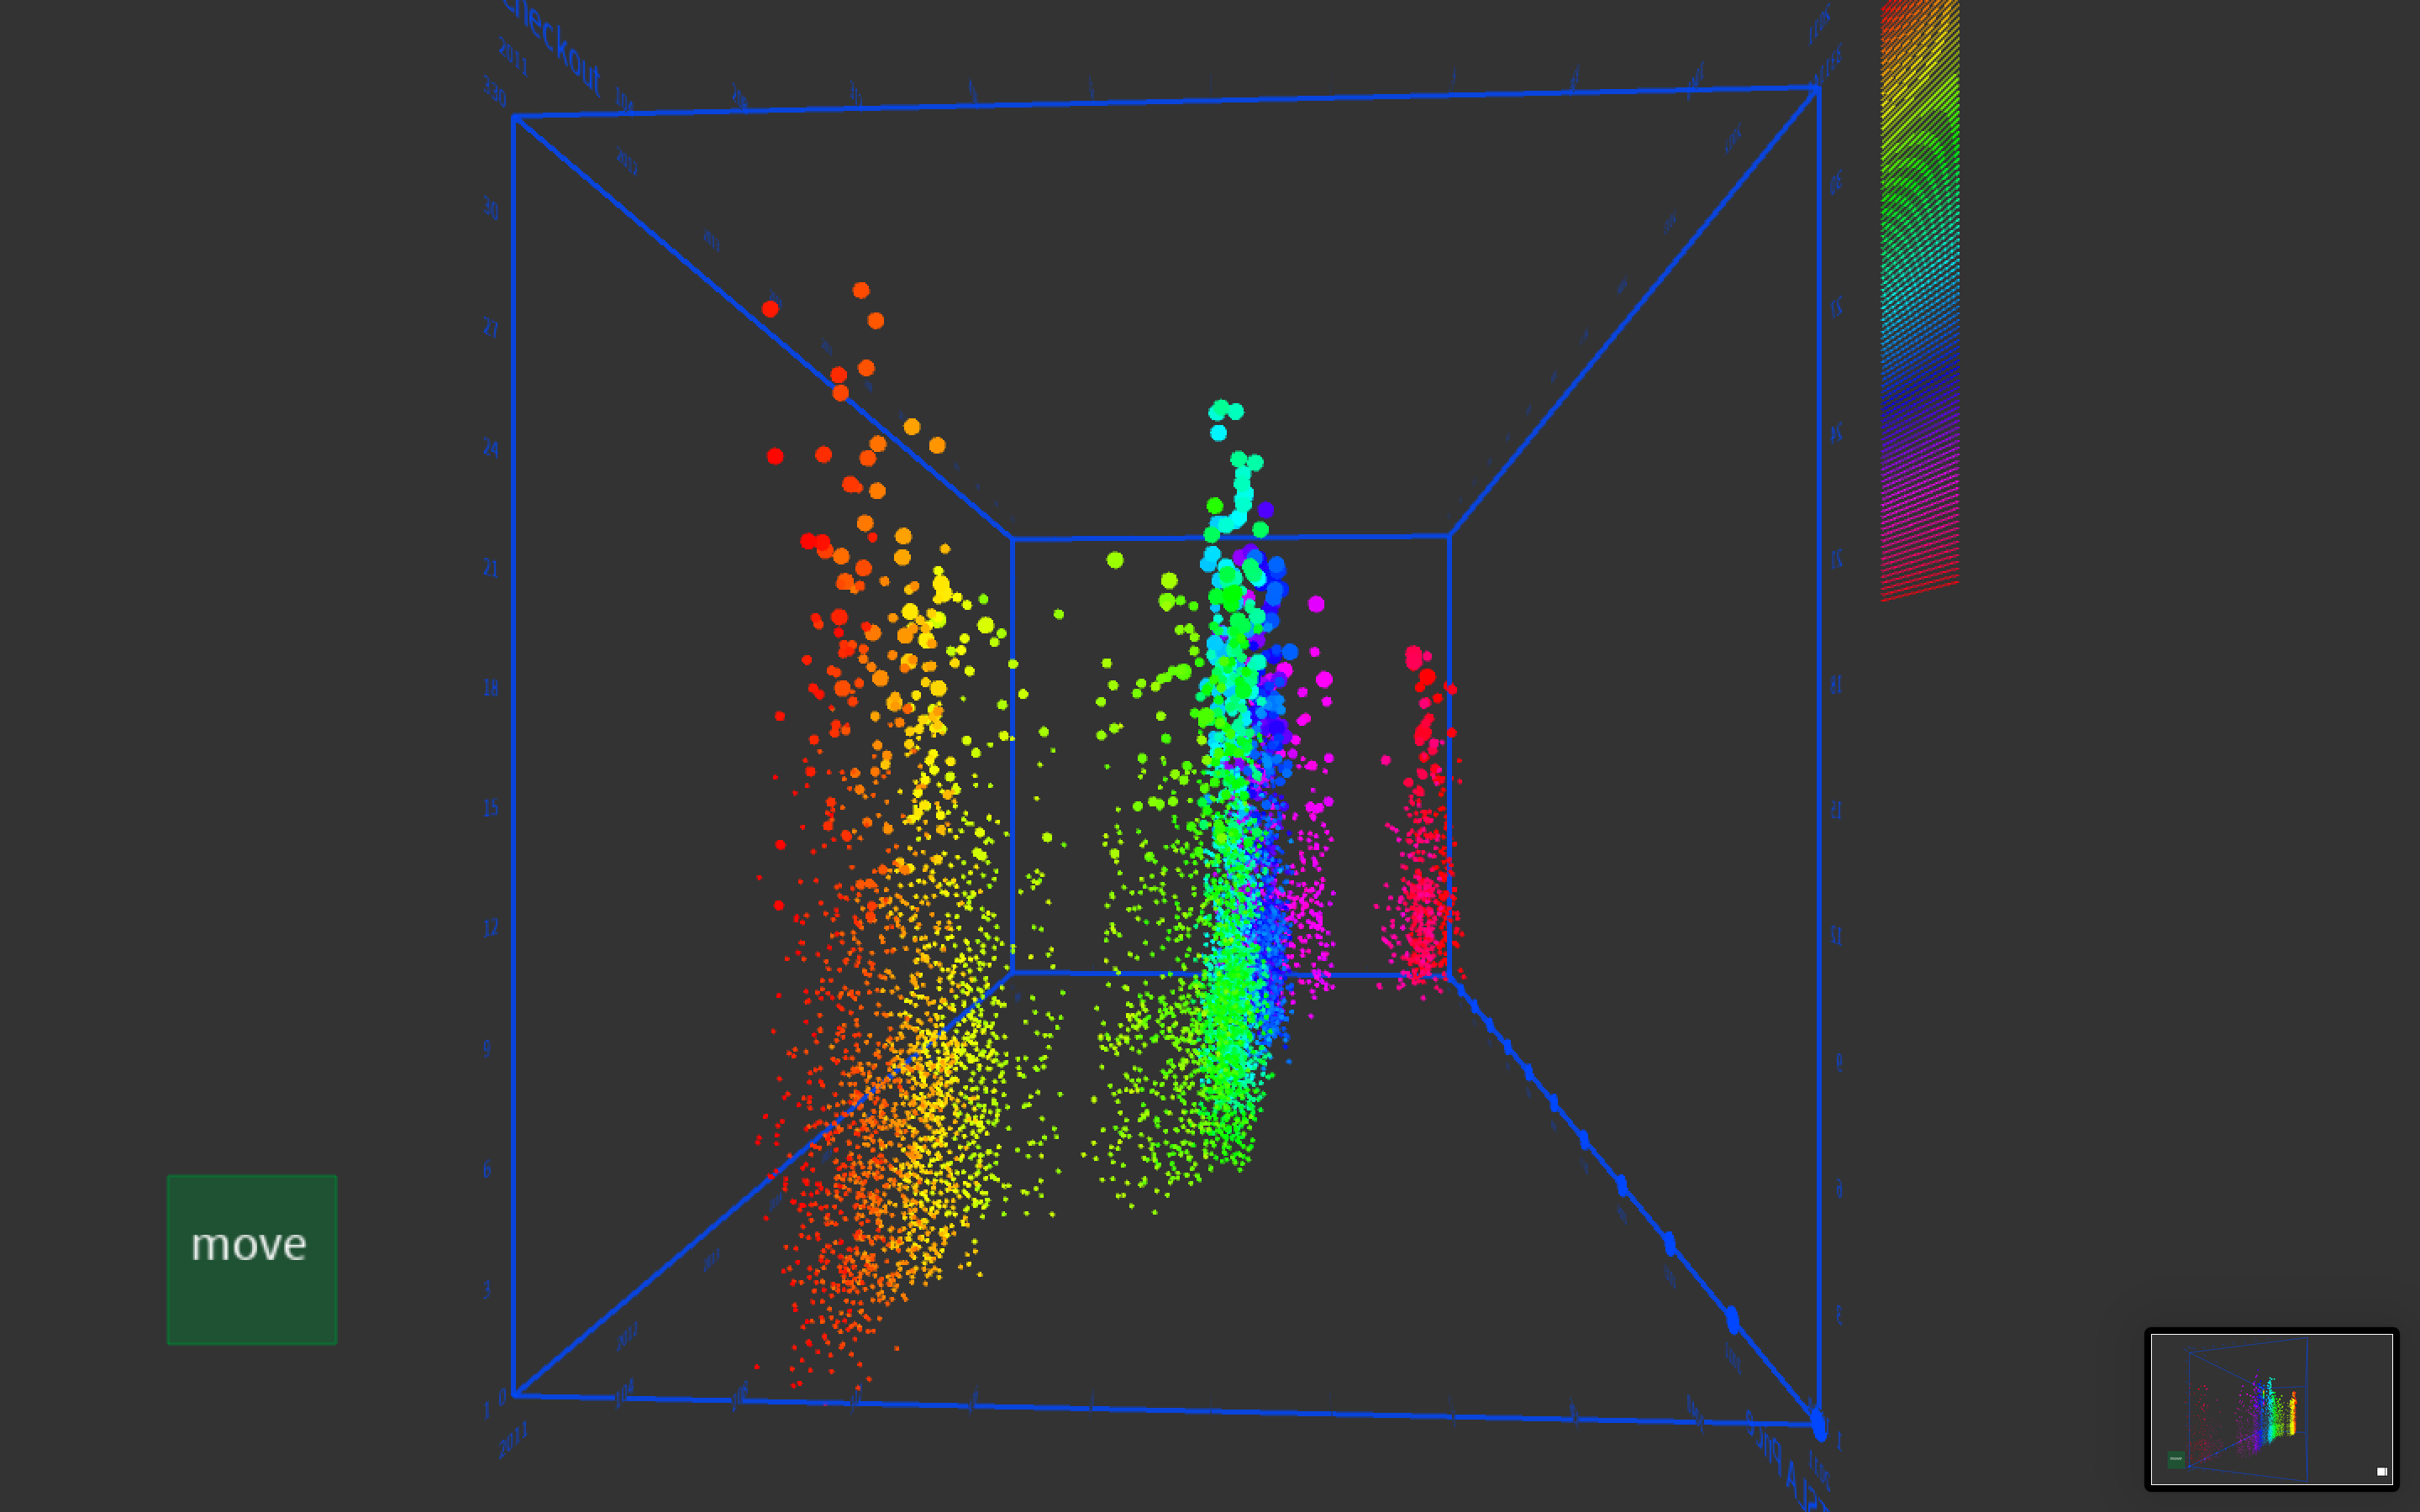
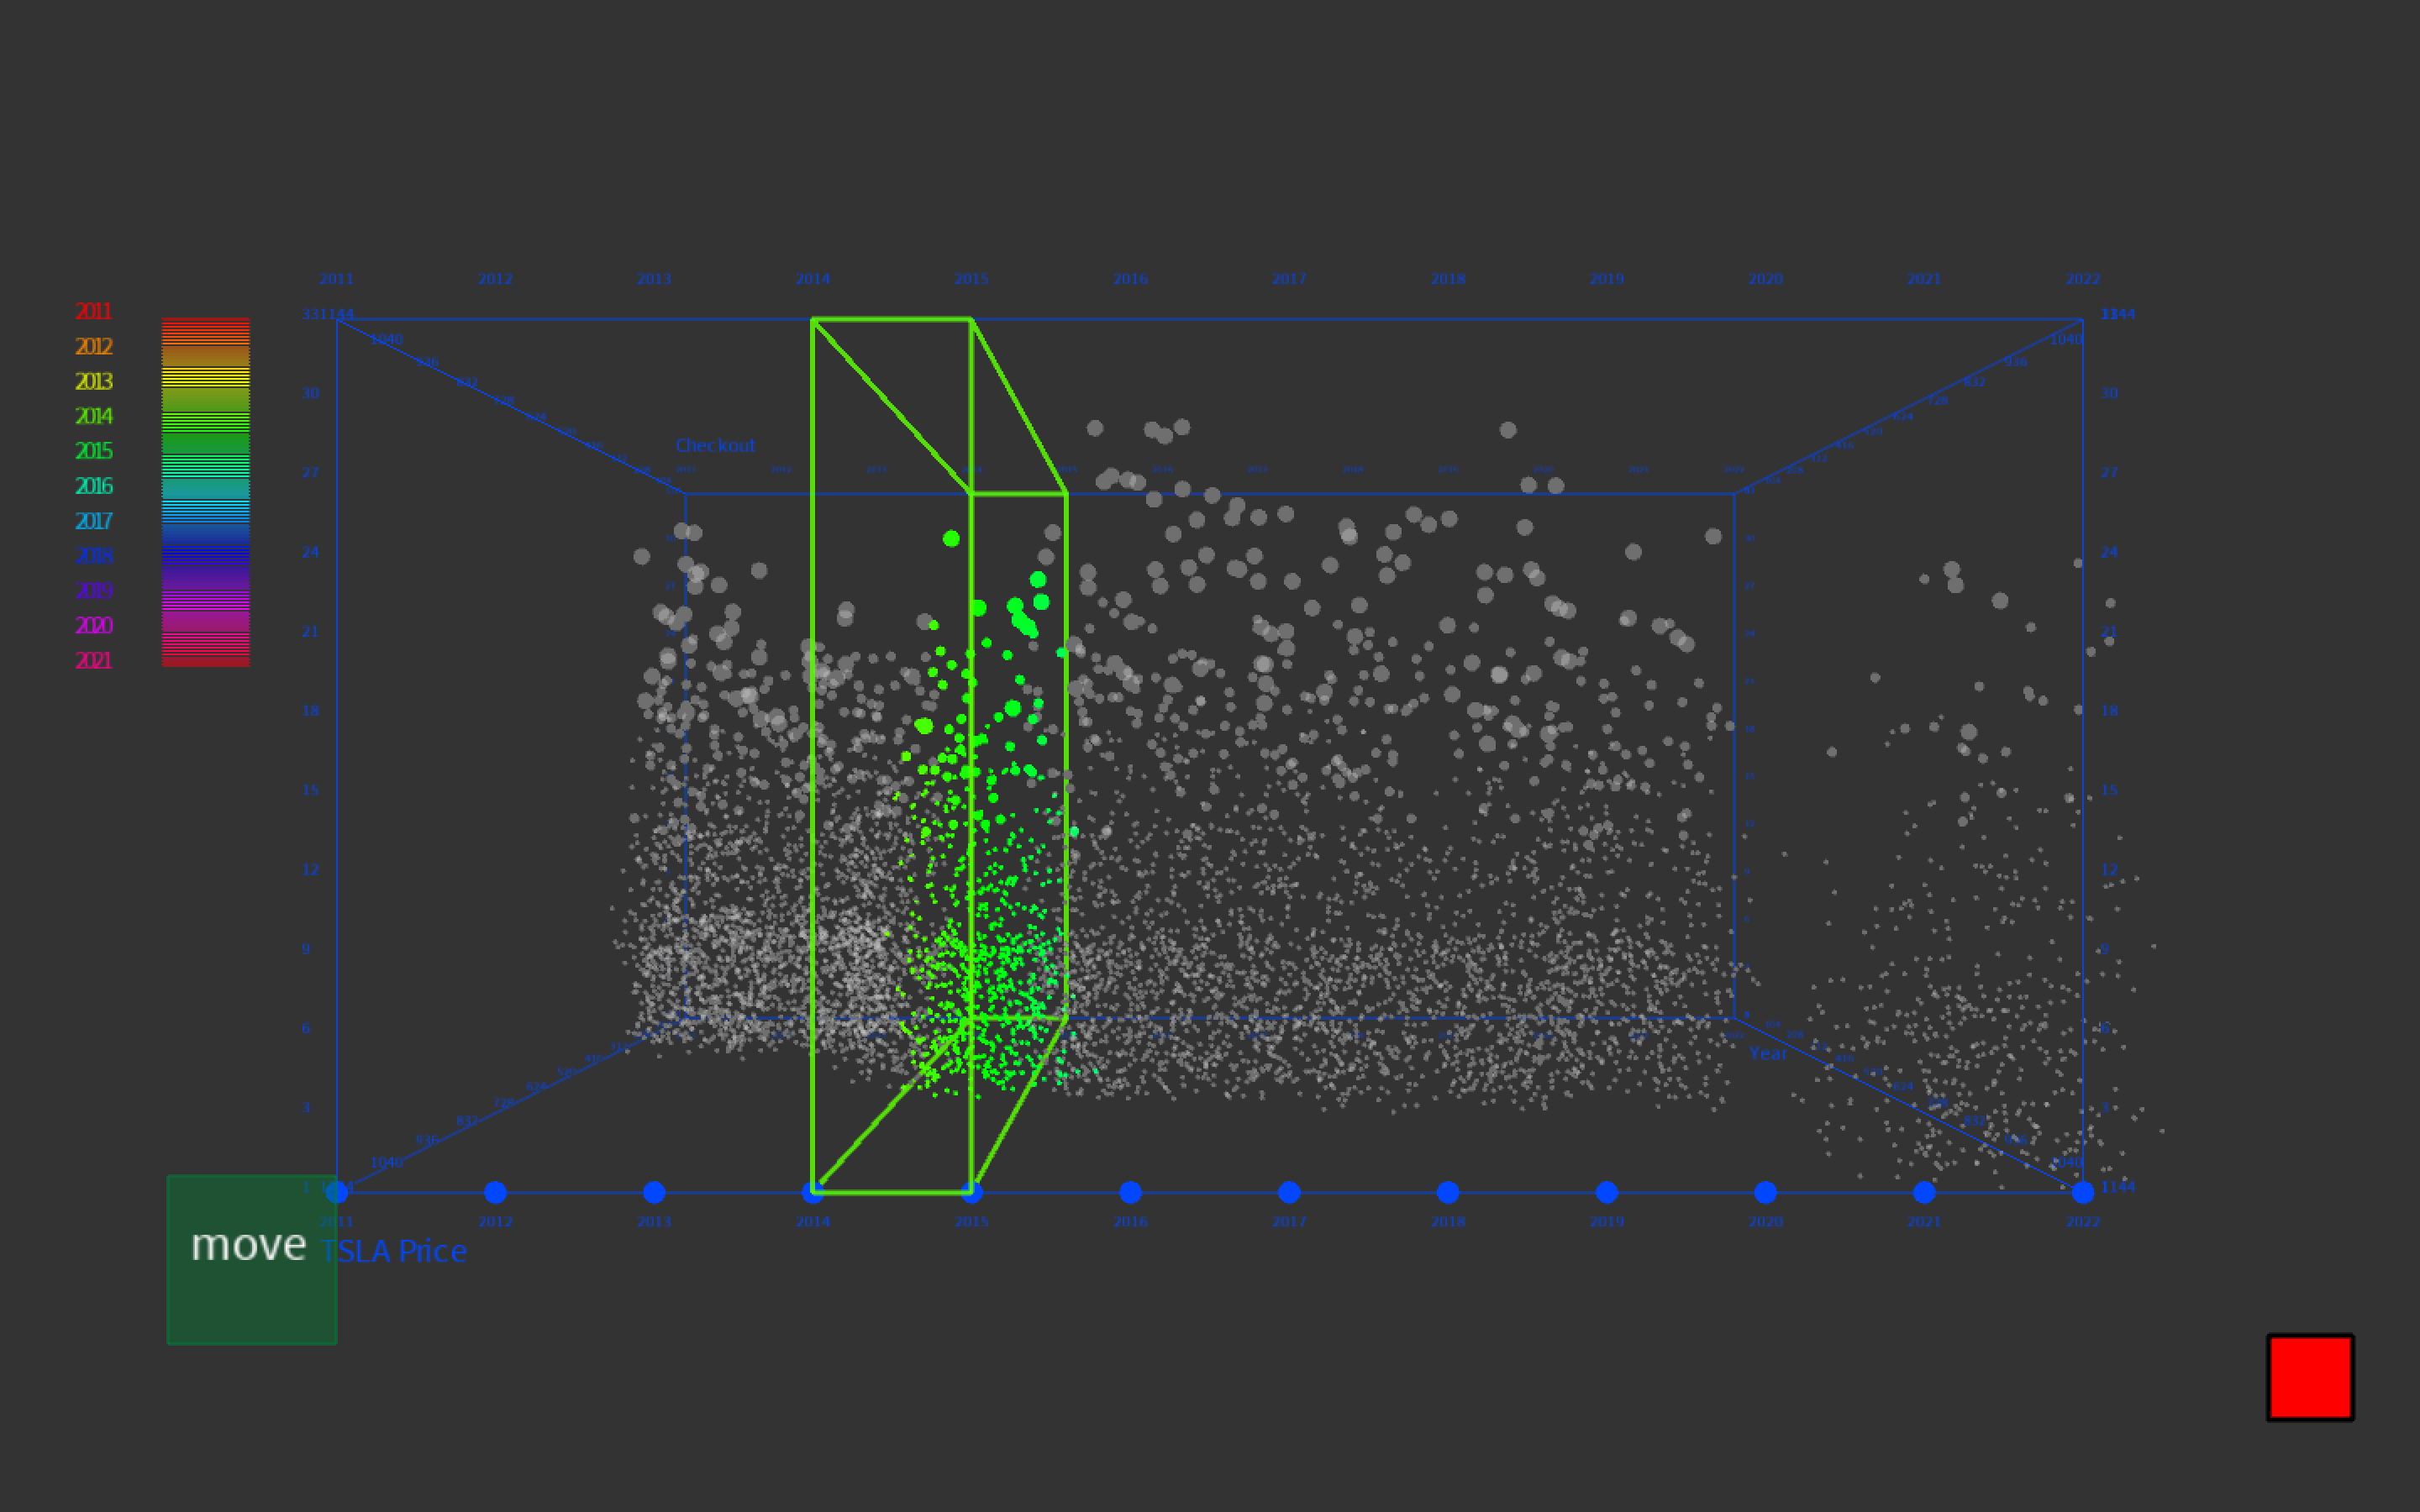
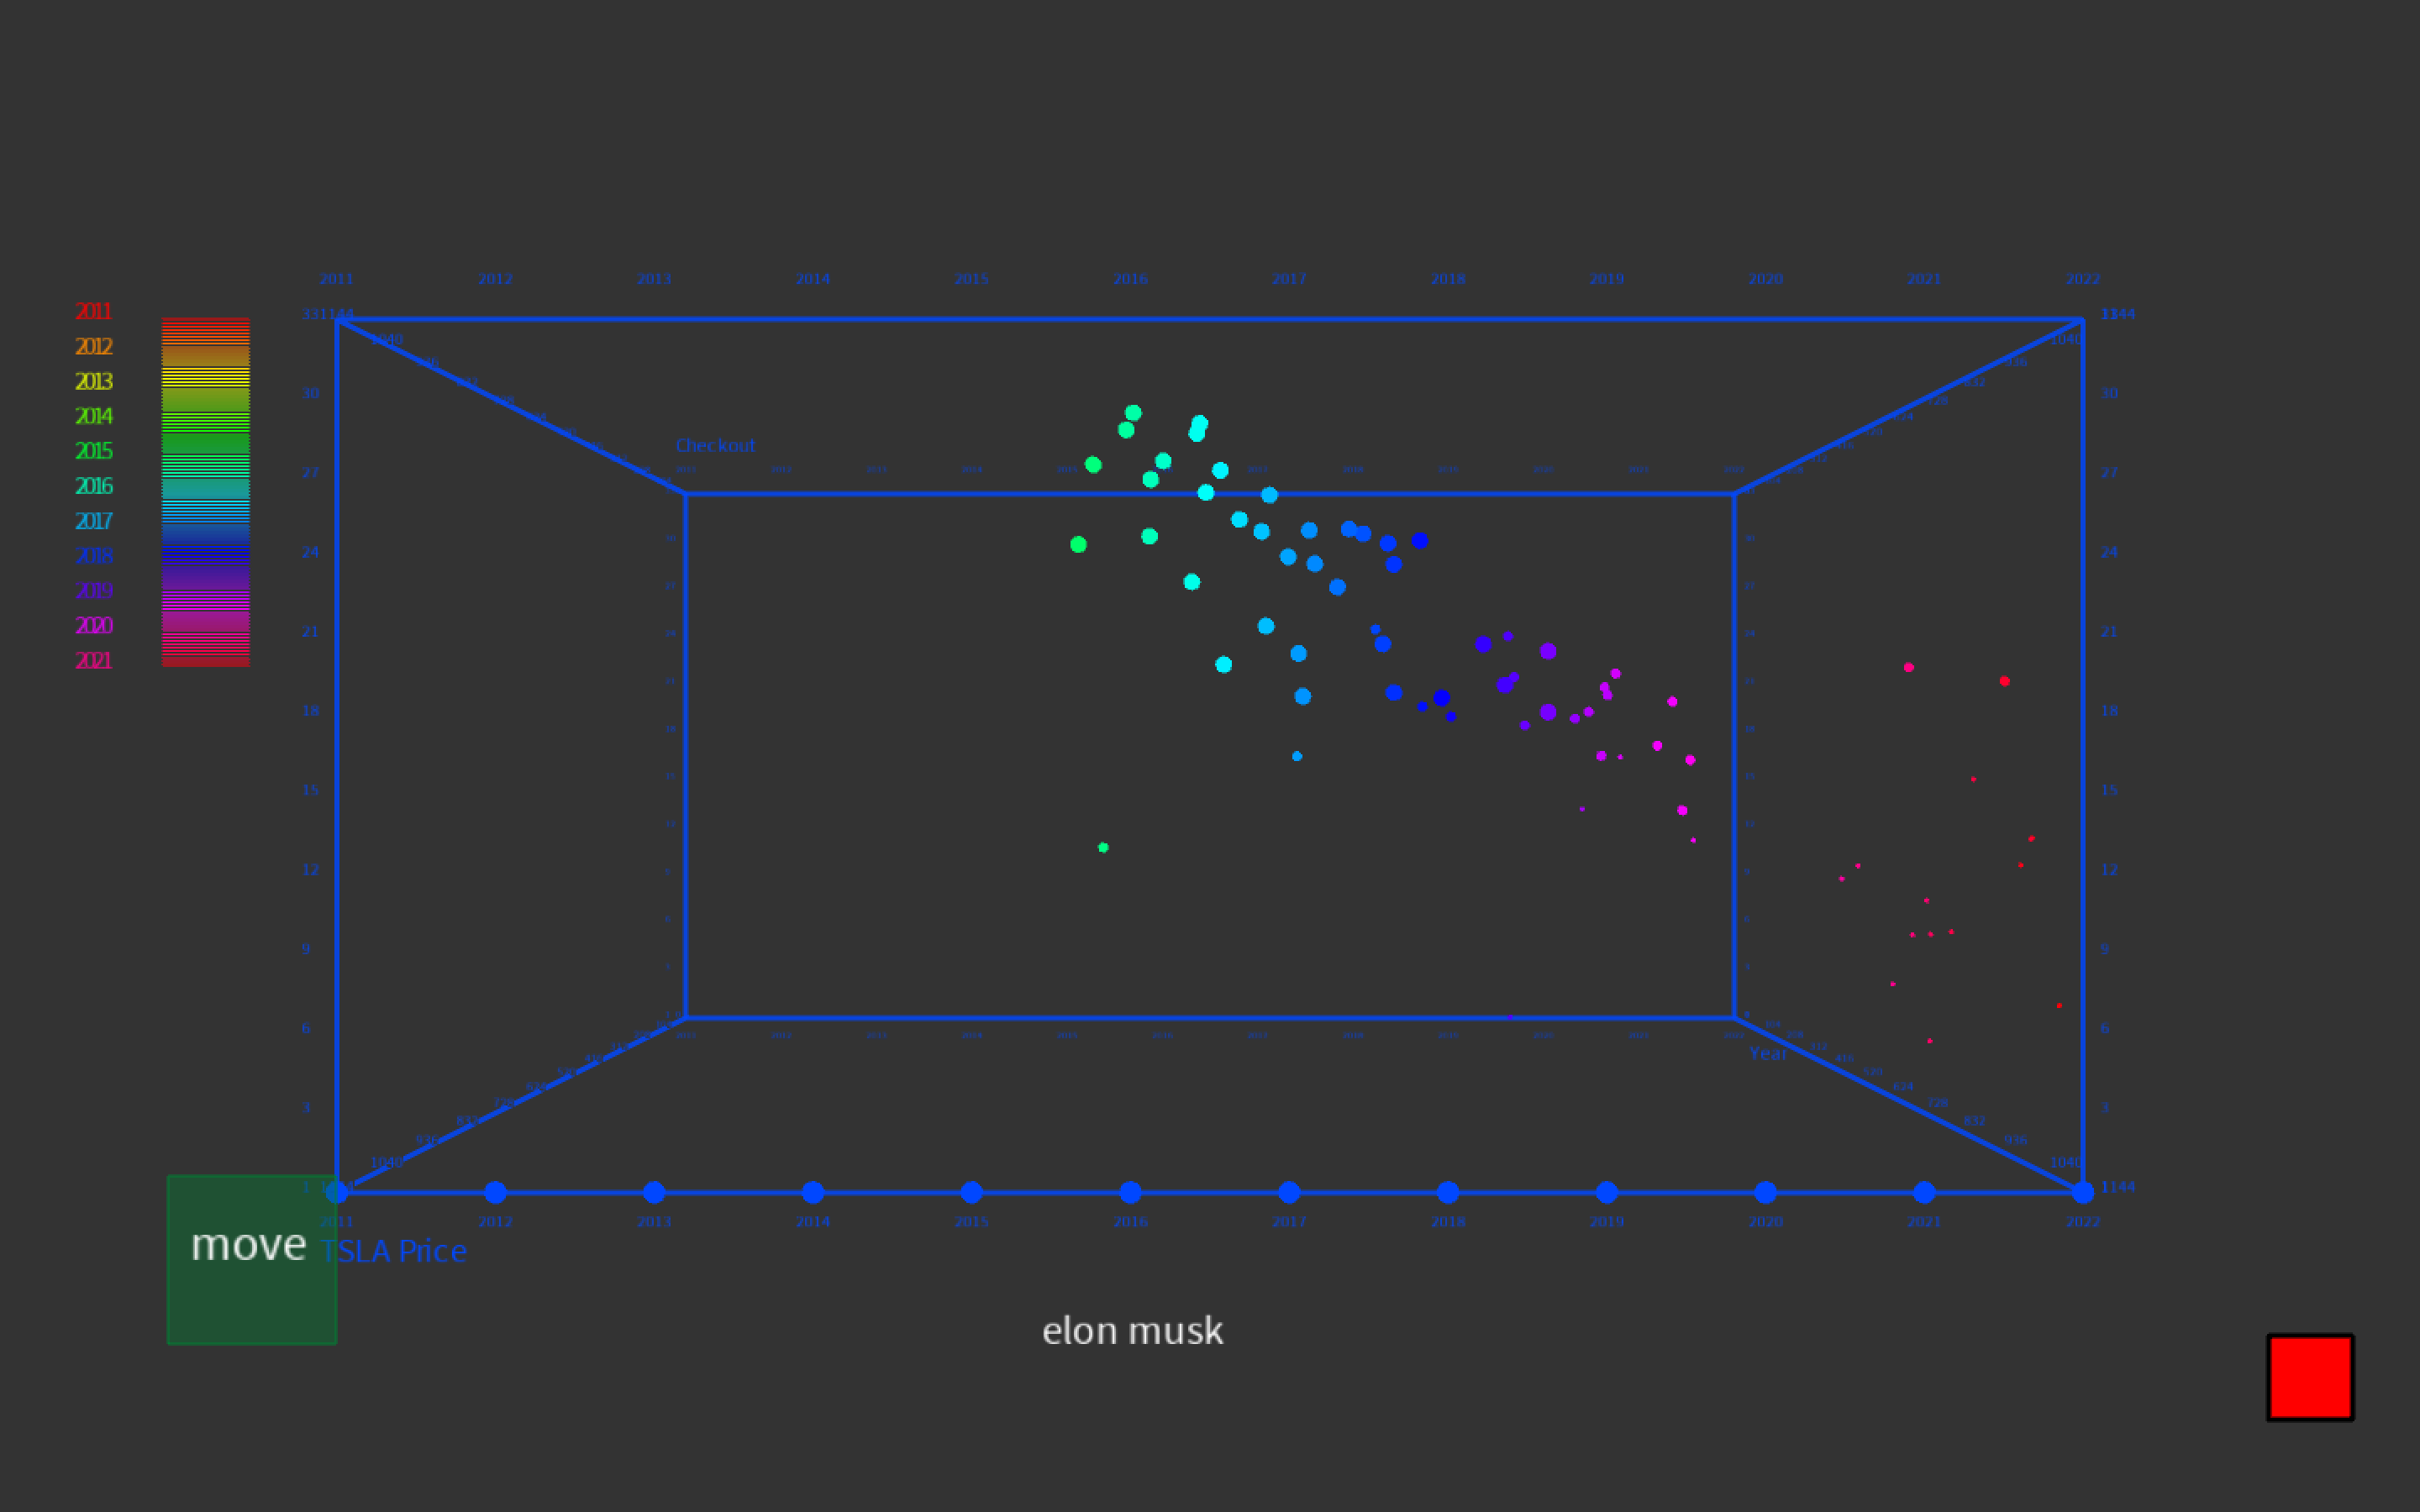
The X, Y, and Z-axis represent Year, Tesla Stock Price, and Checkouts respectively. I plotted each book, represented as a small sphere; and they are different in size and color. As the checkouts go up, the size of the small sphere will increase as well. The few they were borrowed, the smaller the sphere. Each Year in the X-axis represents a color and I have listed it on the left. I made a small box, which functions like a button that could rotate the box in a convenient way. The box has two motions, one is moving, and the other one is static. Once you click the button, the sphere will be moving or become static if do it again. Besides, you could search one specific book which includes some keywords related to Tesla and Elon Musk, and you will see all the related small spheres shown in the visualization, and thus you could move your mouse to the sphere to check the information such as the stock price on that day, number of checkouts, book title, and Year. If you would like to see the general situation in one certain year, you could just click the year on the X-axis and it will only show the small spheres in this year and blur the others.
Final result
Moving motion.
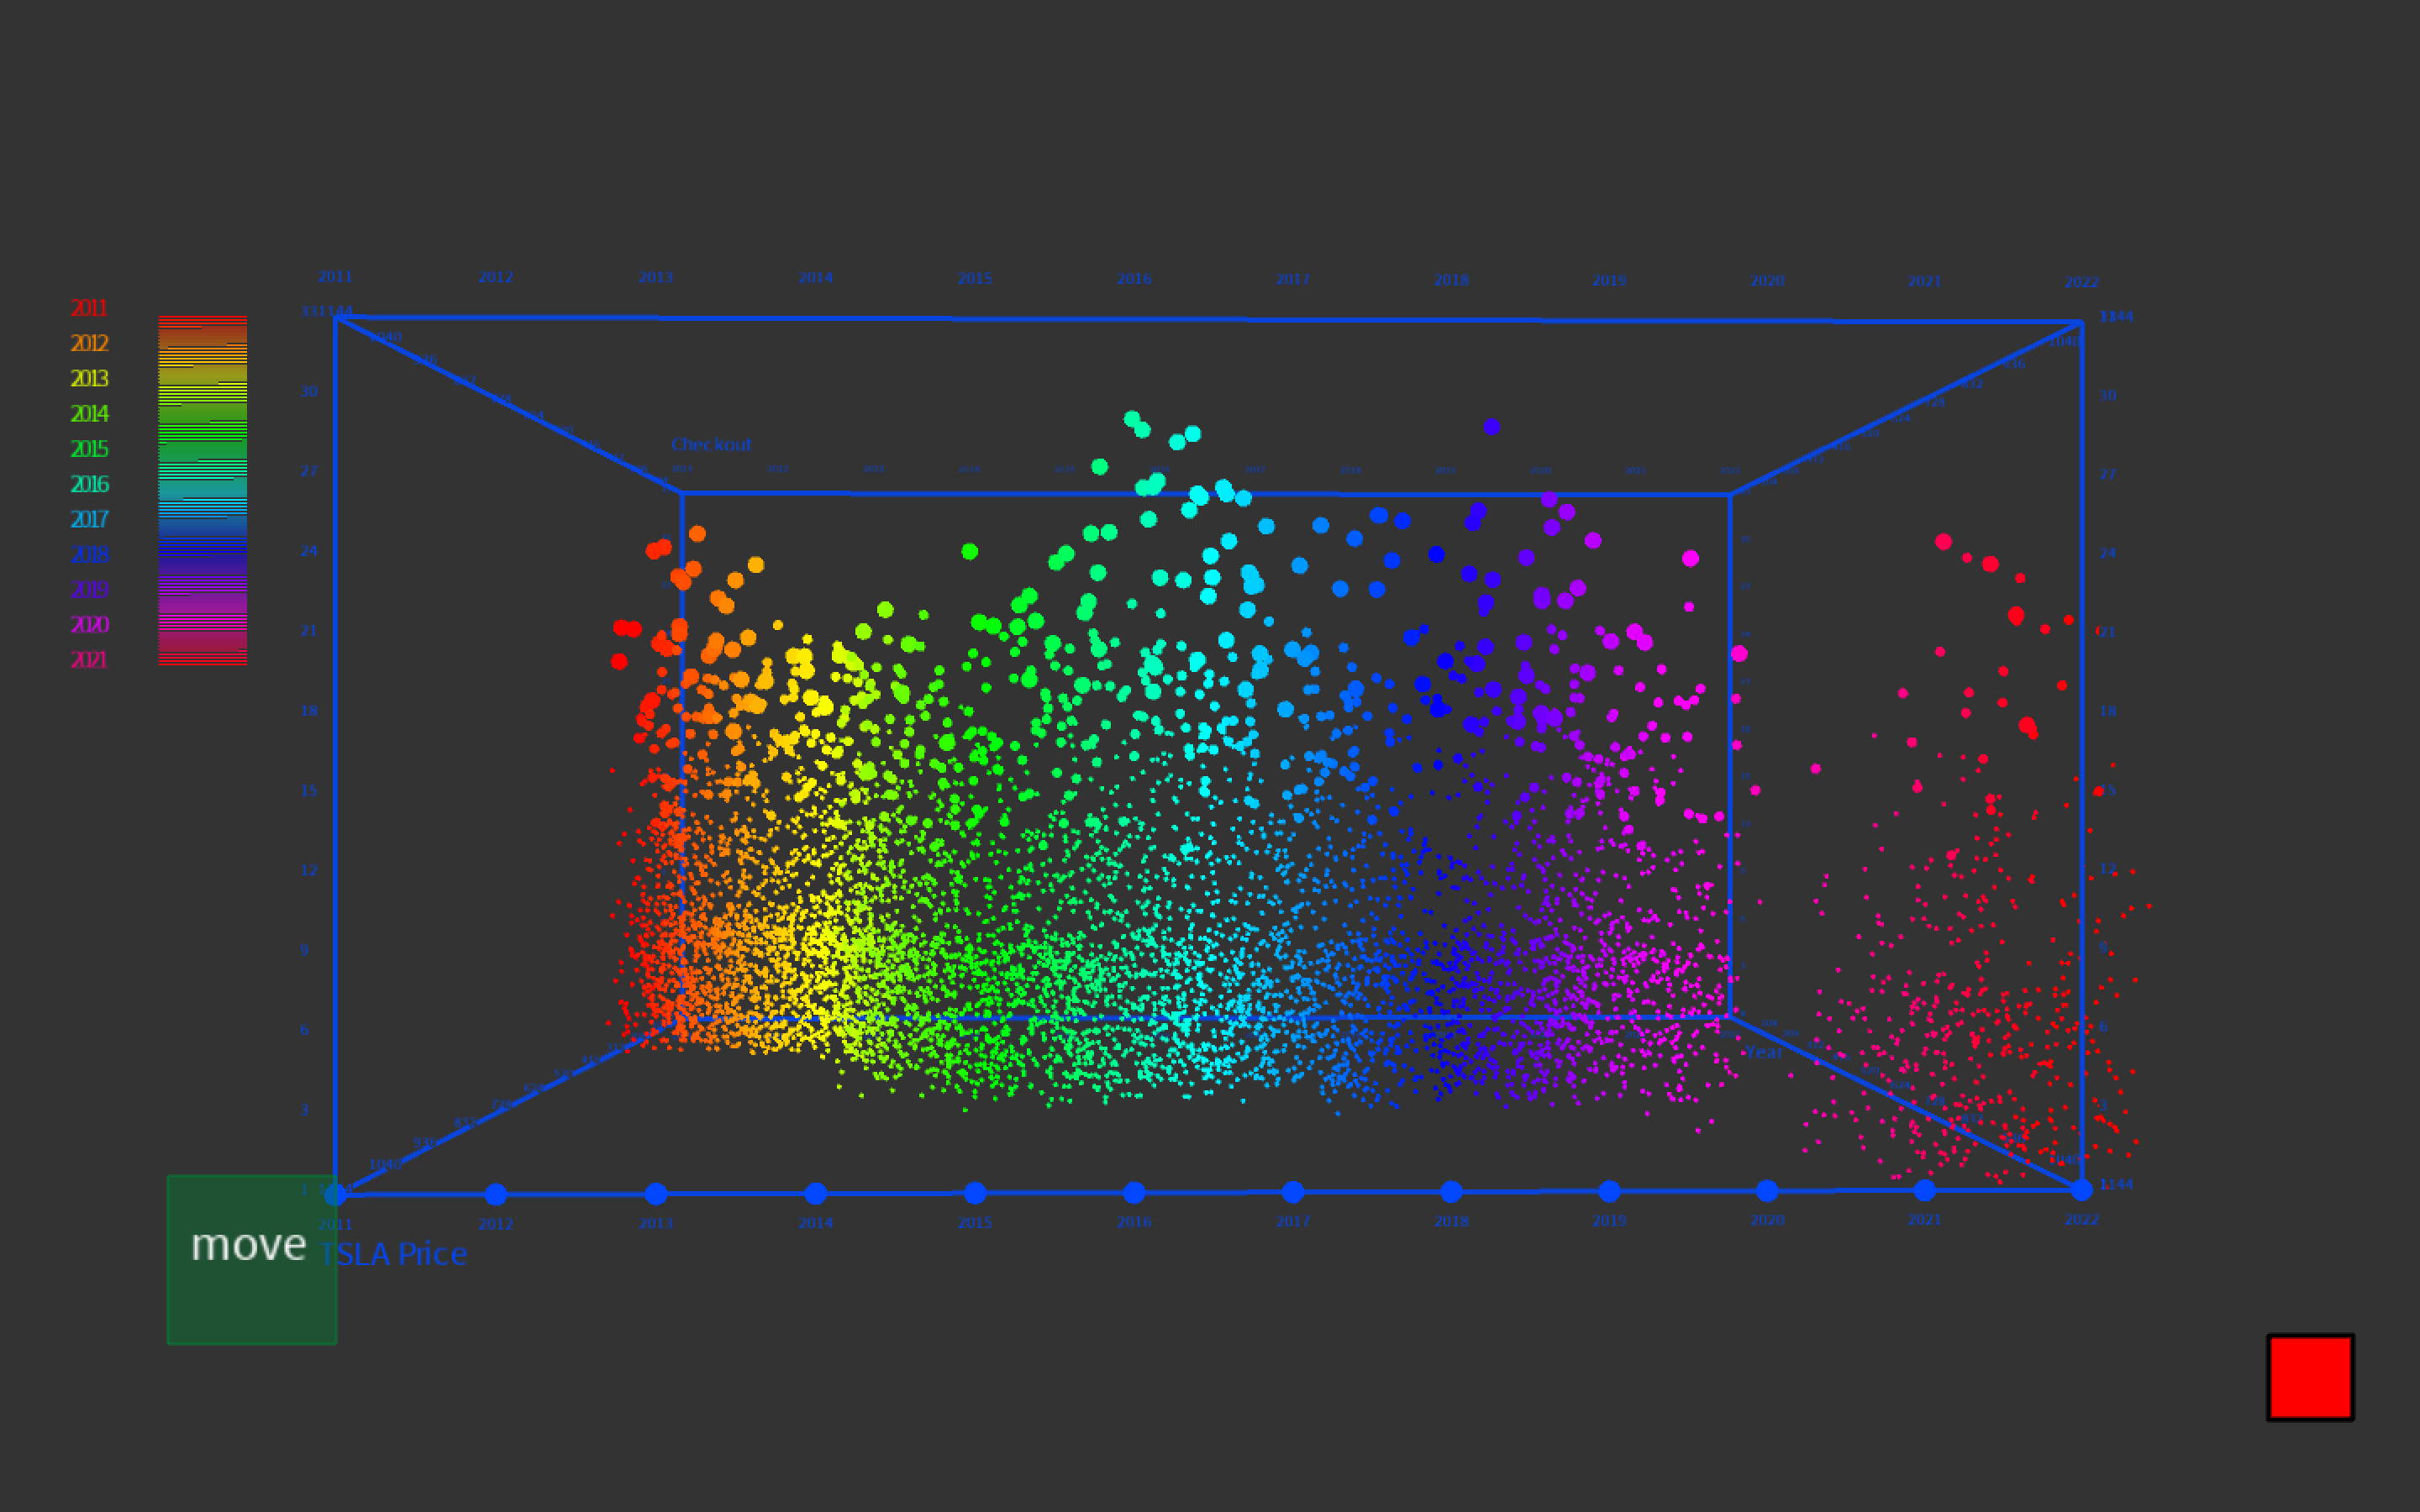
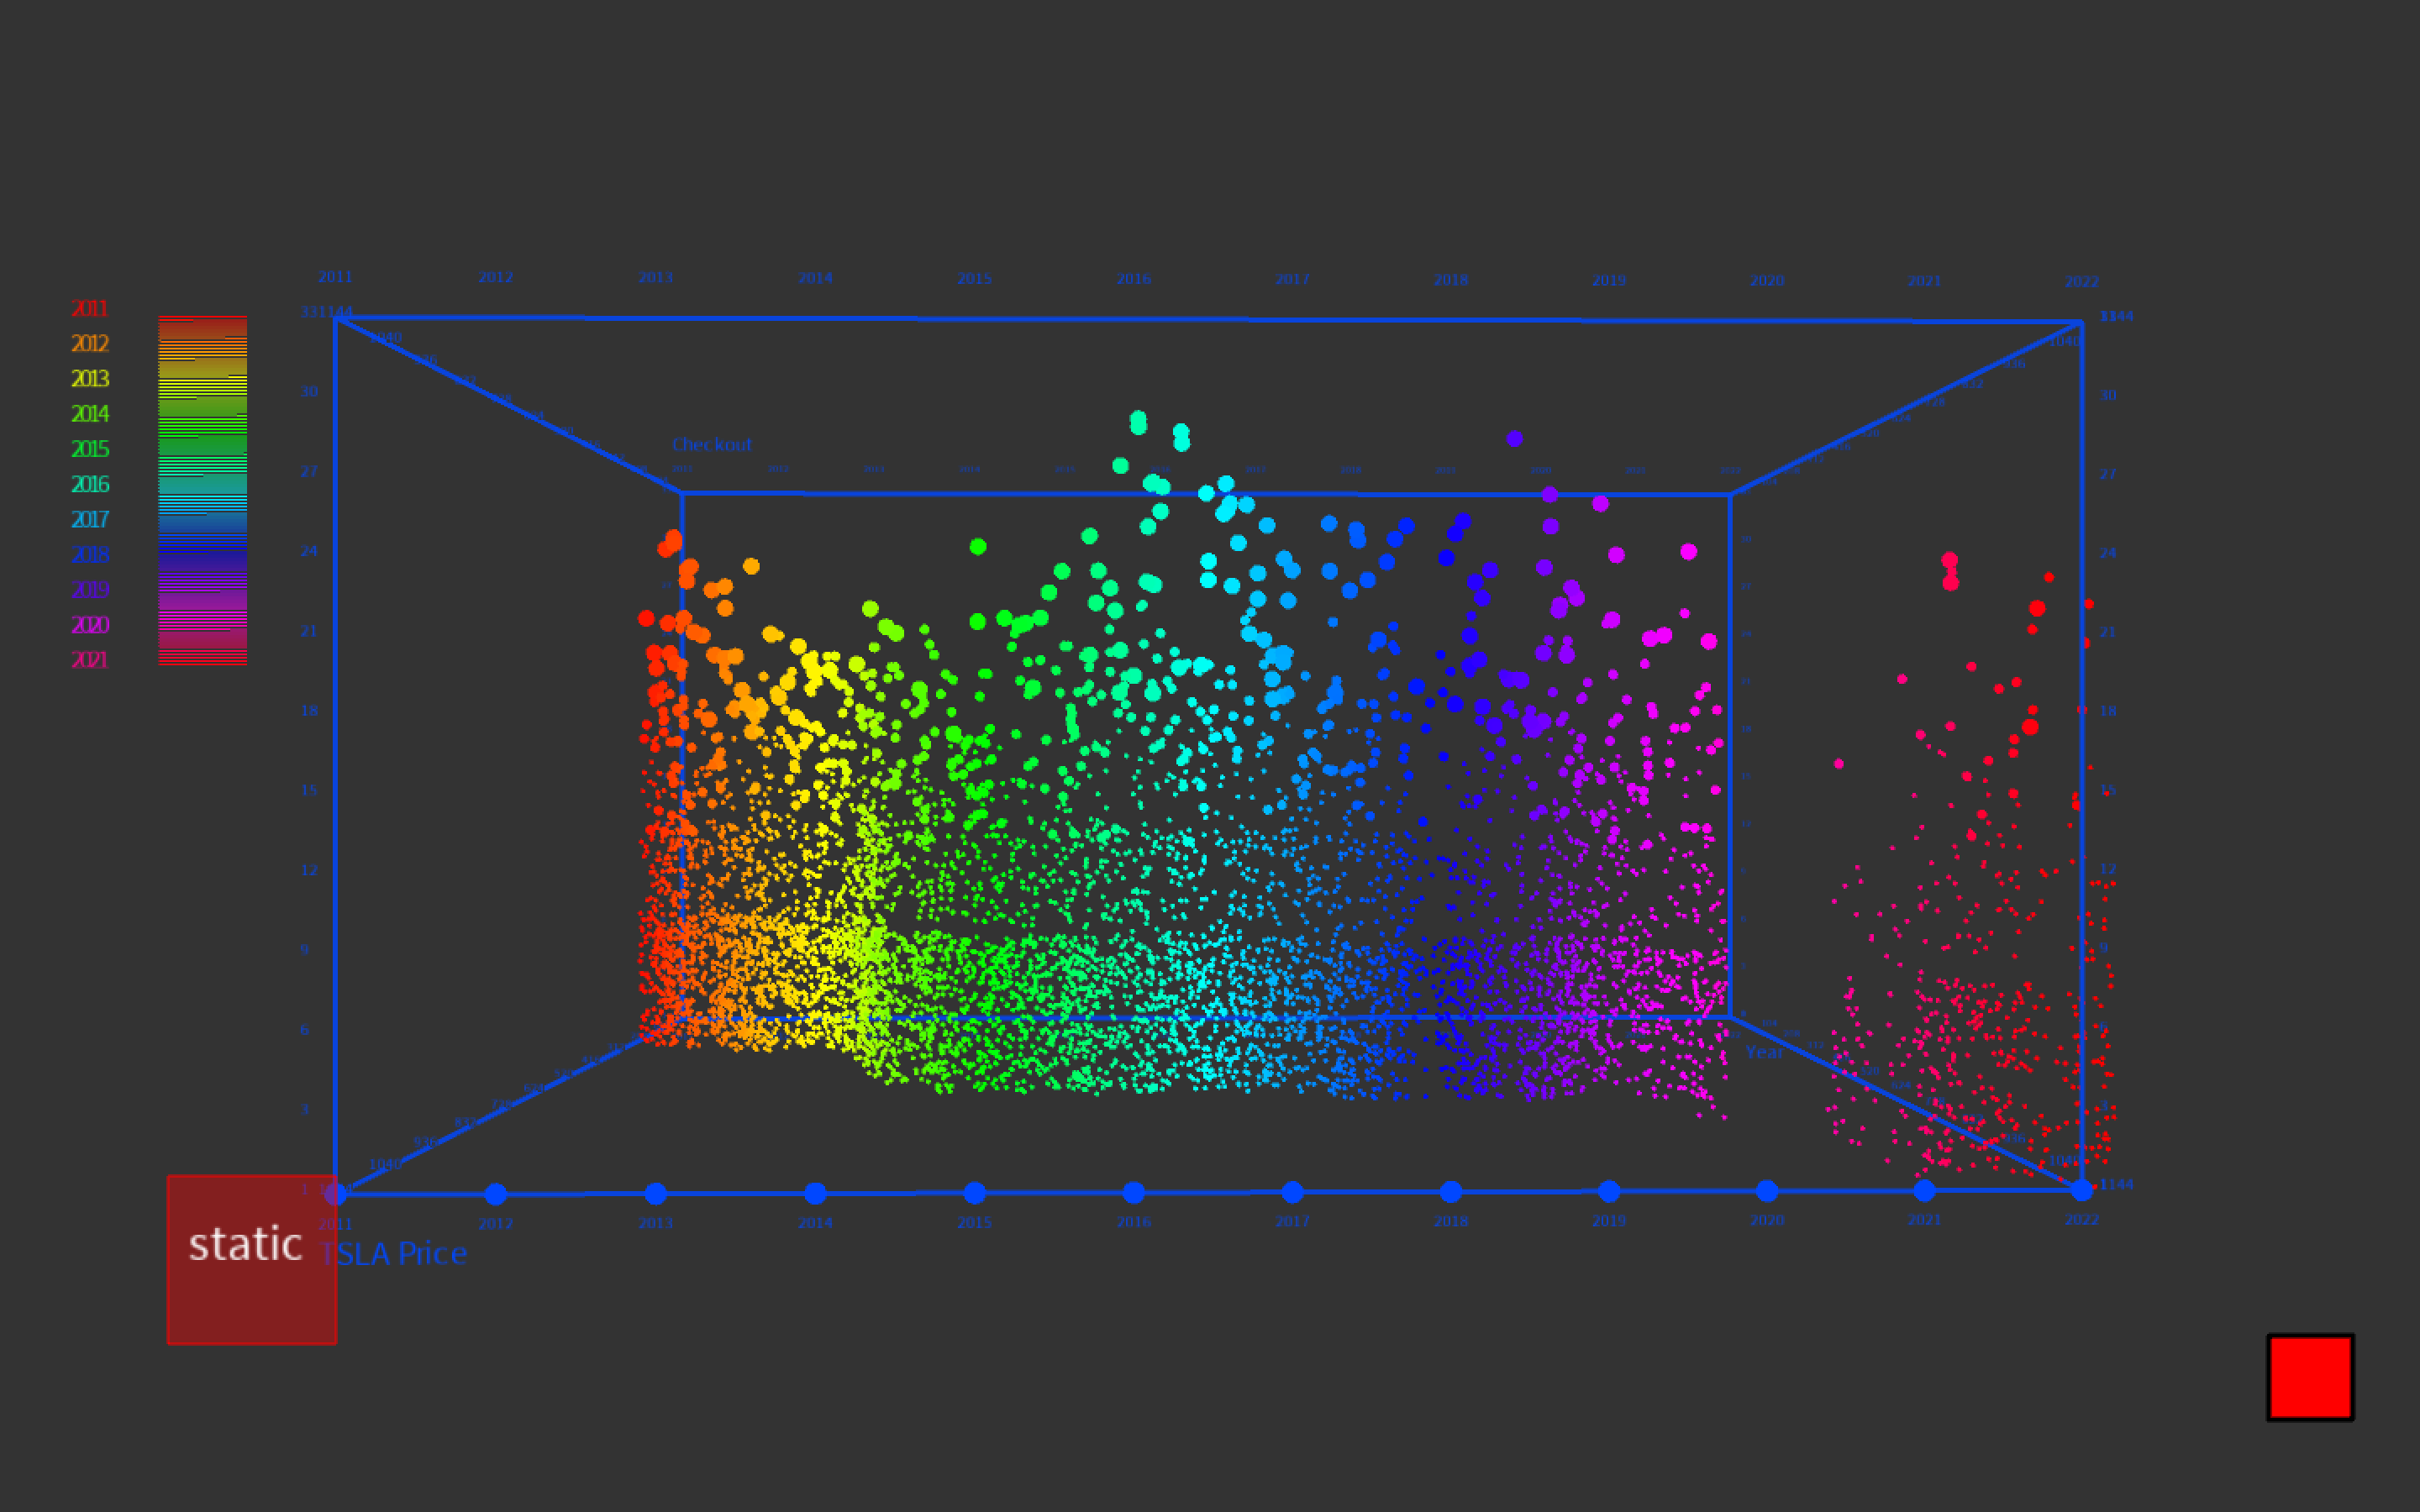
Static motion
Select Year 2014-2015
Search books with key word "elon musk"
Click one particle and it will show the details of the book in the upper left
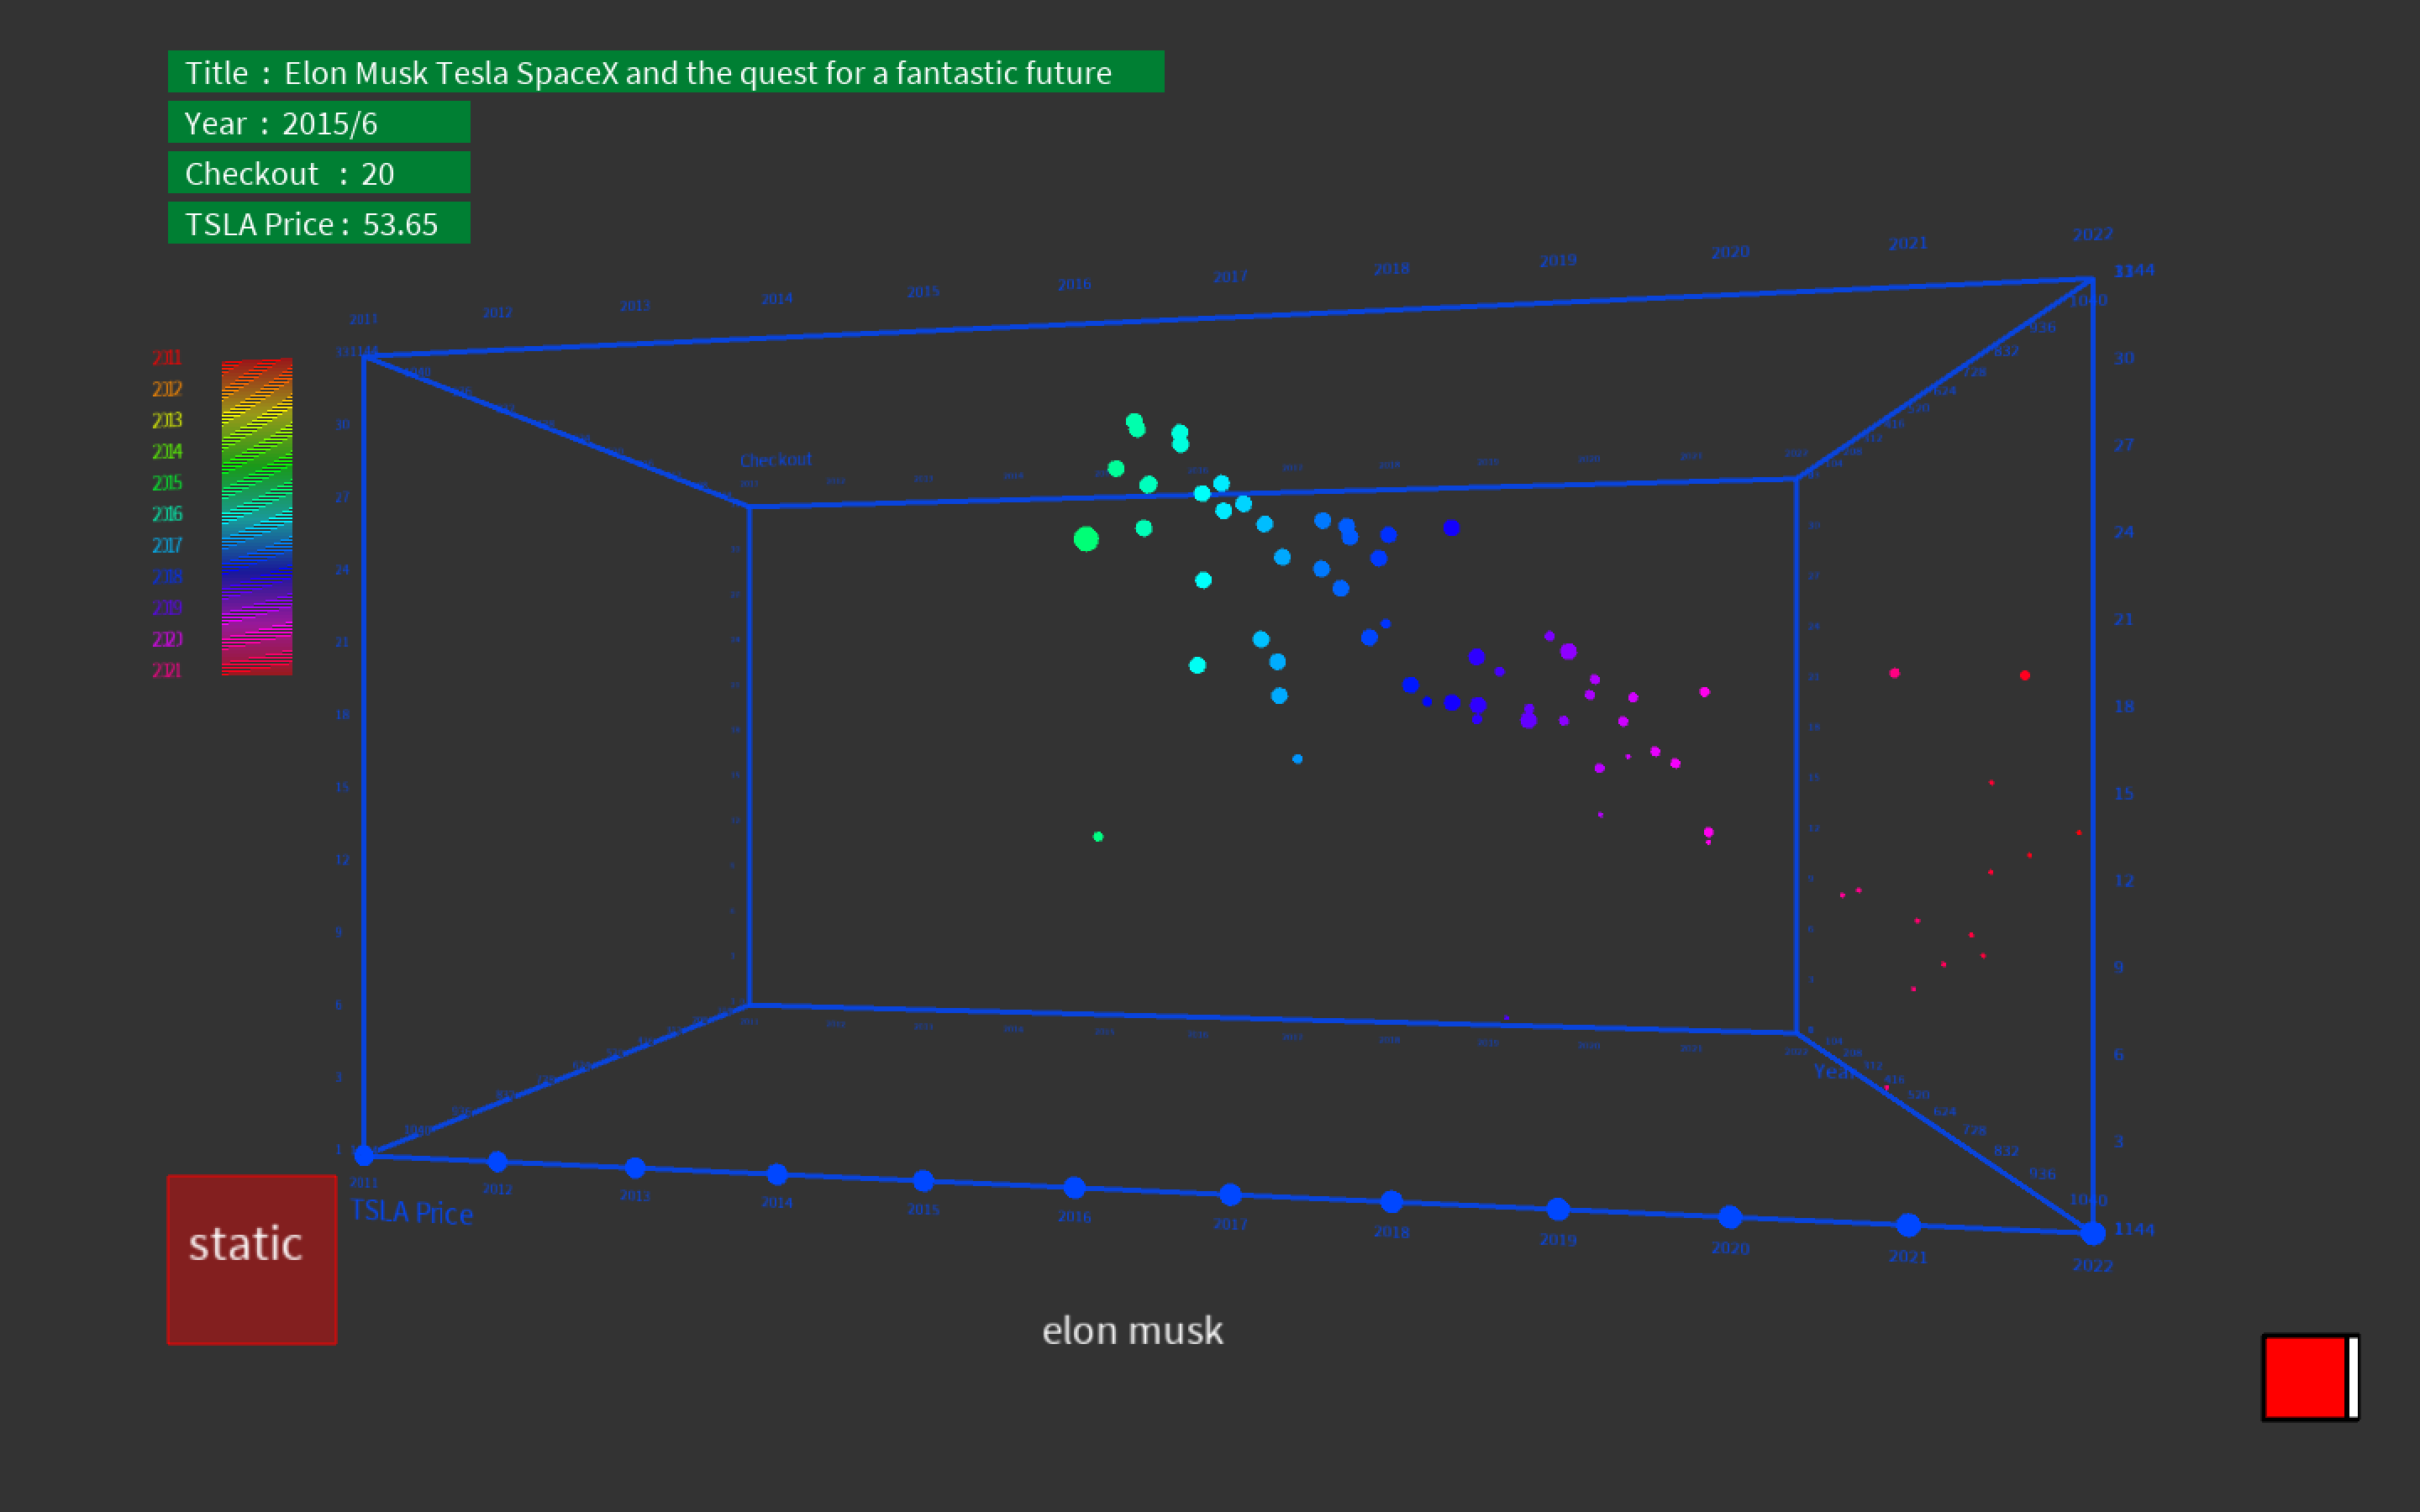
Static motion
Select Year 2014-2015
Search books with key word "elon musk"
Click one particle and it will show the details of the book in the upper left
Code