3D Visualization for Programming Languages
MAT 259, 2022
Jiaxin Wu
Concept
I visualized the trend of different programming languages in Project 1. In this project, I picked the 5 most popular programming languages. I want to visualize the relationship between the checkouts and their popularity.
Query
SELECT
bibNumber,
cout,
cin,
title,
deweyClass,
DATEDIFF(cin, cout) AS diff,
((MONTH(cout) - 1) * 30 + DAY(cout)) AS outDay,
((MONTH(cin) - 1) * 30 + DAY(cin)) AS inDay,
YEAR(cout) AS outYear,
YEAR(cin) AS inYear,
(CASE
WHEN (LOWER(title) LIKE '%python%') THEN 'Python'
WHEN (LOWER(title) LIKE '%java %') THEN 'Java'
WHEN (LOWER(title) LIKE '%javascript%') THEN 'JavaScript'
WHEN (LOWER(title) LIKE '%sql%') THEN 'SQL'
WHEN (LOWER(title) LIKE '% c %') THEN 'C'
END) AS langType
FROM
spl_2016.inraw
WHERE
(LOWER(title) LIKE '%python%'
OR LOWER(title) LIKE '%java%'
OR LOWER(title) LIKE '%javascript%'
OR LOWER(title) LIKE '% c %'
OR LOWER(title) LIKE '%sql%')
AND (deweyClass = ''
OR (deweyClass > 0 AND deweyClass < 100))
AND YEAR(cout) > 2000
AND YEAR(cin) > 2000
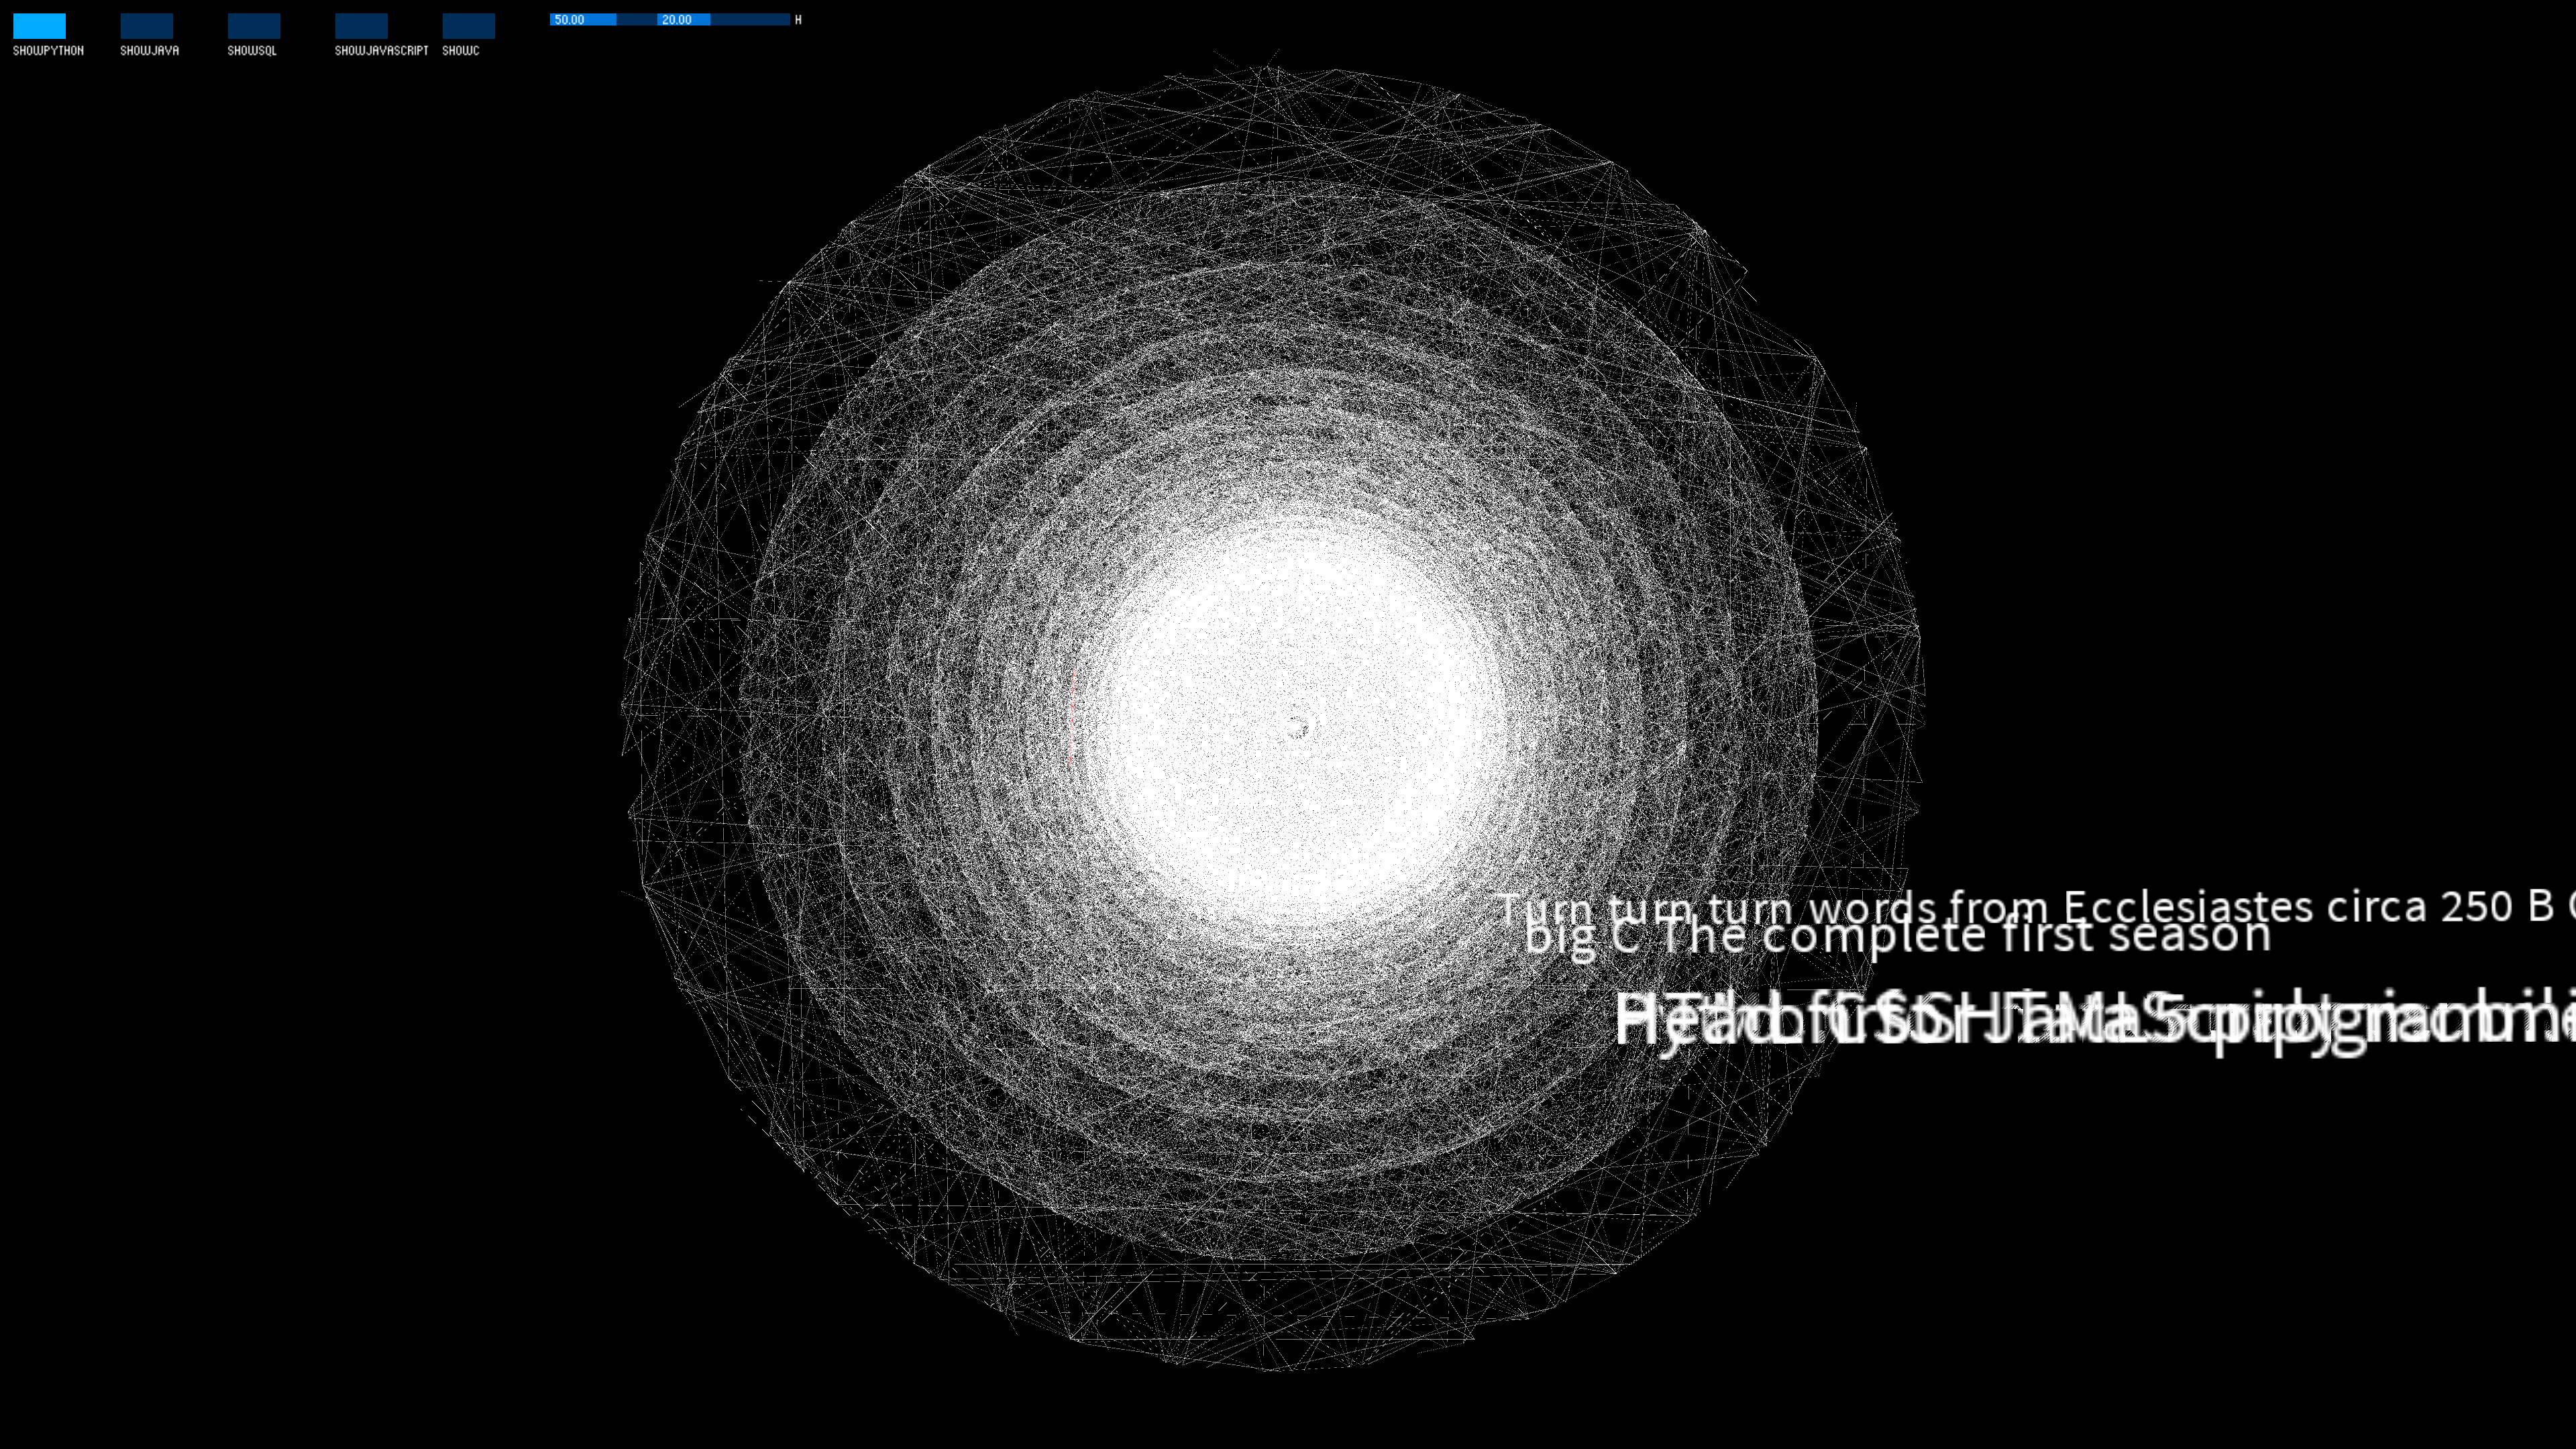
Final result
I design the visualization as a column. Each layer of the column represents a year. We also calculate the distance of the mouse and each line. If the distance is smaller than a certain threshold, the line will be colored red and the name of the book will be shown.
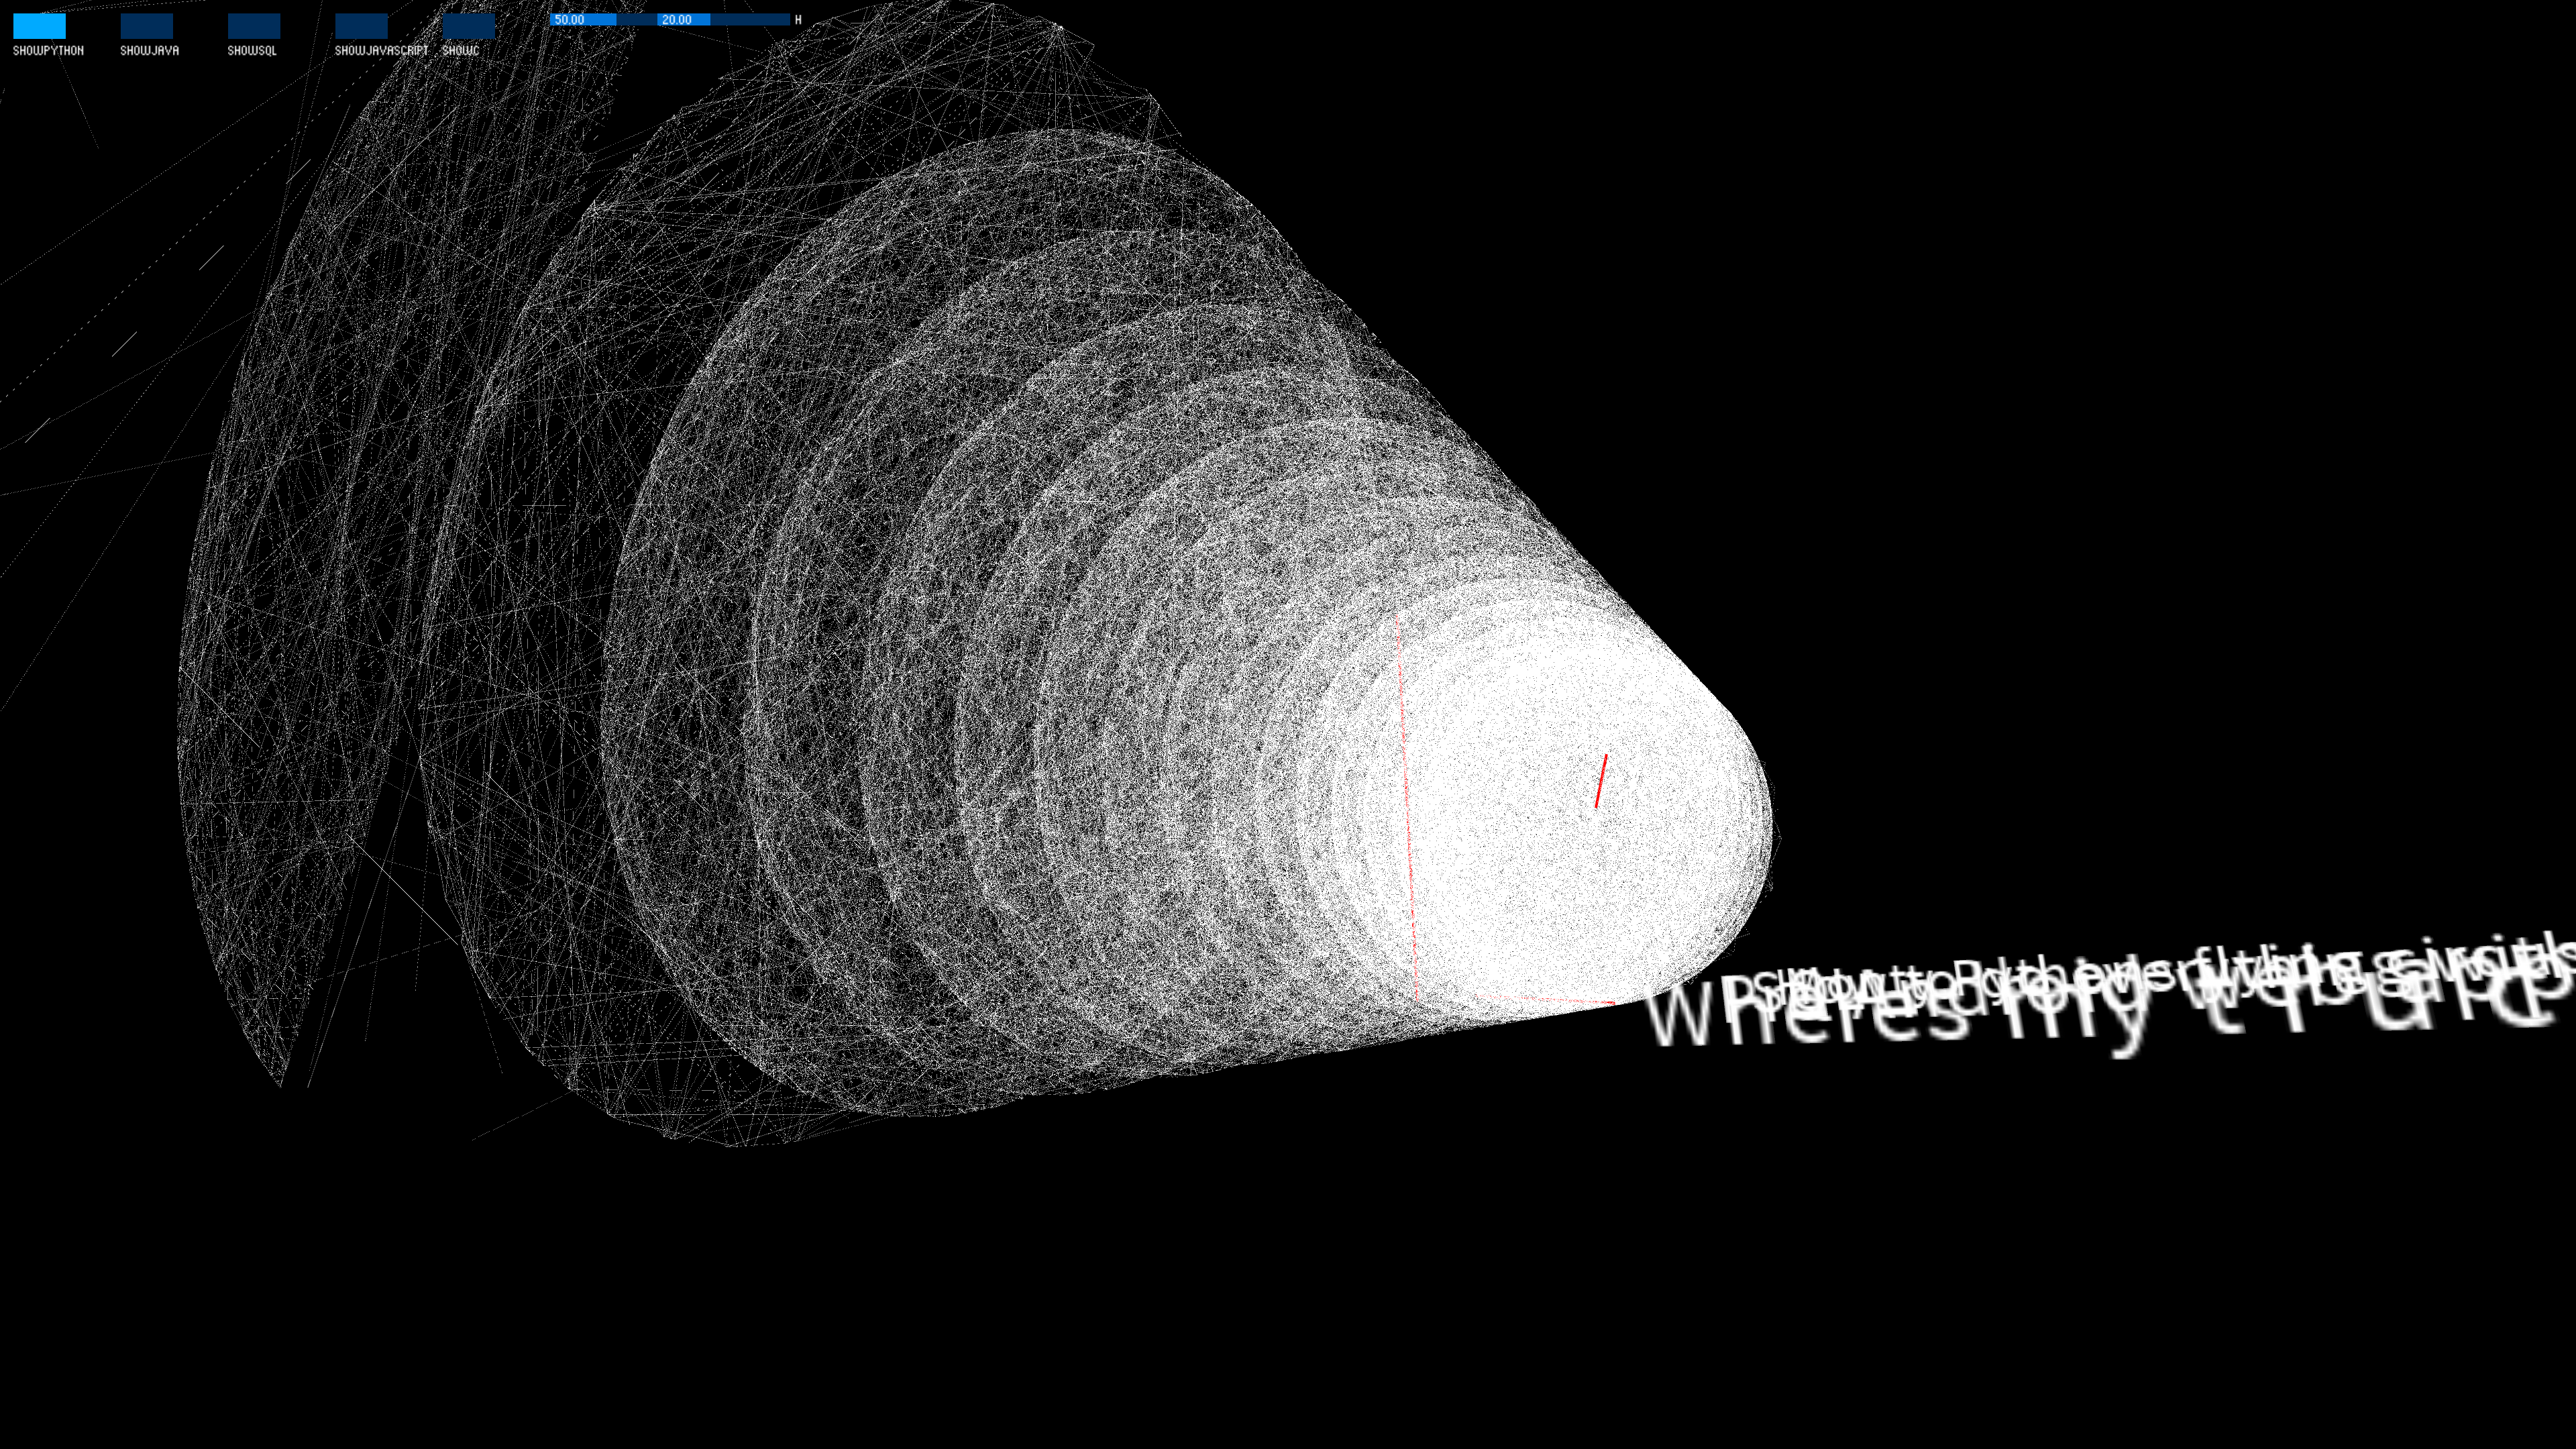
Since each checkout is related to a certain kind of programming language. We can add toggles to decide whether this kind of programming language is allowed to be shown. We add five toggles here. Toggles can help us visualize the difference in the popularity of each programming language.
Since each checkout is related to a certain kind of programming language. We can add toggles to decide whether this kind of programming language is allowed to be shown. We add five toggles here. Toggles can help us visualize the difference in the popularity of each programming language.
Code