Checkout anomaly analysis
MAT 259, 2022
Zijian Wan
Concept
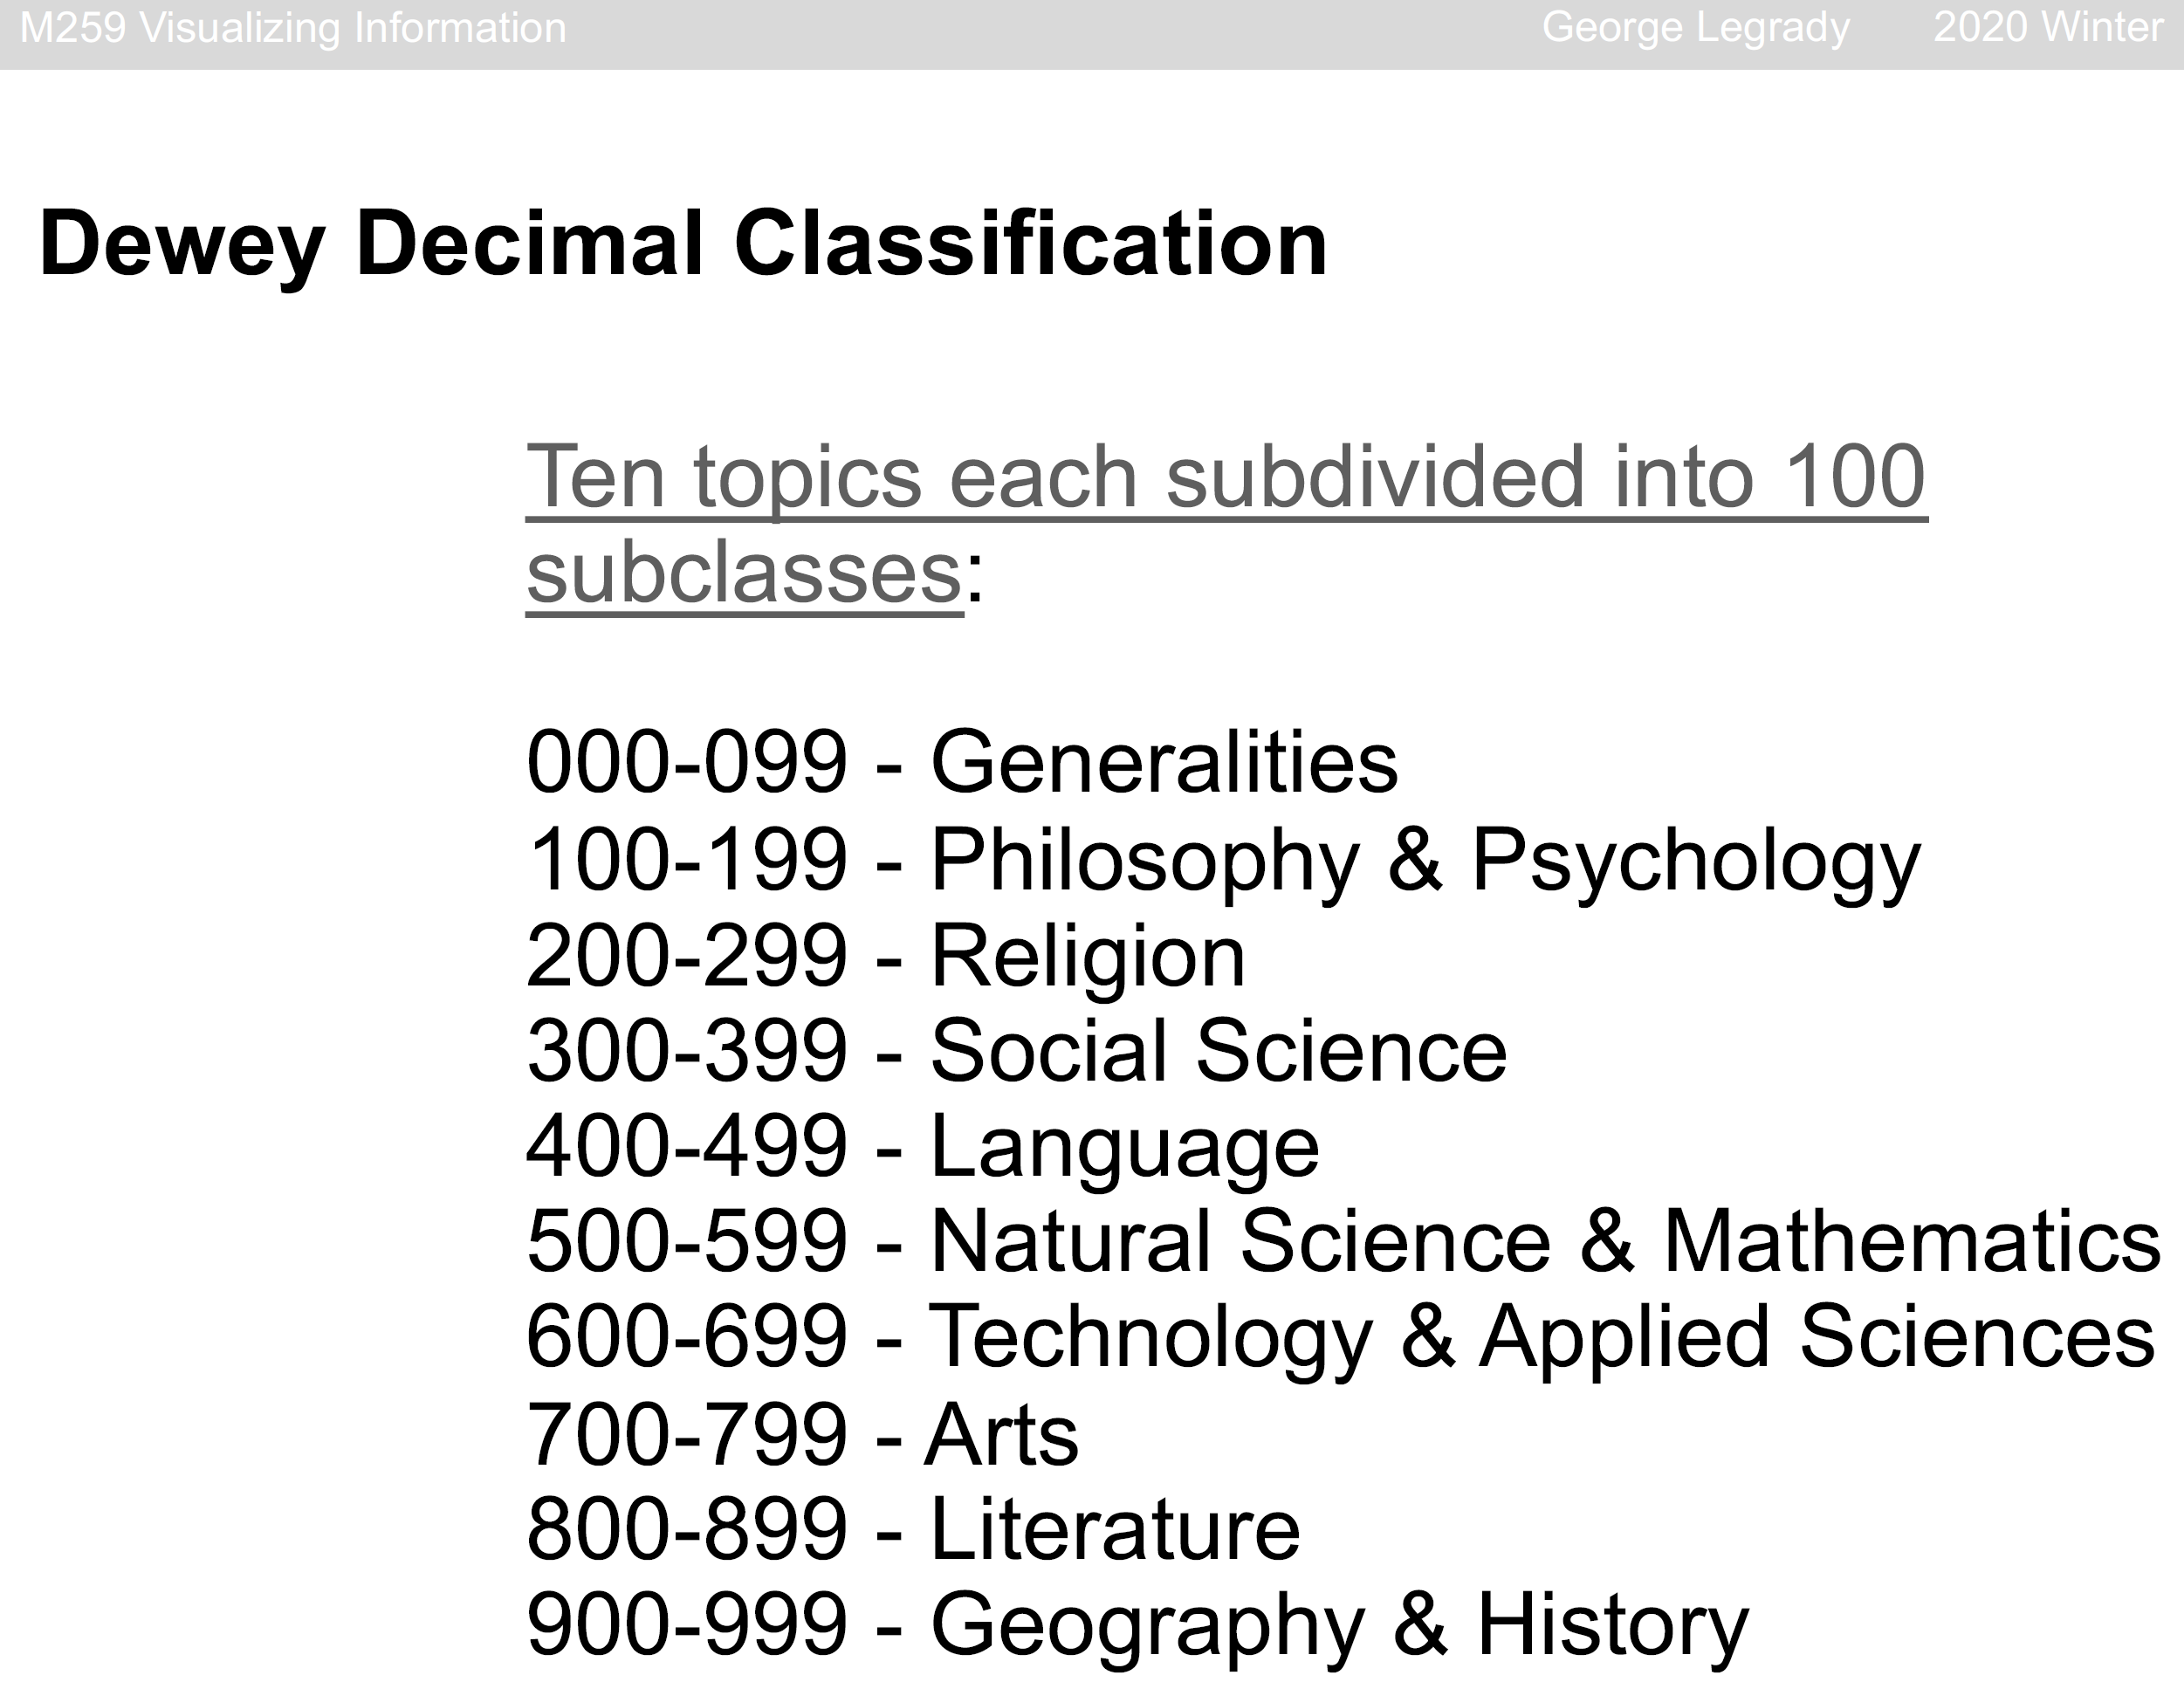
In Dewey decimal classification, there are 10 topics (see Figure 1), which are
subdivided into 100 subclasses for more detailed classification. It would be
interesting to see the overall trend of the number of checkouts of each topic in
the past 10 years (from 2012 to 2021). More interestingly, we might be able to
identify anomalies, if there are any. The data was obtained from the database with
MySQL and processed with Python for visualization and further analysis.
Query
SELECT
YEAR(cout) AS years,
MONTH(cout) AS months,
COUNT(IF(deweyClass >= 0 AND deweyClass < 99,1,NULL)) AS “Generalities”,
COUNT(IF(deweyClass >= 100 AND deweyClass < 199,1,NULL)) AS “Philosophy & Psychology”,
COUNT(IF(deweyClass >= 200 AND deweyClass < 299,1,NULL)) AS “Religion”,
COUNT(IF(deweyClass >= 300 AND deweyClass < 399,1,NULL)) AS “Social Science”,
COUNT(IF(deweyClass >= 400 AND deweyClass < 499,1,NULL)) AS “Language”,
COUNT(IF(deweyClass >= 500 AND deweyClass < 599,1,NULL)) AS “Natural Science & Mathematics”,
COUNT(IF(deweyClass >= 600 AND deweyClass < 699,1,NULL)) AS “Technology & Applied Sciences”,
COUNT(IF(deweyClass >= 700 AND deweyClass < 799,1,NULL)) AS “Arts”,
COUNT(IF(deweyClass >= 800 AND deweyClass < 899,1,NULL)) AS “Literature”,
COUNT(IF(deweyClass >= 900 AND deweyClass < 999,1,NULL)) AS “Geography & History”
FROM
spl_2016.outraw
WHERE
YEAR(cout) BETWEEN 2012 AND 2021
GROUP BY months , years
ORDER BY years , months;
Preliminary sketches
Below are the 10 topics in the Dewey classification categories,
on which this analysis is based.
Process
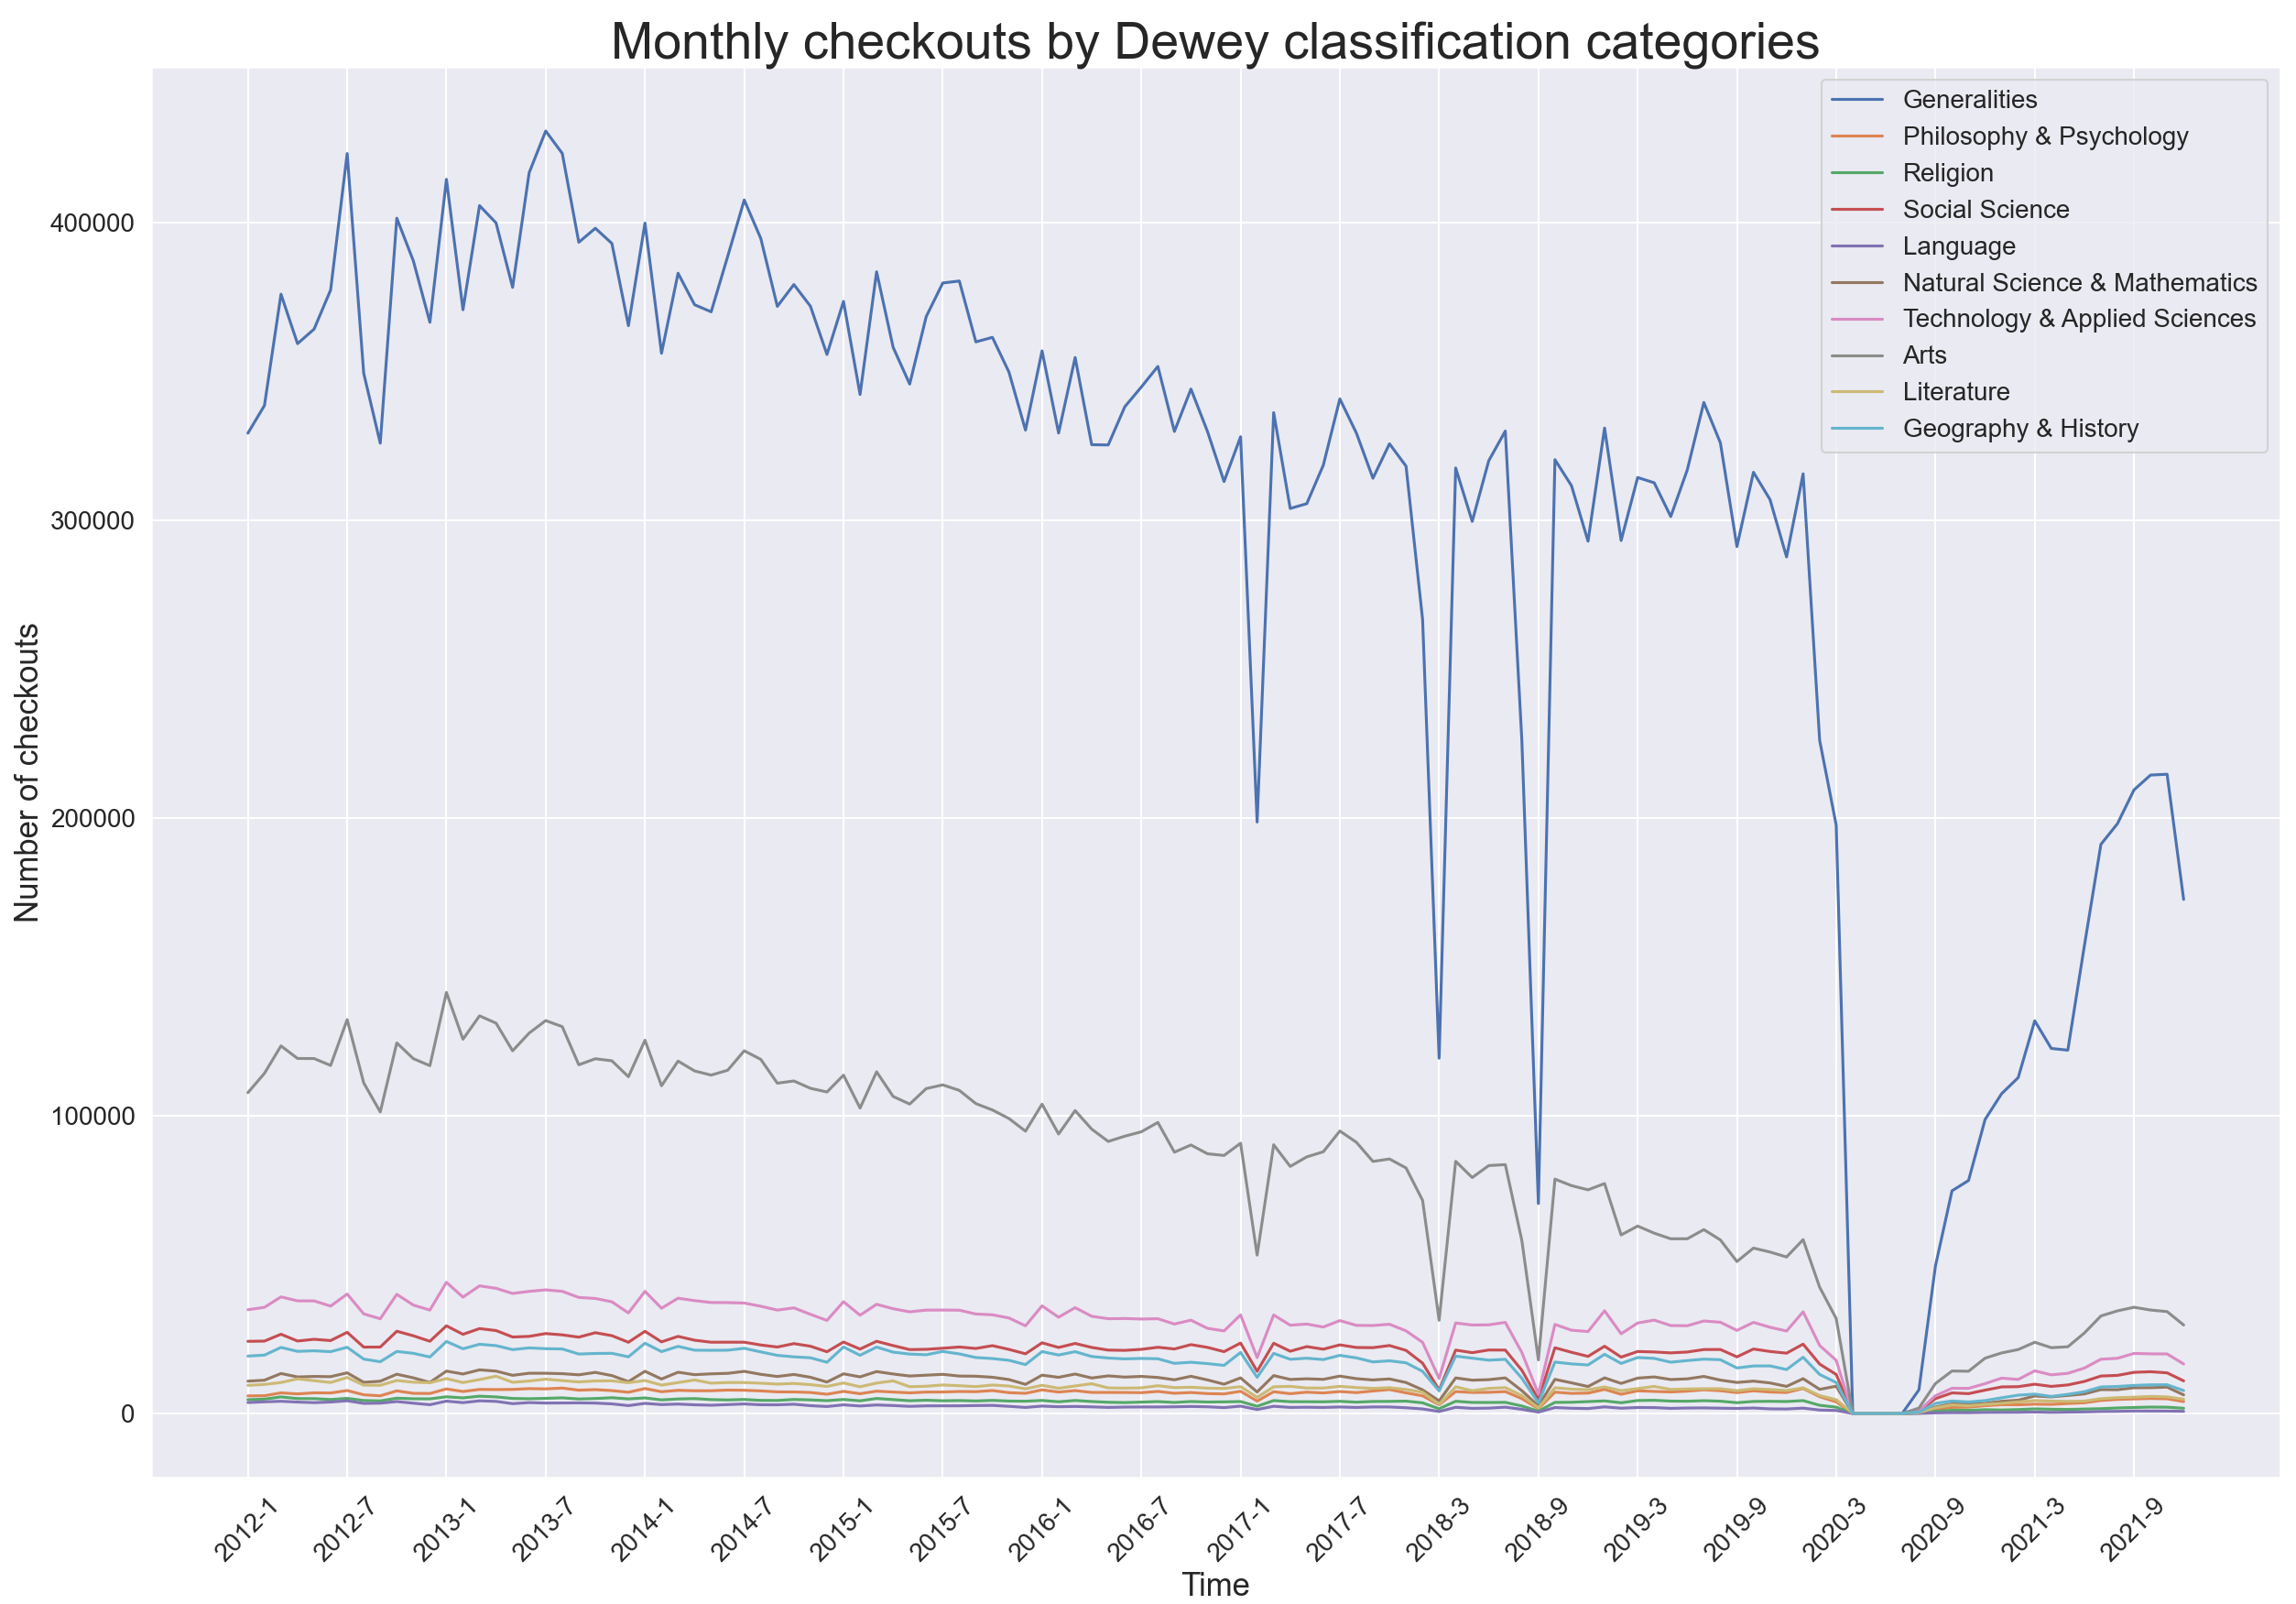
The obtained dataset was visualized using the Matplotlib package in Python
(with codes attached below).
Final result
As shown in the figure above, the monthly checkout number of generalities is far
greater than that of others, leading to difficulty of comparative evaluation.
Therefore, I tried to plot the checkout change instead. To calculate changes,
I took the first record available for each category, i.e., the monthly checkout
number of January 2012, as the baseline, and calculated the changes accordingly.
The monthly checkout changes are visualized in the figure below (with Python codes
attached).
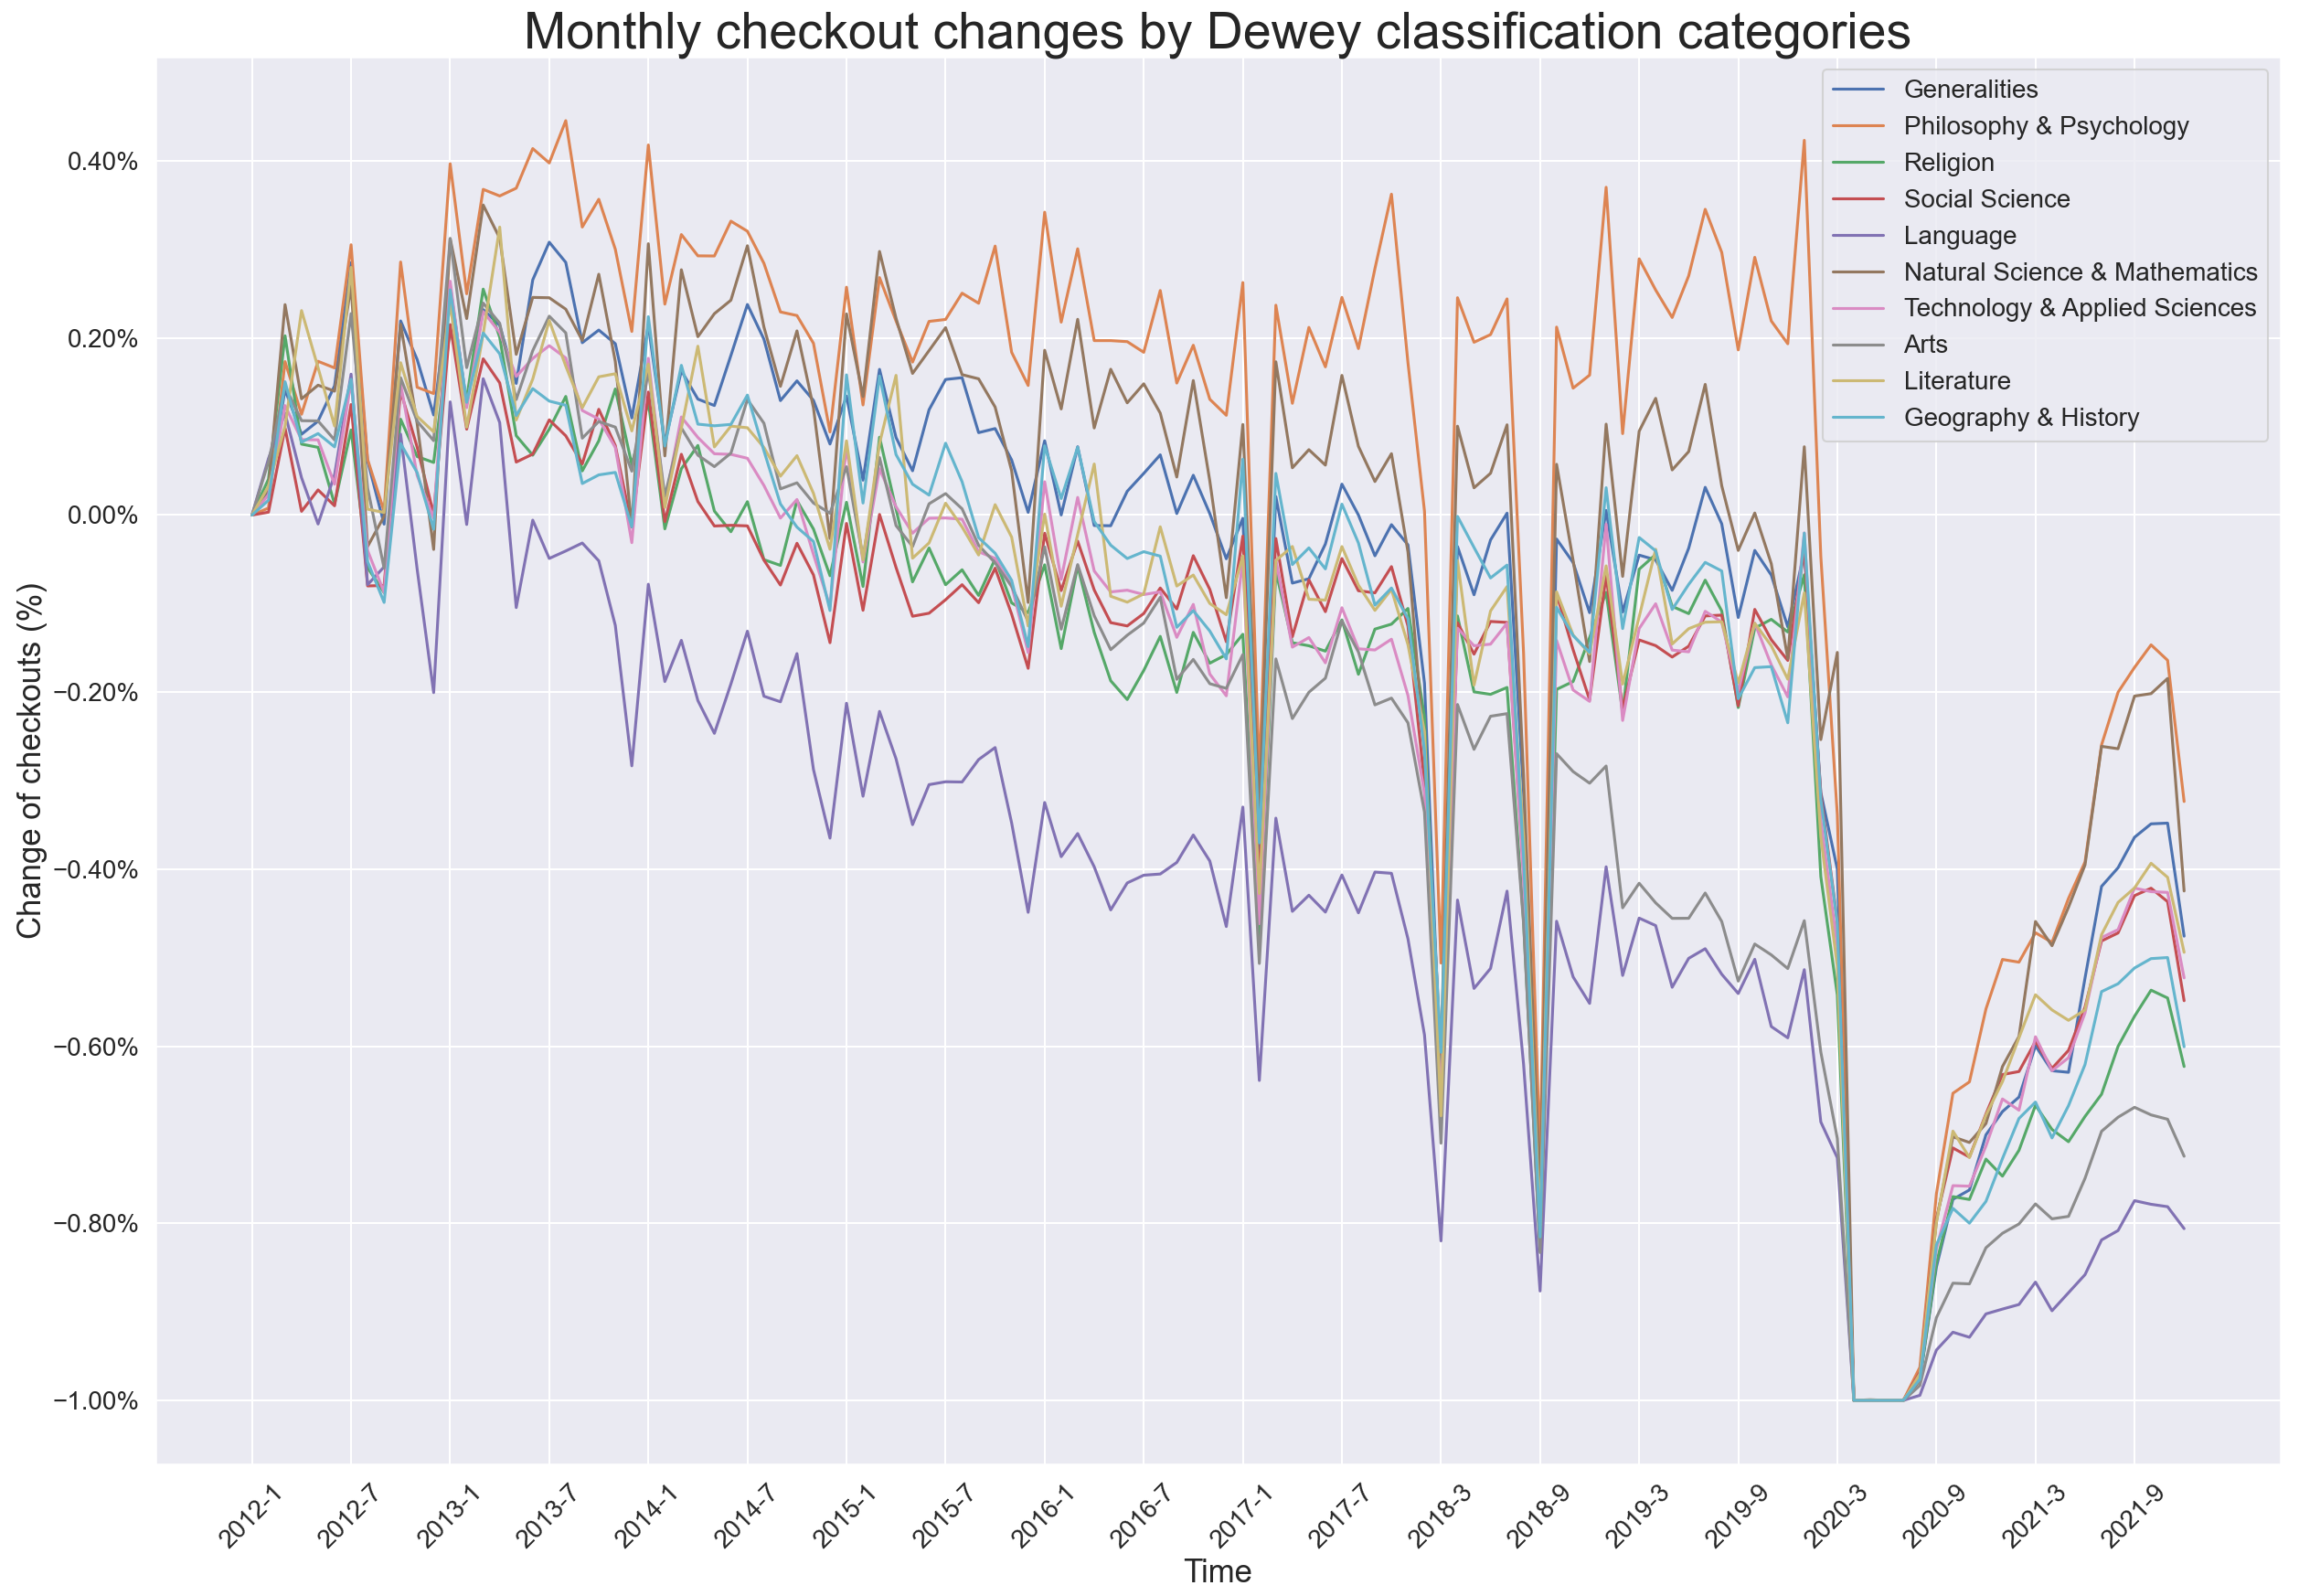
As one can tell from this figure, there have been 4 major drops in monthly checkout numbers in the past 10 years. The biggest one happened in March 2020, due to COVID, which is a reason that we are all aware of. However, there are 3 other major drops, which are in February 2017, March 2018, and September 2018, respectively. The reasons behind those major drops are beyond my knowledge, which would be interesting if we can find out. Figure 3 demonstrates vividly how catastrophic and overwhelming the COVID pandemic is, as even after some extent of recovery, the current checkouts are not comparable to those in the past 10 years. In addition, the overall checkouts follow a downward trend in general (except one topic, philosophy and psychology). The reasons behind that could be twofold. People nowadays might be too busy to spare some dedicated time to reading. On the other hand, it might simply because that we can now read on all sorts of platforms, such as smart phones and tablets, thus leading to decreased demand for physical printed books.
As one can tell from this figure, there have been 4 major drops in monthly checkout numbers in the past 10 years. The biggest one happened in March 2020, due to COVID, which is a reason that we are all aware of. However, there are 3 other major drops, which are in February 2017, March 2018, and September 2018, respectively. The reasons behind those major drops are beyond my knowledge, which would be interesting if we can find out. Figure 3 demonstrates vividly how catastrophic and overwhelming the COVID pandemic is, as even after some extent of recovery, the current checkouts are not comparable to those in the past 10 years. In addition, the overall checkouts follow a downward trend in general (except one topic, philosophy and psychology). The reasons behind that could be twofold. People nowadays might be too busy to spare some dedicated time to reading. On the other hand, it might simply because that we can now read on all sorts of platforms, such as smart phones and tablets, thus leading to decreased demand for physical printed books.
Code