Checkouts and Performance Vehicles
MAT 259, 2022
Senyuan(Russell) Liu
Concept
The gasoline vehicle industry faces serious challenges as the EV (electric vehicle) industry grows rapidly over the last decade. As a person who loves the modification of vehicles and gasoline engines, I would love to have a look at the relationship between checkout times and people’s enthusiasm for performance vehicles. It arouses my interest whether people borrow more or fewer books, which related to vehicles fields, from the library. After comparing the checkout times and sales in different brands and related fields, I also pay attention to the stock price market and try to find out if there is a connection between the checkout time and stock price.
Query1
SELECT YEAR(cout) as 'Year',
sum(CASE WHEN instr(title, 'car' )>0 THEN 1 ELSE 0 END )'car',
sum(CASE WHEN instr(title, 'vehicle' )>0 THEN 1 ELSE 0 END )'vehicle',
sum(CASE WHEN instr(title, 'automotive' )>0 THEN 1 ELSE 0 END )'automotive',
sum(CASE WHEN instr(title, 'challenger' )>0 THEN 1 ELSE 0 END )'challenger' ,
sum(CASE WHEN instr(title, 'mustang' )>0 THEN 1 ELSE 0 END )'mustang',
sum(CASE WHEN instr(title, 'honda' )>0 THEN 1 ELSE 0 END )'honda',
sum(CASE WHEN instr(title, 'volkswagon' )>0 THEN 1 ELSE 0 END )'volkswagen',
sum(CASE WHEN instr(title, 'car repair' )>0 THEN 1 ELSE 0 END )'car repair',
sum(CASE WHEN instr(title, 'maintenance' )>0 THEN 1 ELSE 0 END )'maintenance',
sum(CASE WHEN instr(title, 'mechanic' )>0 THEN 1 ELSE 0 END )'mechanic'
from outraw
GROUP BY YEAR(cout)
Query2
select (YEAR(cout)) AS year, COUNT(*) AS count
from spl_2016.outraw
where (
LOWER(title) like '% car %'
or LOWER(title) like '% automotive %'
or LOWER(title) like '% honda %'
or LOWER(title) like '% mustang %'
or LOWER(title) like '% challenger %'
or LOWER(title) like '% volkswagon %'
or LOWER(title) like '% subaru %'
)
GROUP BY YEAR(cout)
ORDER BY YEAR(cout)
Results
Here are the results from MySQL code.
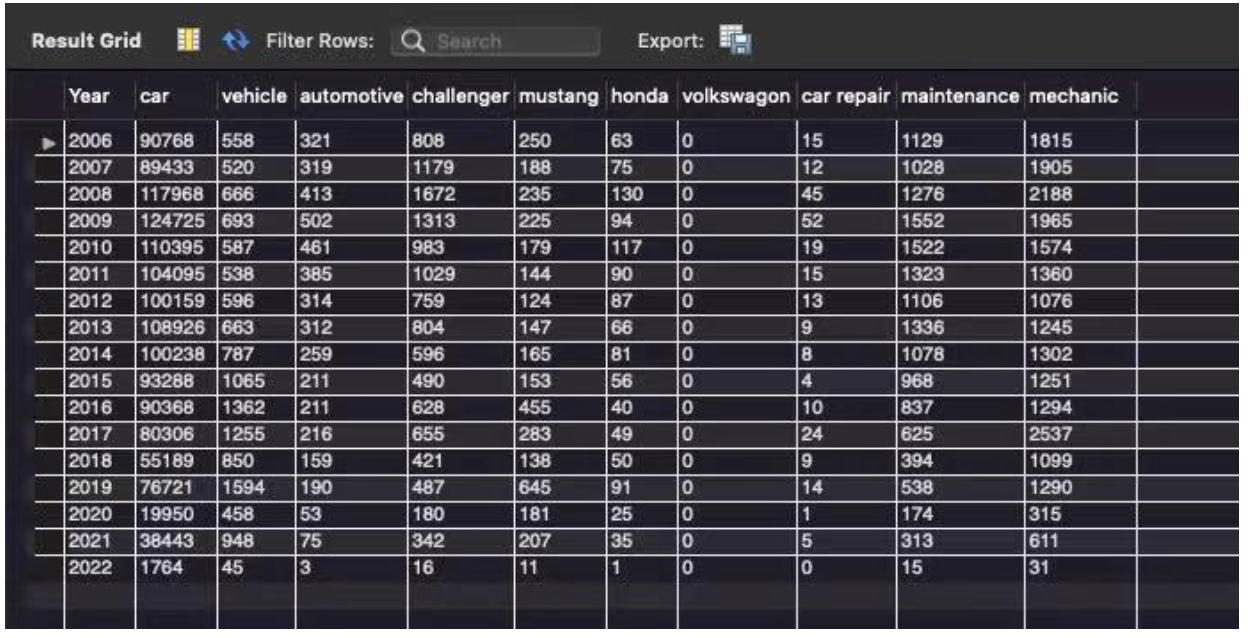
Part1
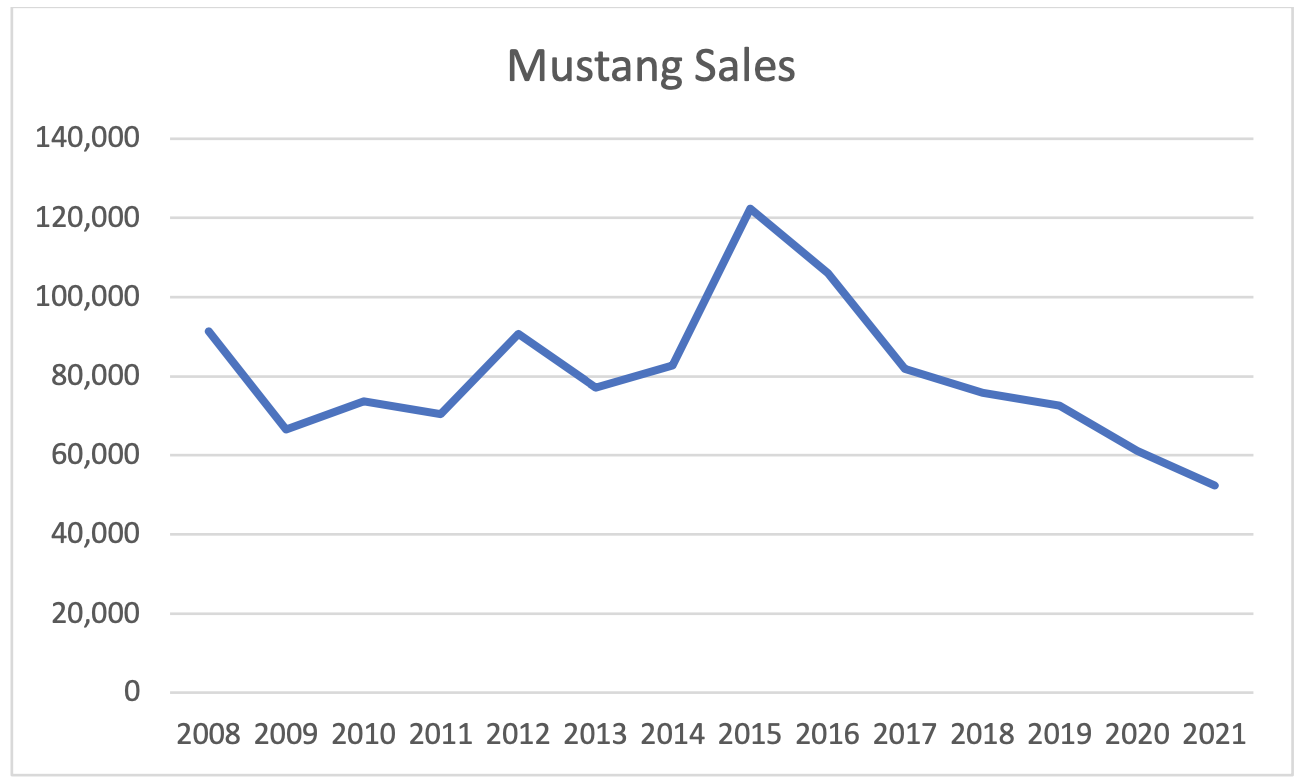
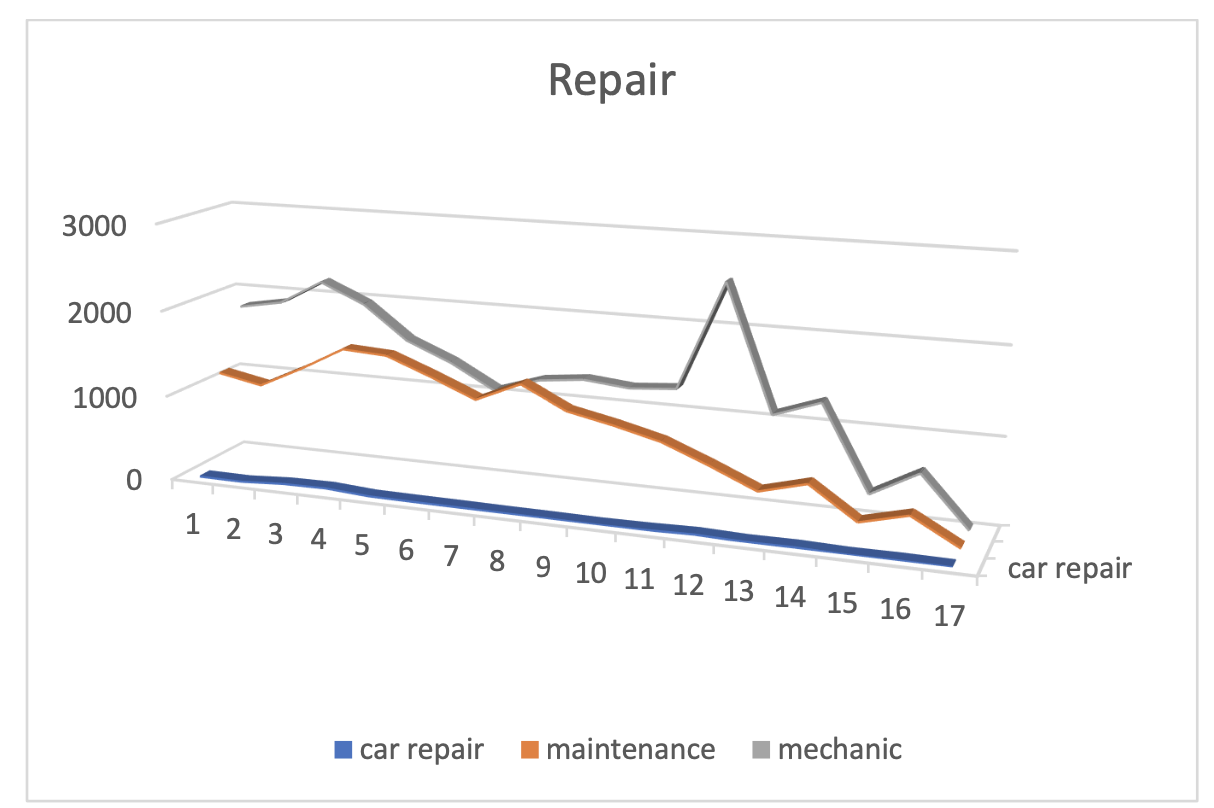
To analyze more detail, I choose to visualize the data and separate it into Brand checkouts and Repair. Firstly, let’s look at Fig 1.3, which is the summary of Brand Checkouts. We could get such information for example: Challenger is no doubt American’s favorite vehicle, and it makes sense because we are using the data from a U.S library. Take Ford Mustang as an example, from 2006 to 2021, the checkout times of Mustang is steady except in the Year 2014 to 2016. There is a dramatic increase and decrease in this period. Therefore, I fetch the data of Mustang sales from 2008 to 2021 from the “GoodCar Automotive Data&Statistic” website and visualize it in order to find out if such fluctuation is related to sales.
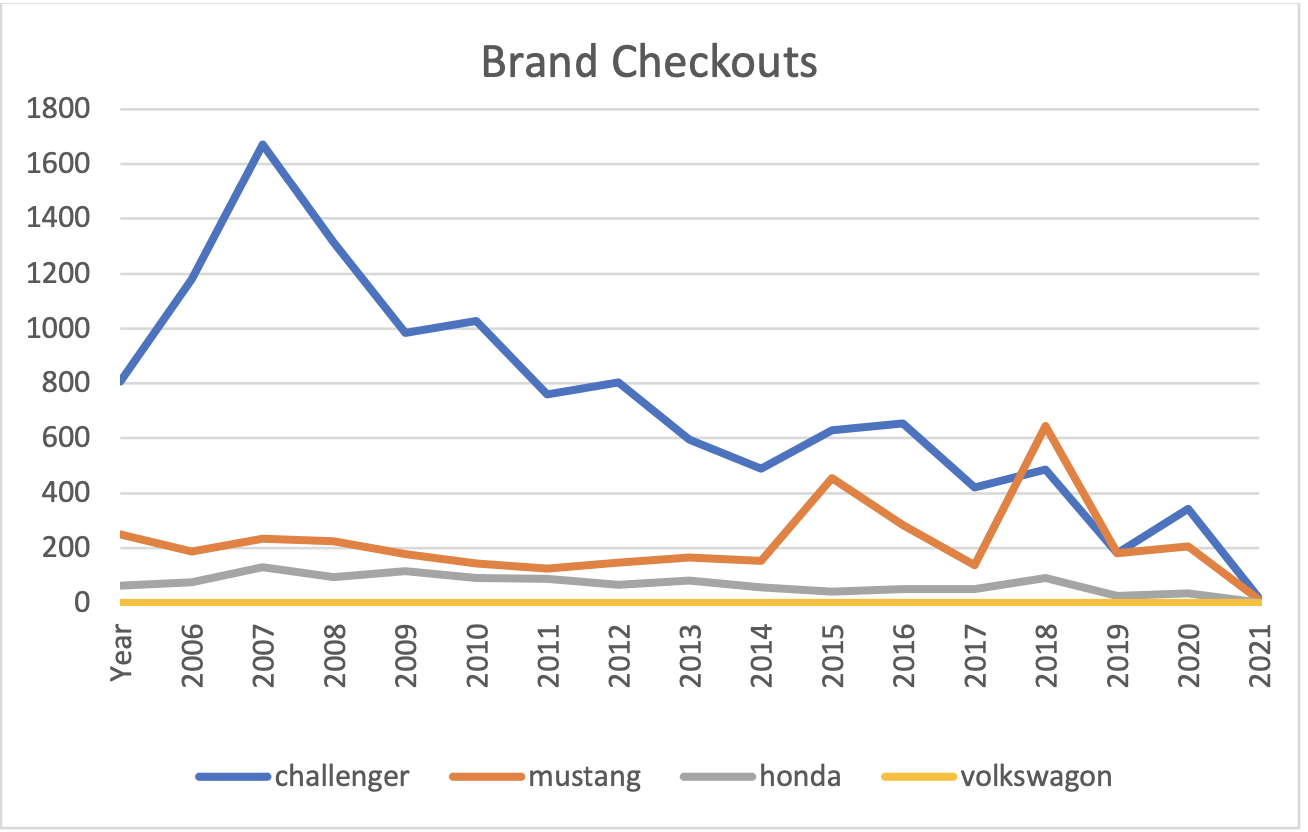
As we can see, in the period of 2014 to 2016, the fluctuation of sales looks very similar to the fluctuation of checkout times. And the reason behind this, I think it is all about the new release version of the Sixth generation of Mustang, including the brand new 2.3 Ecoboost I4 and 5.0 V8.
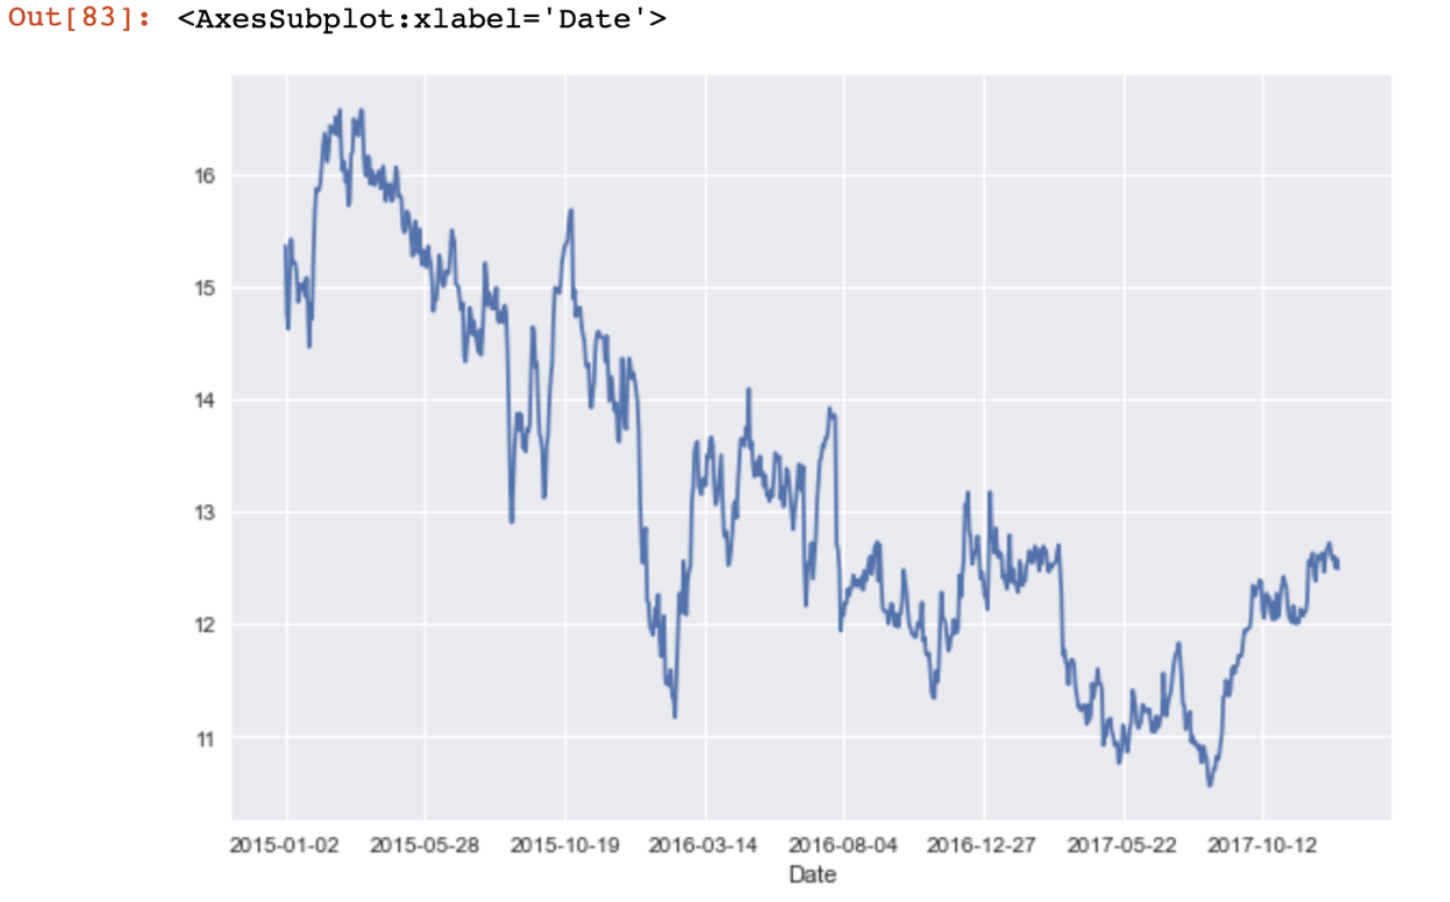
As a student majoring in Financial Mathematics, I wonder does it have some connection to the stock price? Therefore, I, again, fetch Ford’s stock price data from Yahoo Finance. And here is the visualized data. We can clearly see that the stock price is continuously decreasing from 2014 to 2017. Theoretically, it shows that the product of Ford (in this case, Mustang) is not welcome in the market and the sudden increase of sales from 2014 to 2015 is contributed to the new release of the model. After months, it backed normally.
As we can see, in the period of 2014 to 2016, the fluctuation of sales looks very similar to the fluctuation of checkout times. And the reason behind this, I think it is all about the new release version of the Sixth generation of Mustang, including the brand new 2.3 Ecoboost I4 and 5.0 V8.
As a student majoring in Financial Mathematics, I wonder does it have some connection to the stock price? Therefore, I, again, fetch Ford’s stock price data from Yahoo Finance. And here is the visualized data. We can clearly see that the stock price is continuously decreasing from 2014 to 2017. Theoretically, it shows that the product of Ford (in this case, Mustang) is not welcome in the market and the sudden increase of sales from 2014 to 2015 is contributed to the new release of the model. After months, it backed normally.
Part2
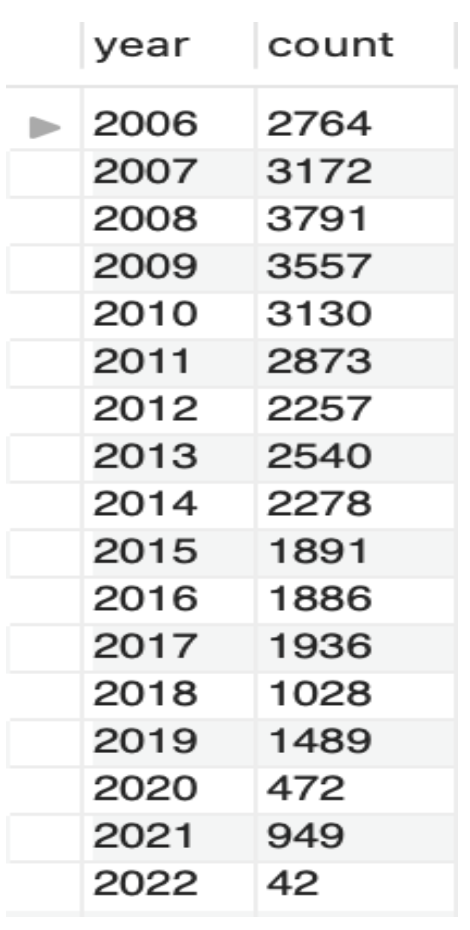
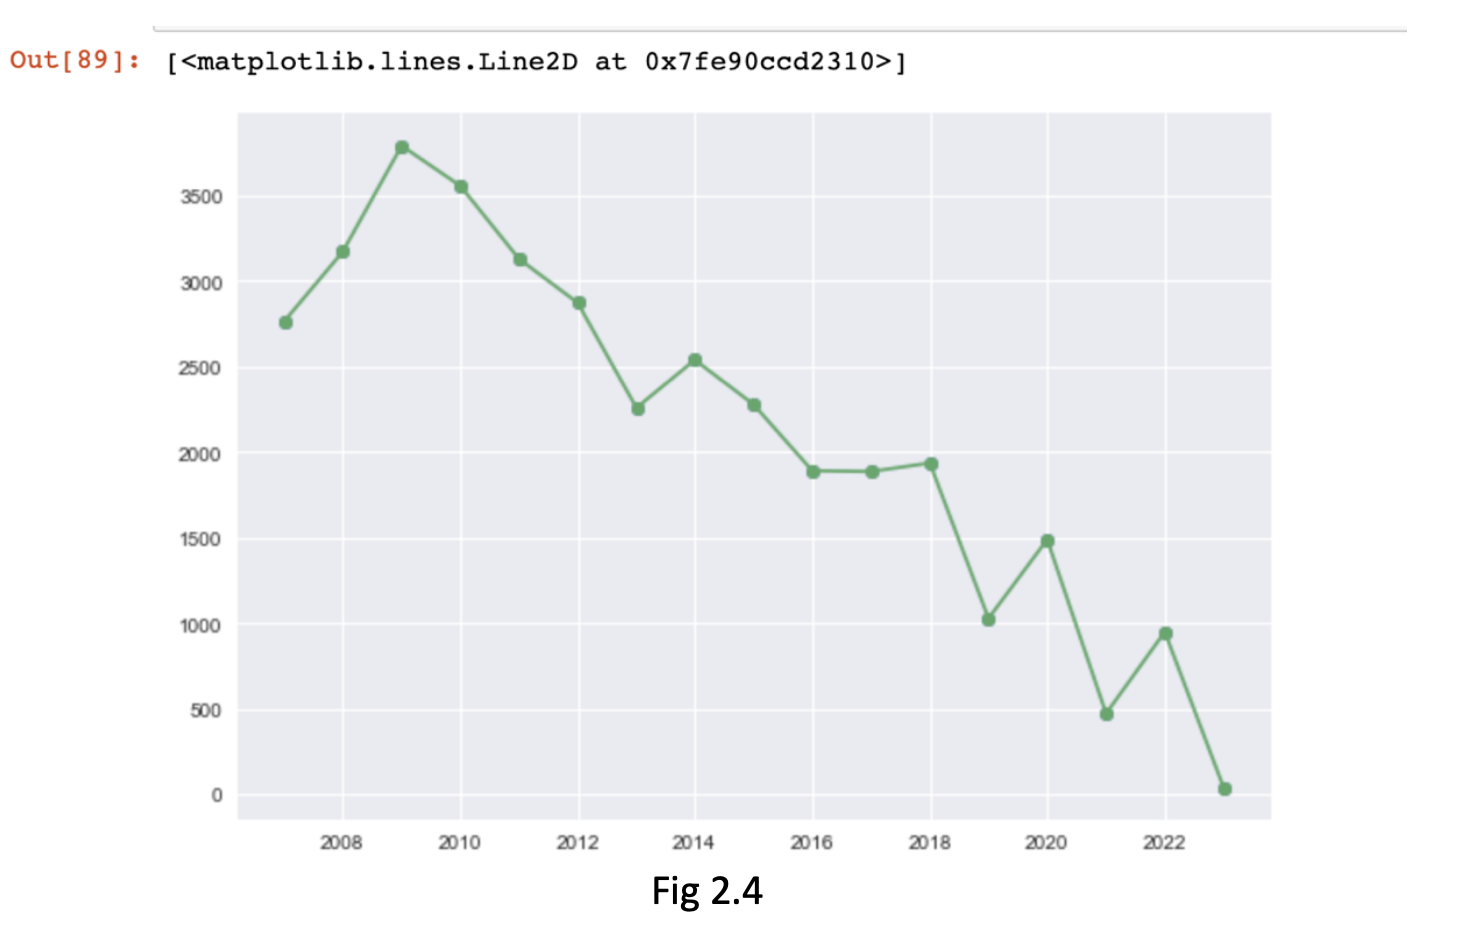
To look more directly at how people’s general enthusiasm for vehicles correlates to checkout times, I wrote this query code (Fig 2.2) to calculate the sum of all fields that are related to vehicle and brands. To be more specific, it is a simplified version of the code in part 1. From the column of spl_2016.outraw, I try to find out all the checkout books whose titles have the following keywords: car, automotive, Honda, Mustang, Challenger, Volkswagen, and Subaru. Then, I sum the number of counts and groups by year from 2006 to 2022.
From Fig 2.4, we can see that the total number of checkout books related to (performance) vehicles is downtrend especially in year 2020 to 2022. One of the reasonable possibilities is that people are not borrowing books when there was a pandemic that happened in 2020. People stop buying vehicles, stop modifying vehicles, and thus stop borrowing related books from library. Other than that, as a huge fan of Volkswagen GTI and owner of GTI MK7, it is upset to see that no one is borrowing any book that is related to Volkswagen!
Based on what we analyzed above, it can be inferred that people’s enthusiasm for performance cars and modifications is decreasing. It’s highly possible that no one is interested in gasoline vehicles anymore in the future decades. In recent years, almost all the leading companies in the industry start working on new electric vehicles but not gasoline ones. However, I believe there is always someone, like me, who are interested in modification and gasoline engines. And I don’t believe gasoline and performance vehicles will become history in the future.
Code