American Population Status Analysis during 2016 Presidential Election
MAT 259, 2020
Yulei Yuan
Data and Motivation
For my project, I want to make a 3-D visualization on the status of people who voted in the 2016 presidential election. I got the data from my previous statistical class. In that class, we did an intensive research on why Hilary lost in the election with her success in the popular vote, while in MAT 259, I want to focus on the life status of the voters in the election.
Query
Modifications have been used to applied to the data for the visualization using R. I gathered information on a state level and combined certain columns into new variables that I create. The names of states has been recoded into numerical values for mapping purpose.
census.del <- census %>% na.omit() %>%
mutate(Men = Men/TotalPop*100) %>%
mutate(Employed = Employed/TotalPop*100) %>%
mutate(Citizen = Citizen/TotalPop*100) %>%
mutate(Minority = Hispanic+Black+Native+Asian+Pacific) %>%
dplyr::select(-c(Hispanic,Black,Native,Asian,Pacific,Walk,PublicWork,Construction,Women))
census.subct<-census.del %>% group_by(State,County) %>%
add_tally(TotalPop) %>%
rename(CountyTotal=n) %>%
mutate(Weight=TotalPop/CountyTotal)
census<-census.subct %>% group_by(State) %>%
mutate_at(vars((Men:CountyTotal)),
funs(.*(Weight))) %>%
summarize_at(vars((Men:CountyTotal)),
funs(sum))
write.csv(census, "~/MAT 259/census.csv")
census_state_number<-census.state[,"State"]%>% mutate_if(is.factor,as.numeric) write.csv(census_state_number, "~/MAT 259/census_state_number.csv")
Concepts
For a dataset that has multiple information for an observation(here one observation is a state), a tree map with multiple layers would be a good way to display the data. Thanks to the tree map library by Ben Fry in Processing. The idea behind the concept is like this:
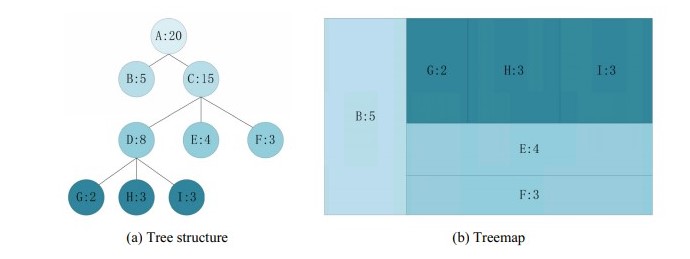
Here in my data, each tree stands for one status(population count, salary,etc.) that I'm intereted in. The size of sub-rectangles is decided by the counts of people for that status of all states. A larger number of count for one state will obtain a larger area. The order of these sub-rectangles is automatically decided by the algorithm.
Here in my data, each tree stands for one status(population count, salary,etc.) that I'm intereted in. The size of sub-rectangles is decided by the counts of people for that status of all states. A larger number of count for one state will obtain a larger area. The order of these sub-rectangles is automatically decided by the algorithm.
Process
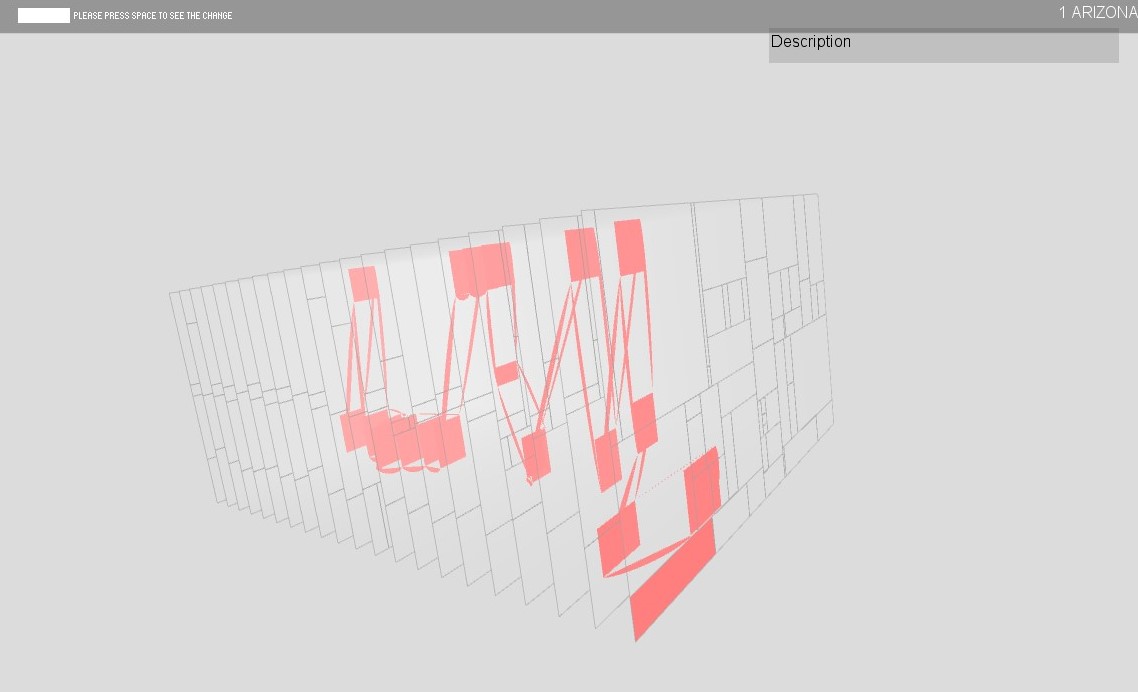
At first, the map for the state was wrong since it should started with Alaska instead of Arizona, also no description was added to the graph with a valid way. The program would crush if I selected a state with a number that is greater than 50.
Final result
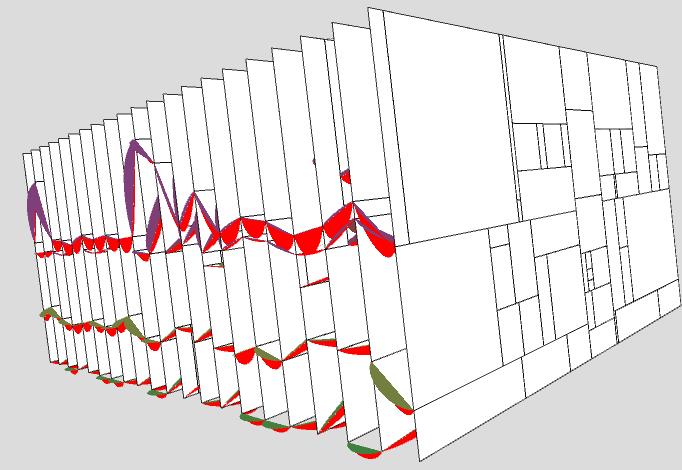
Overview of the final version with description texts.
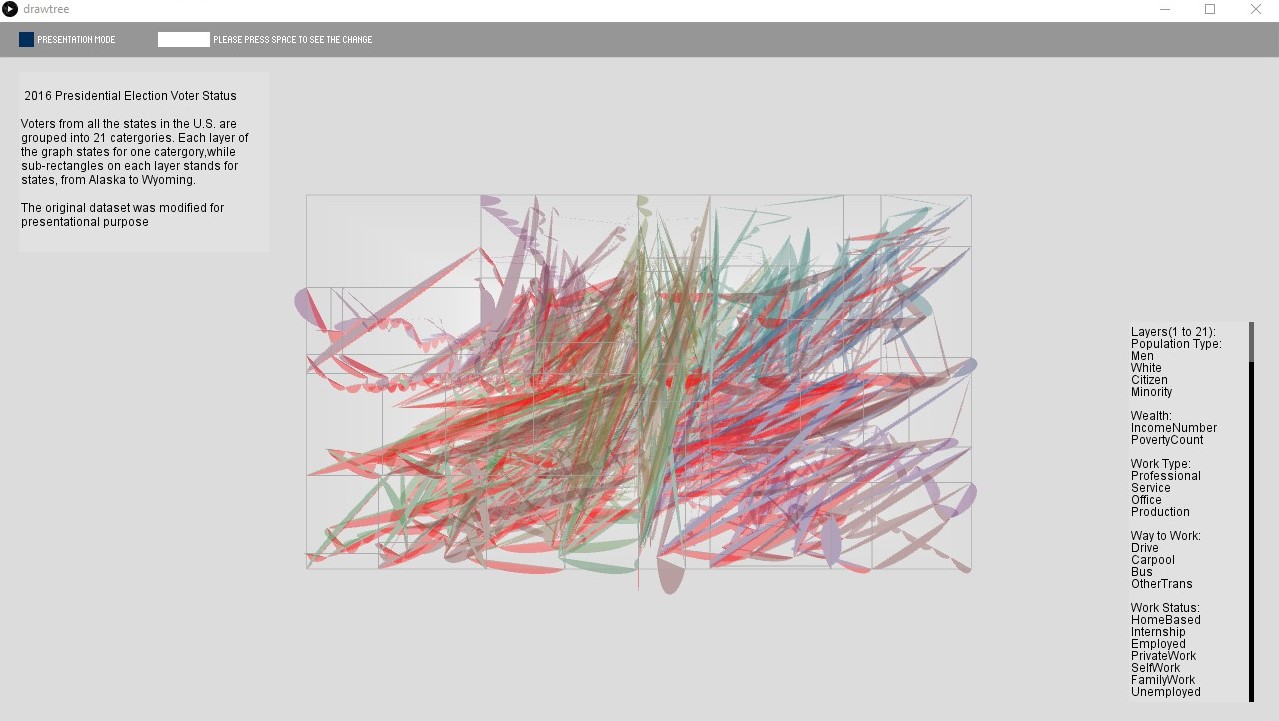
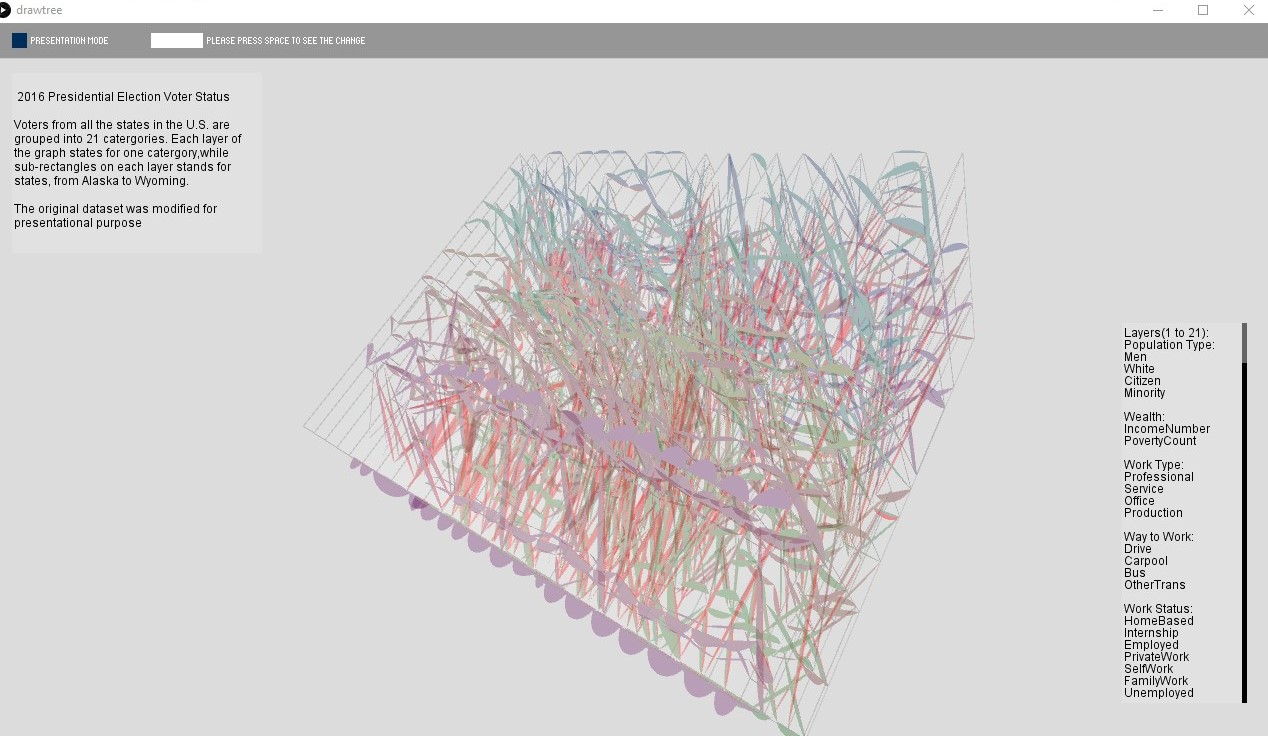
The colored line connects the sub-rectangles for the same state at different layers.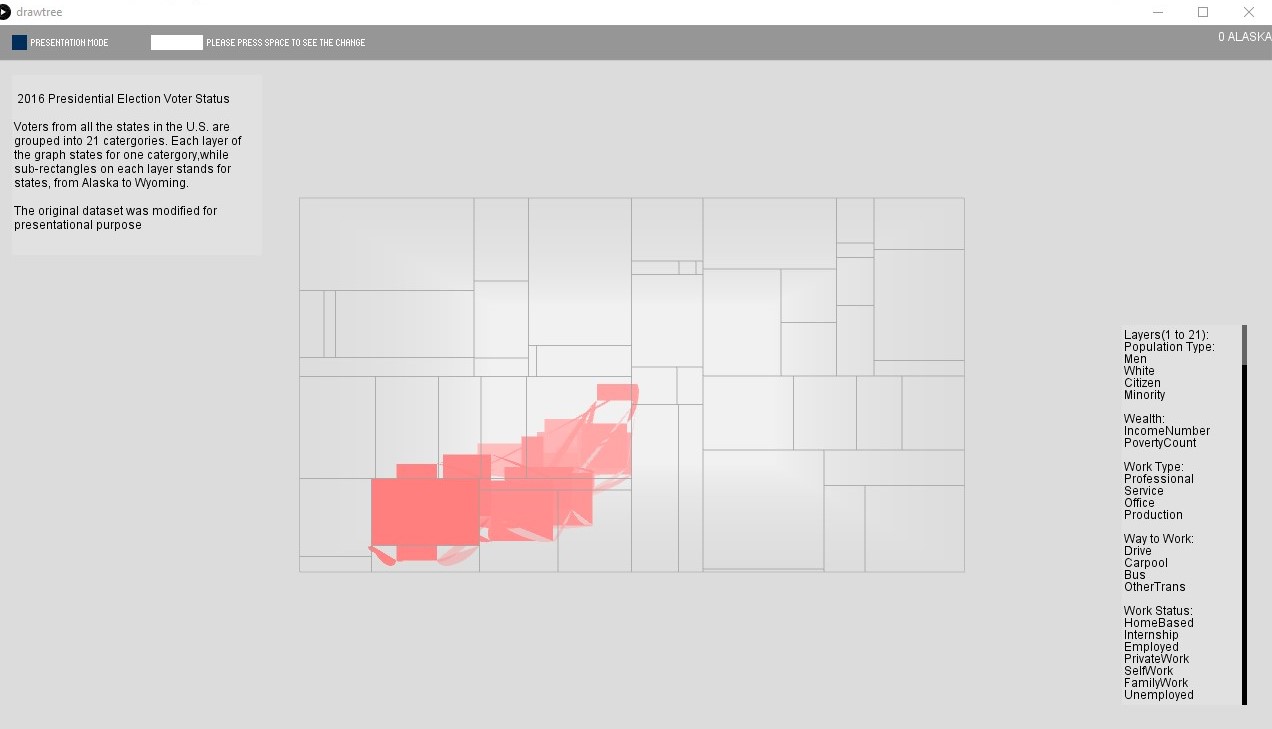
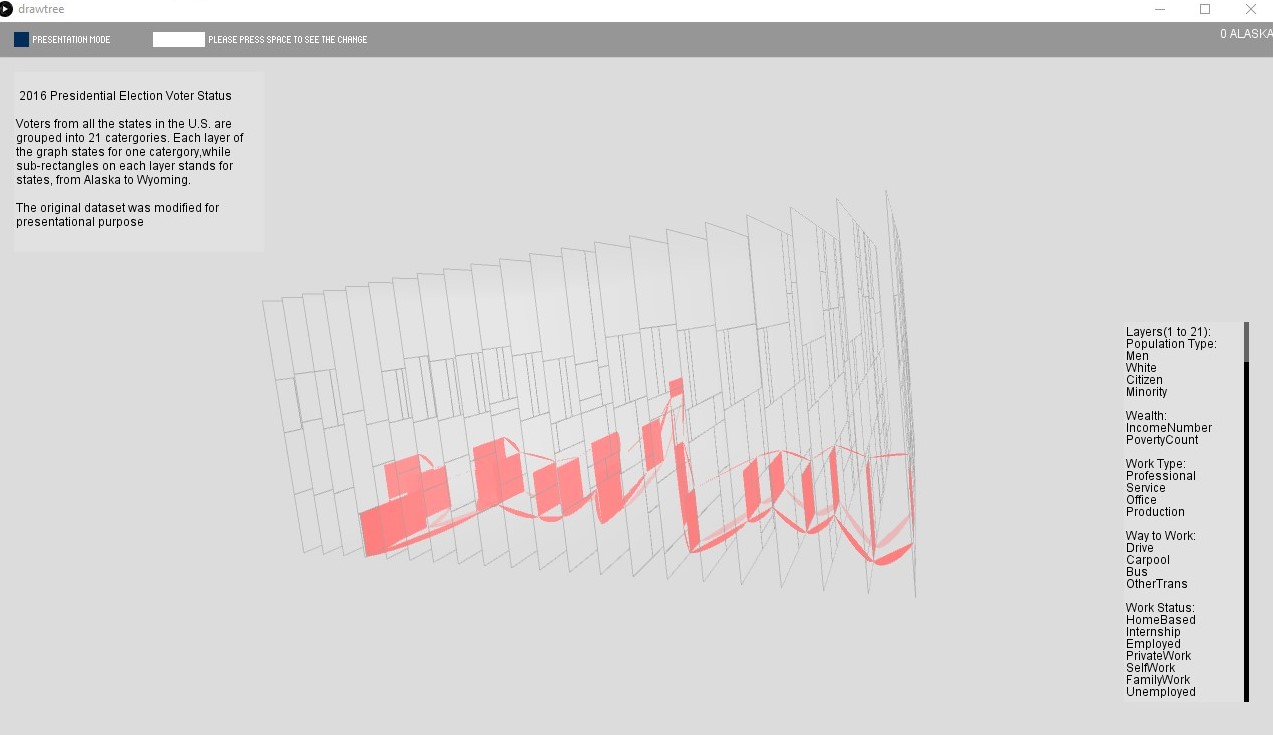
The viewer can also view a specific state by entering the state number at the white block above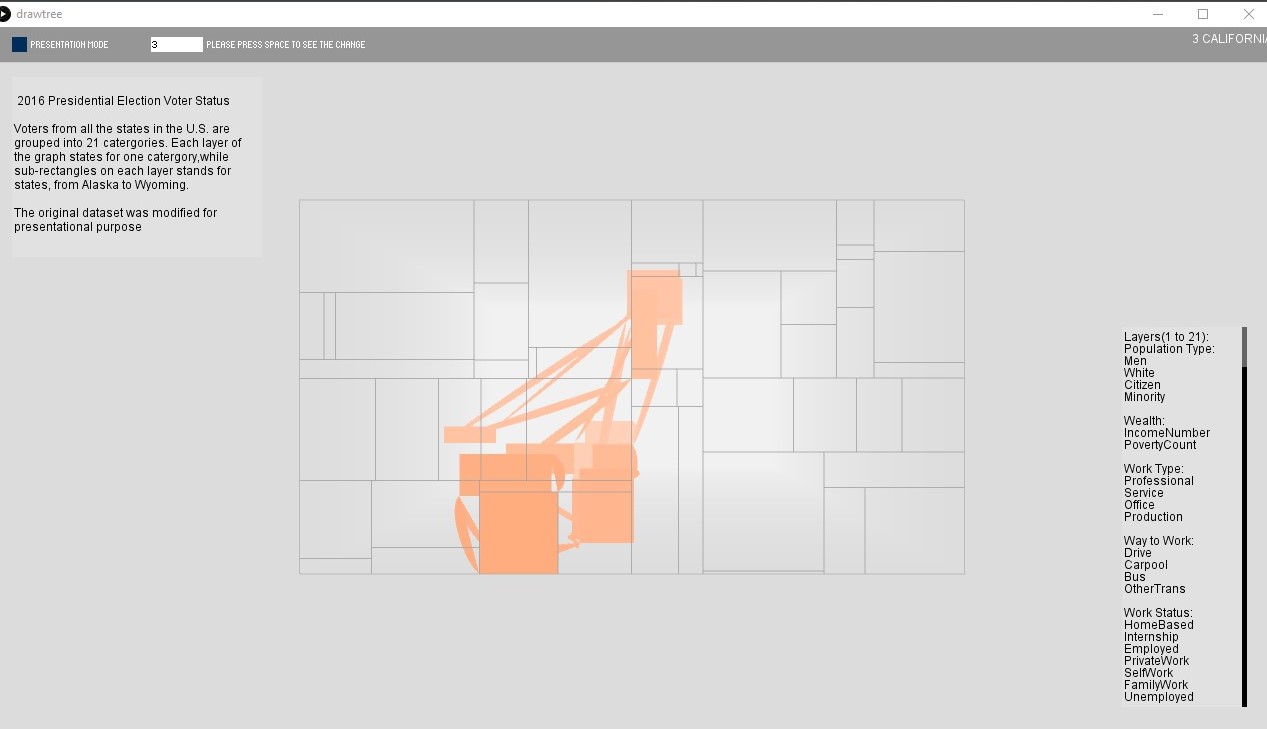
The colored line connects the sub-rectangles for the same state at different layers.
The viewer can also view a specific state by entering the state number at the white block above
Code