Game Sales from 2017 to 1980 of 4 Markets
MAT 259, 2020
Jingxuan Cao
Concept
The motivation of this project is I am a gamer that I have played different games for a decade. I am able to show the trends of games in different regions from 1980 to 2020 with the dataset of games' sales. There are rank, games' name, platform, year, genre, publisher, NA_sales, EU_sales, JP_sales, other_sales, and global_sales. After I finish data visualization, we can find out the game trends of the game genre in each region of every year from 1980 to 2017.
Query
The dataset is from kaggle video game sales.
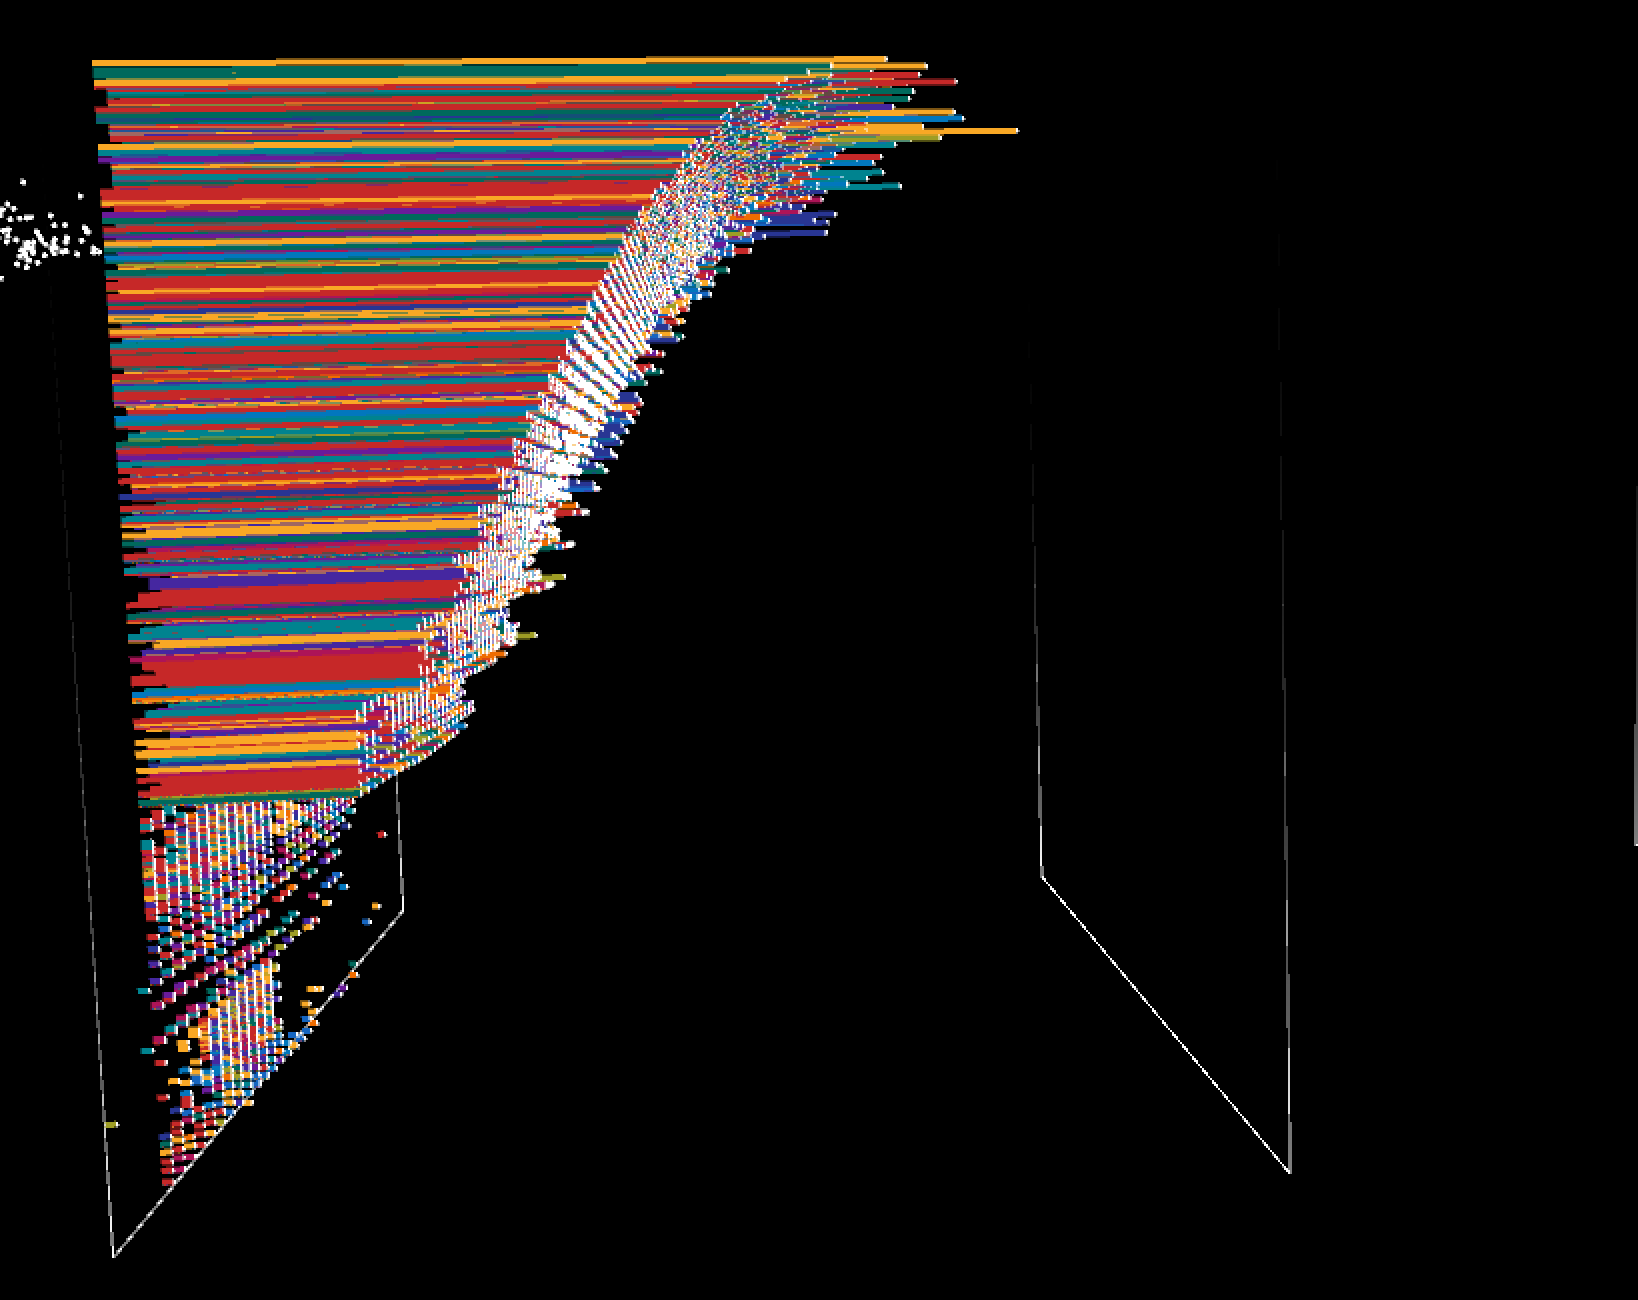
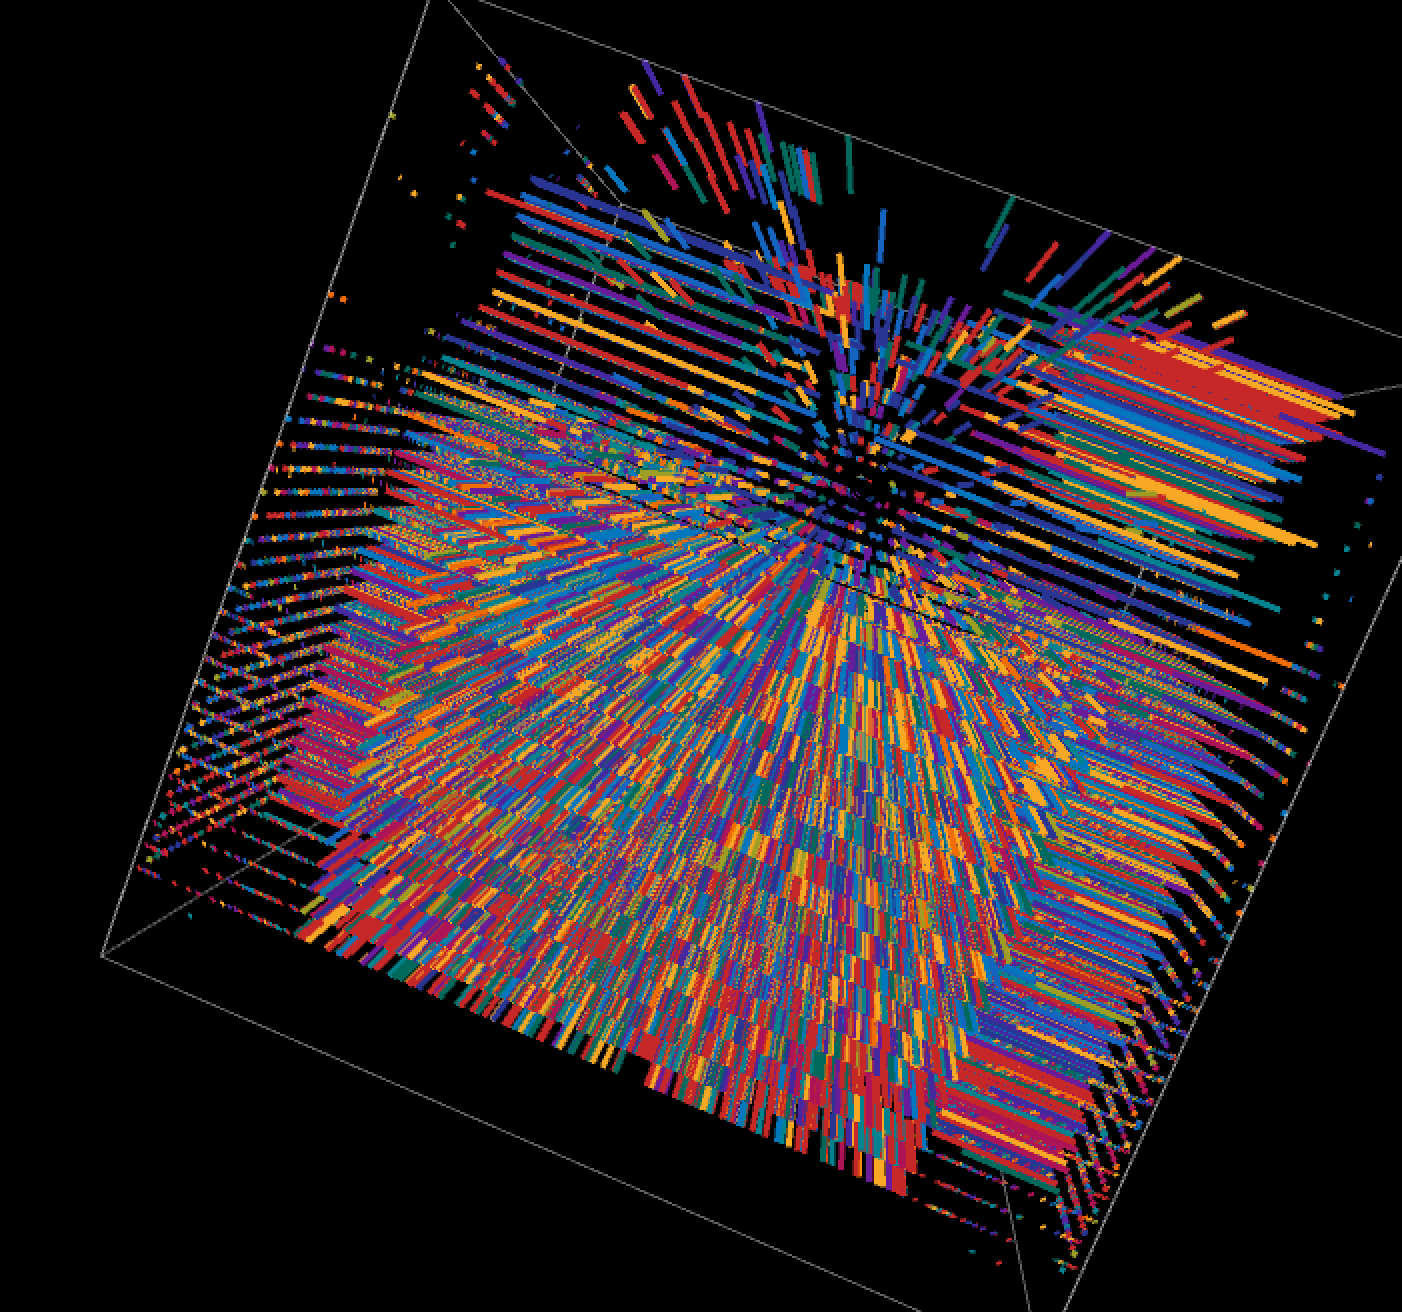
Preliminary sketches
Here is a test version of my project that I want to know how does the data look like and how is the distribution of the numbers.
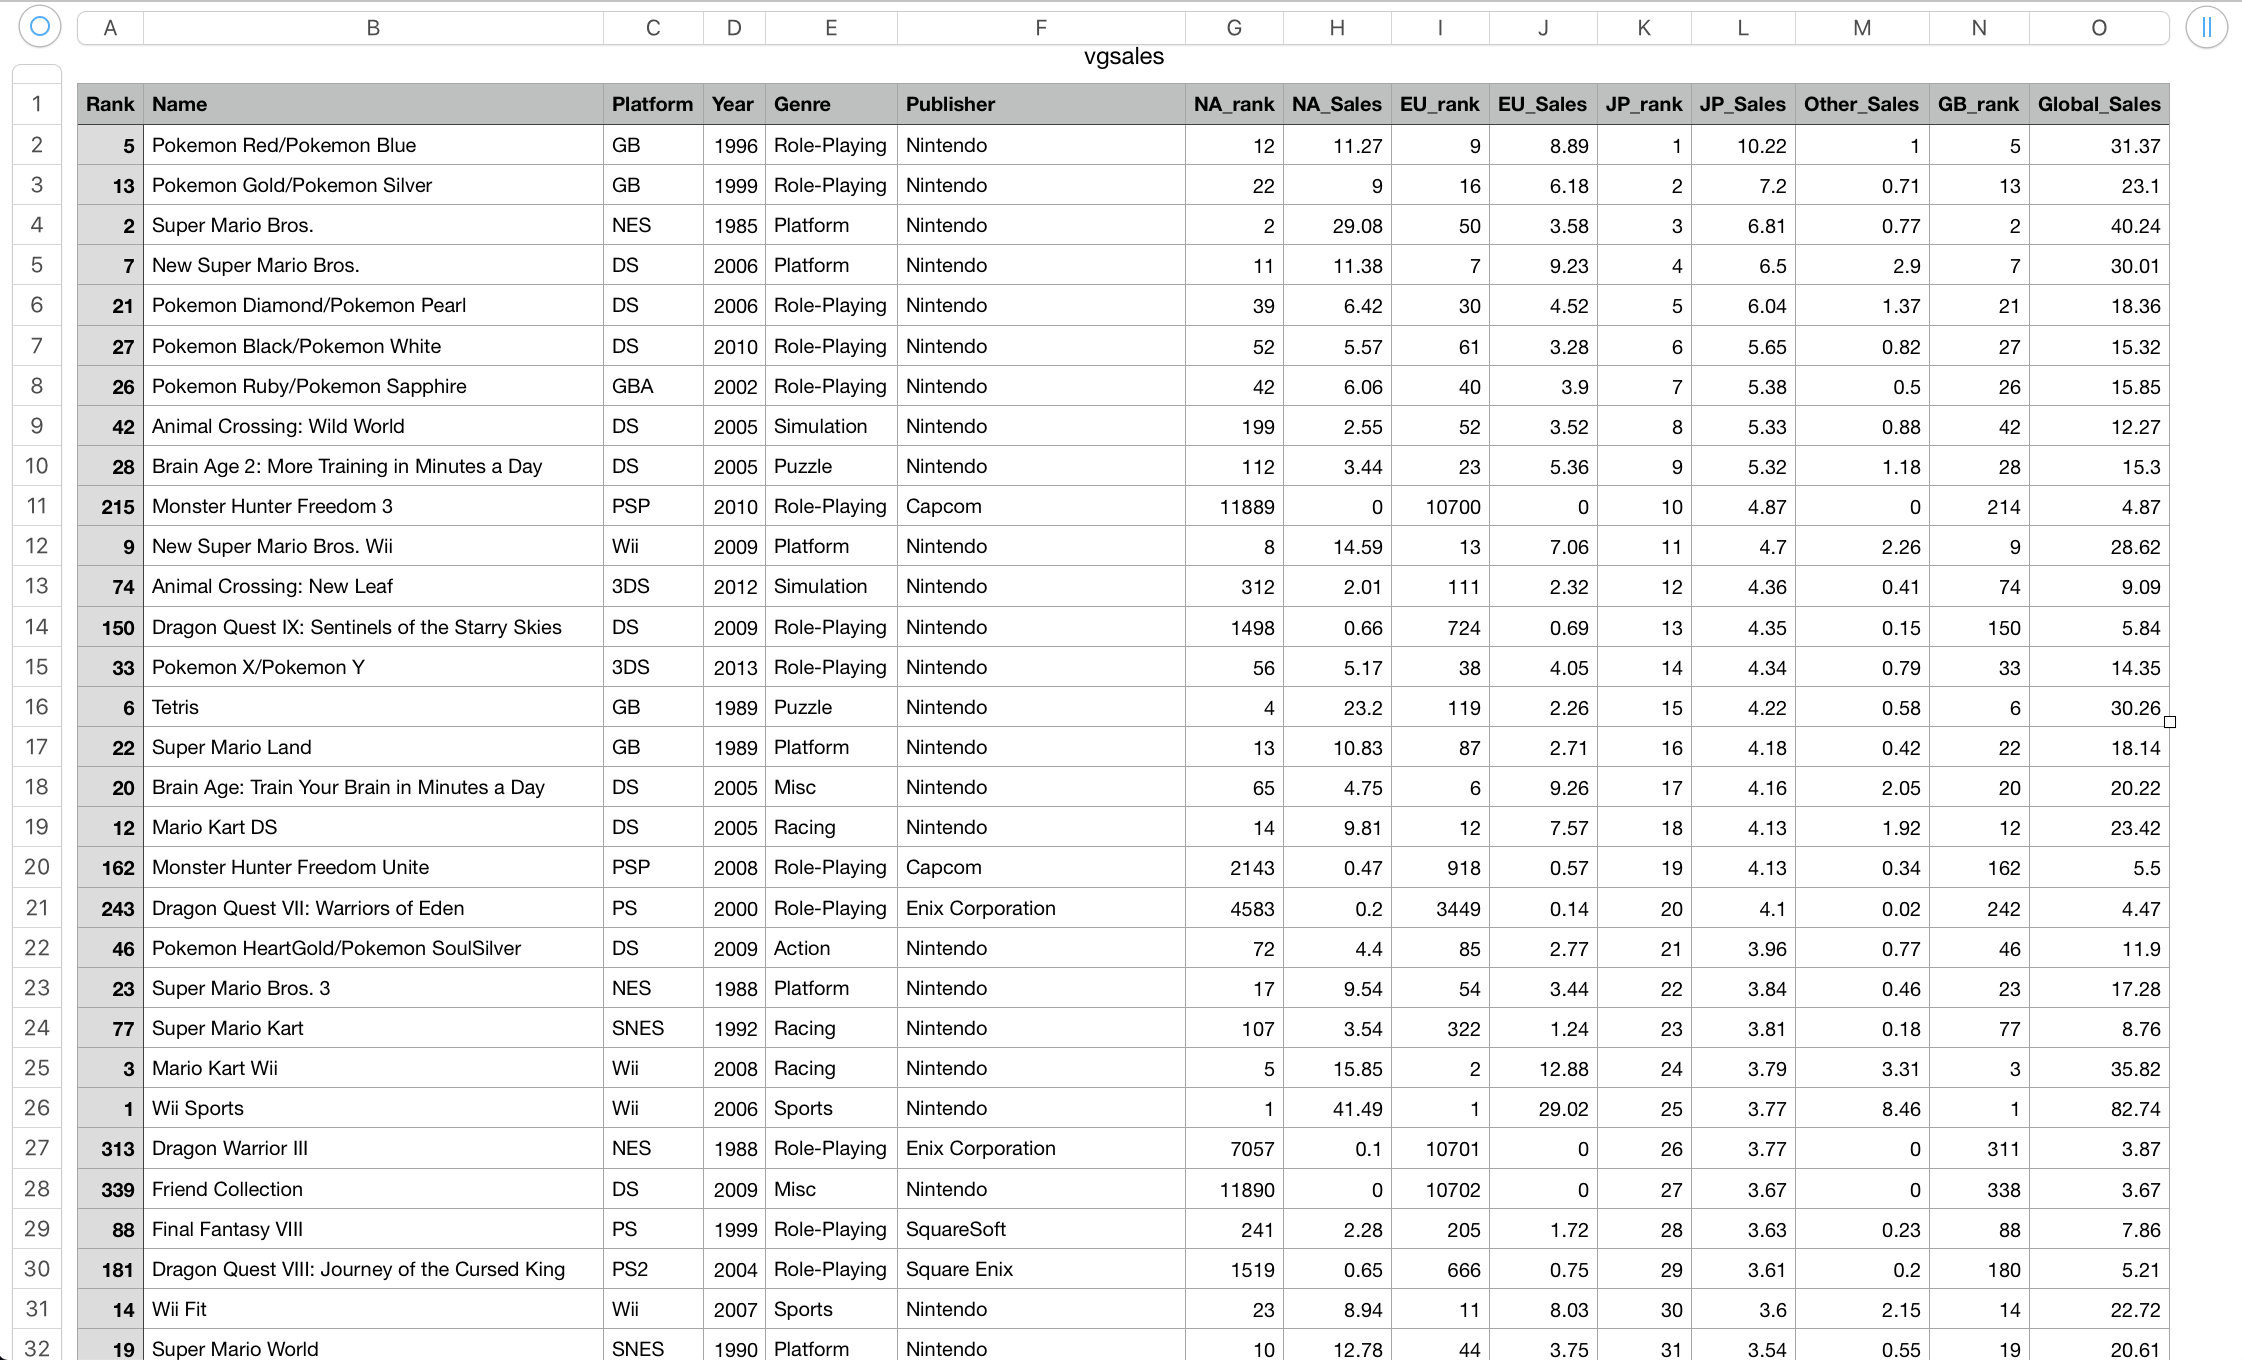
Process
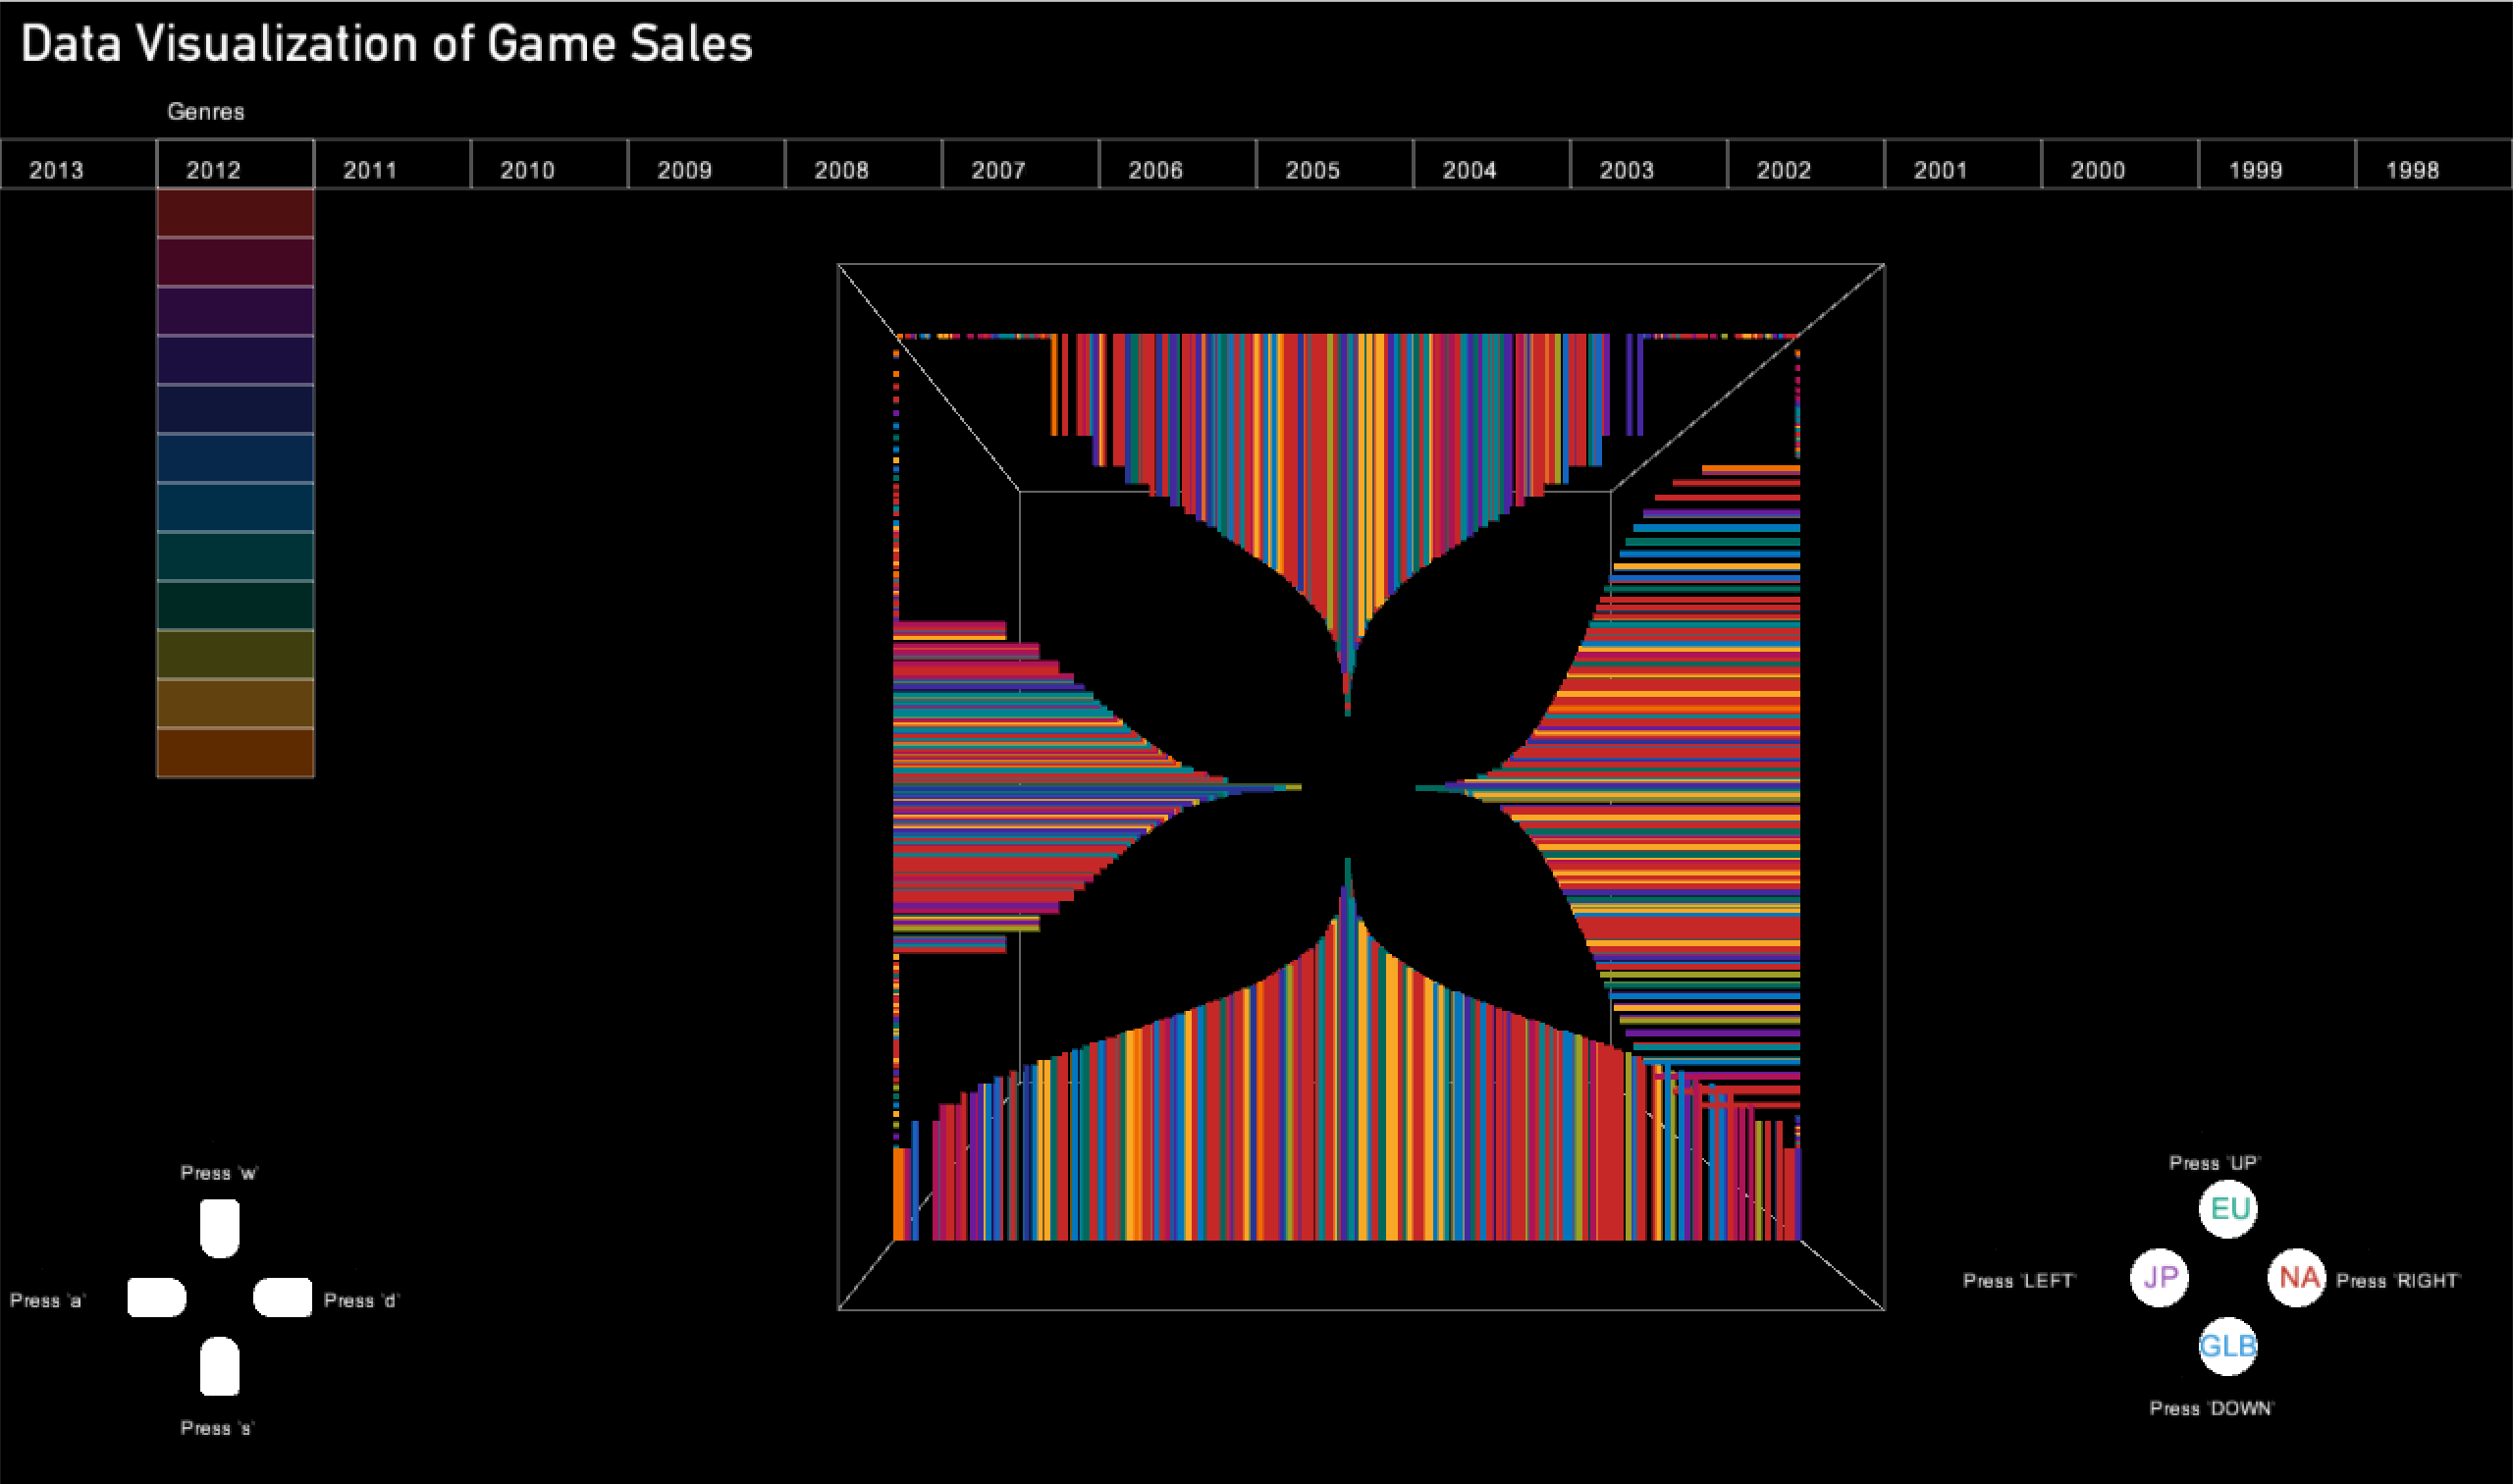
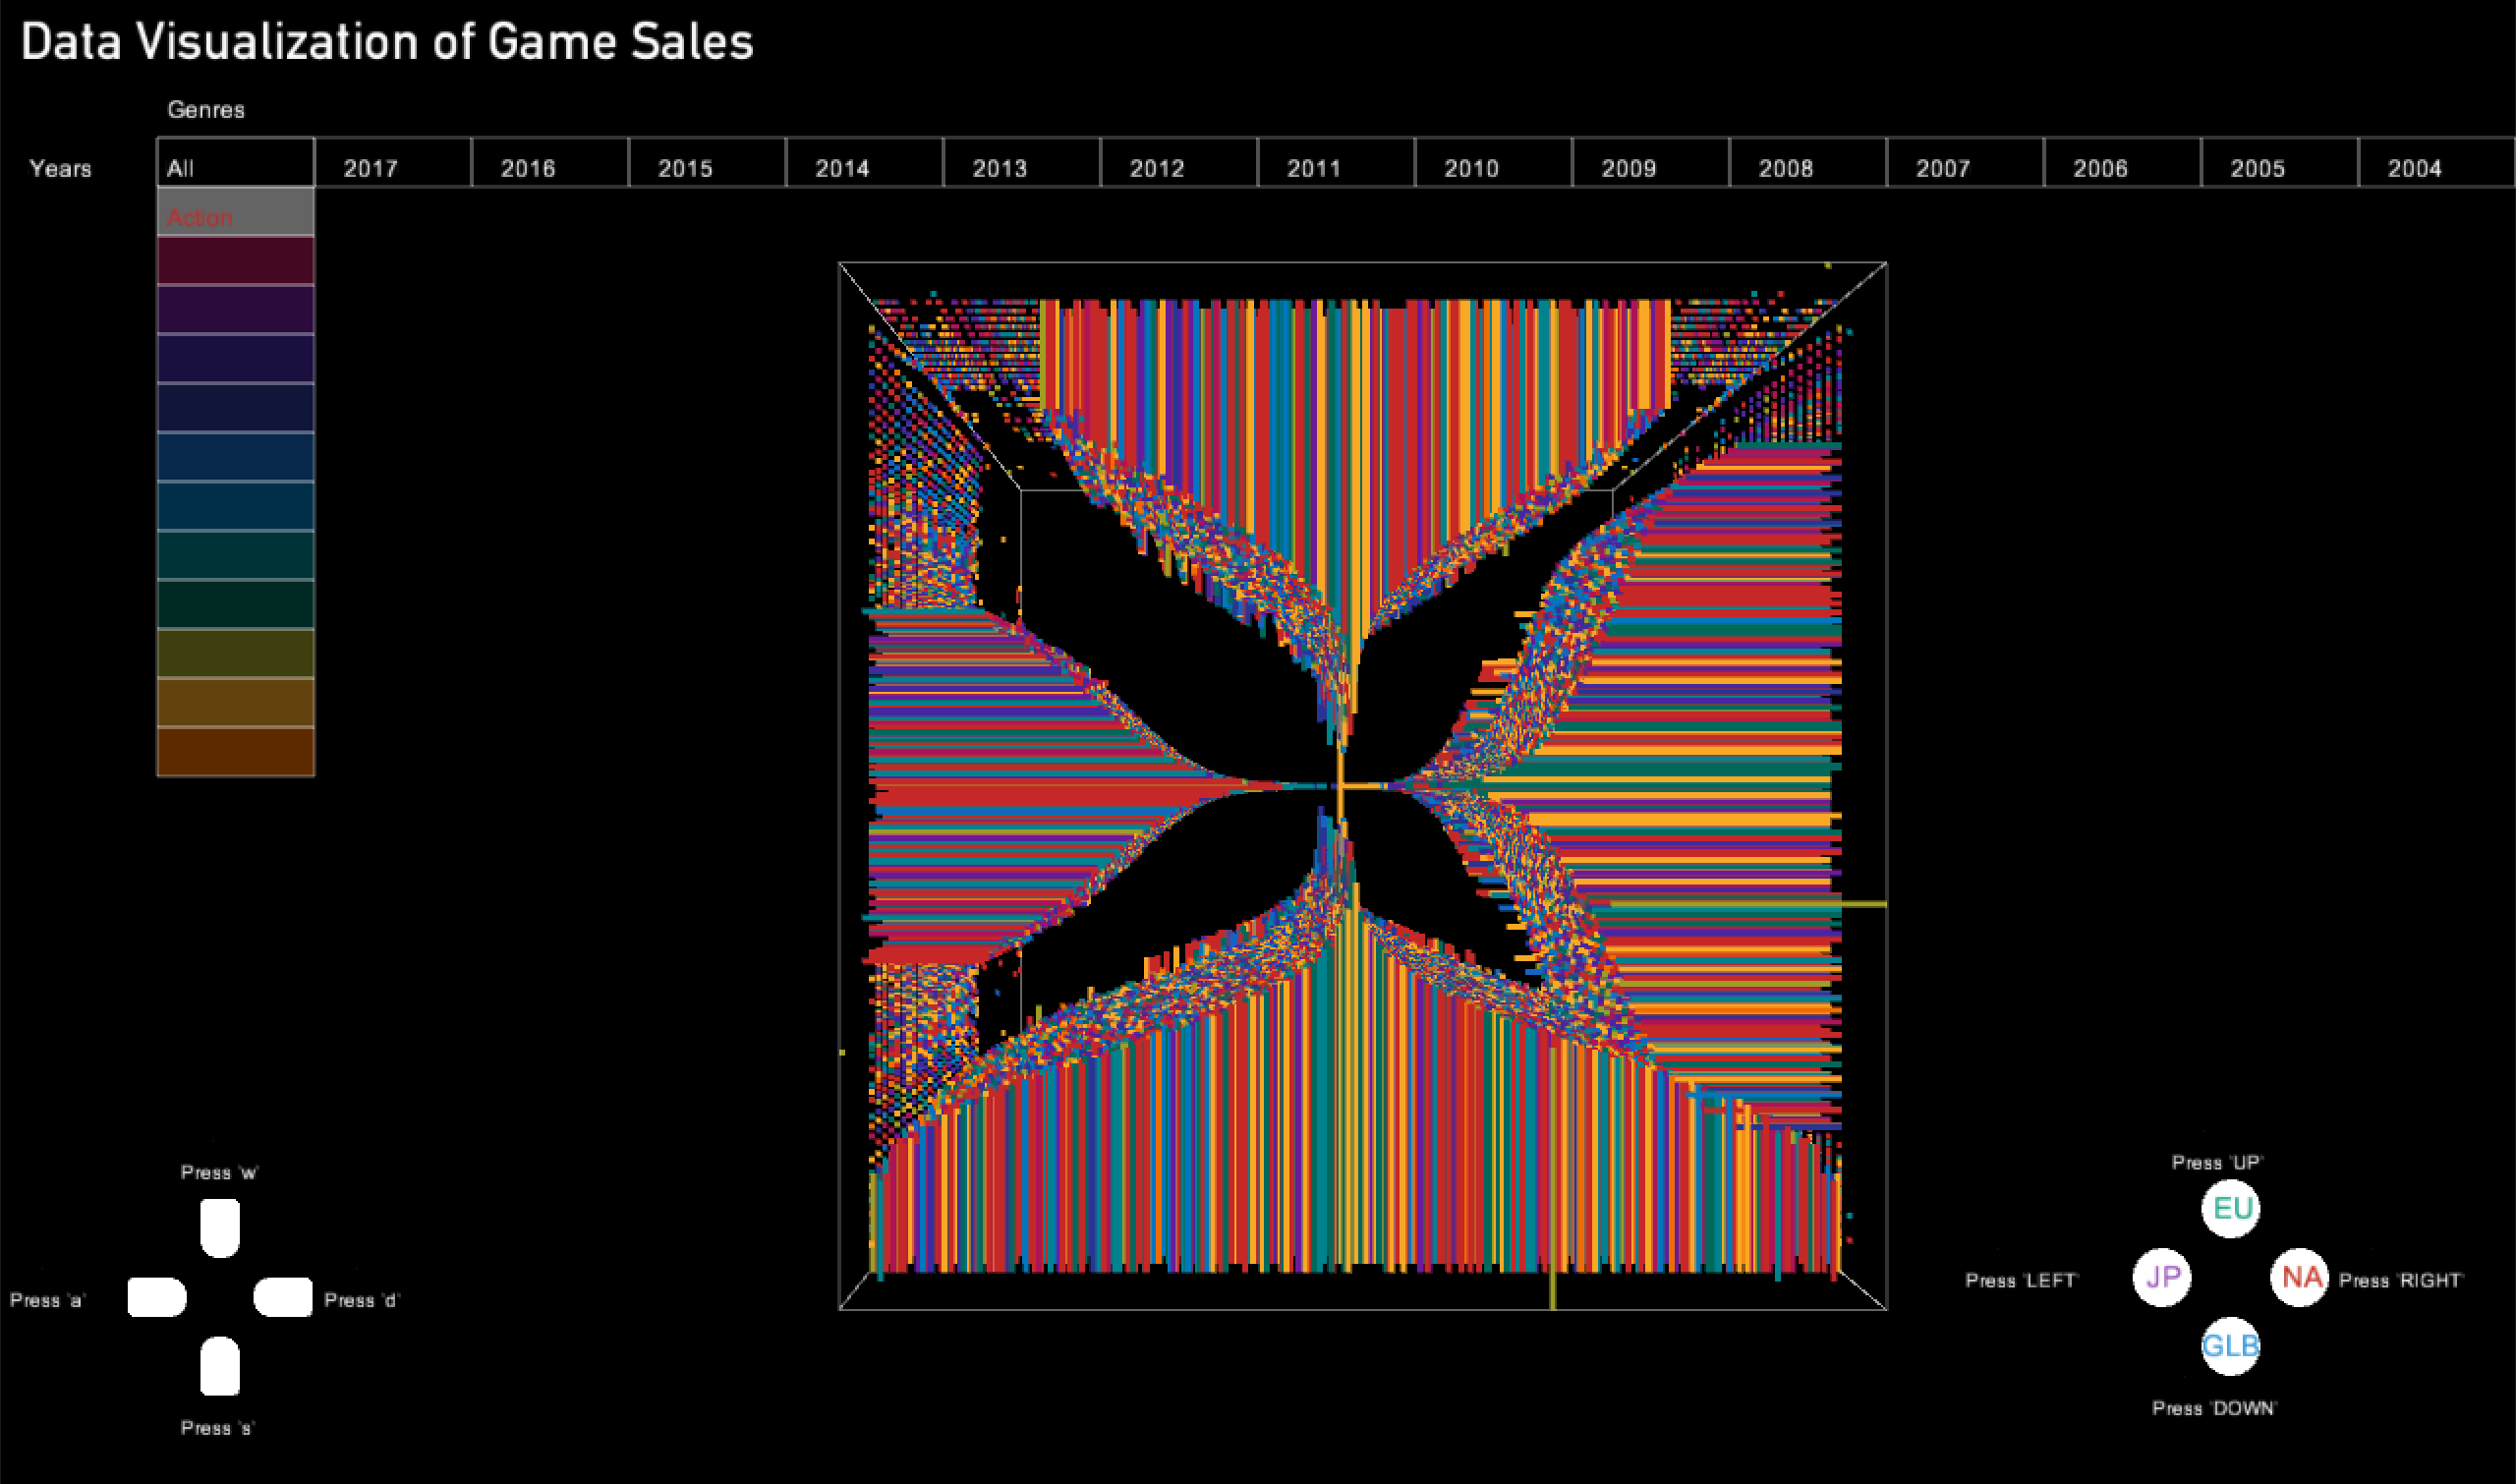
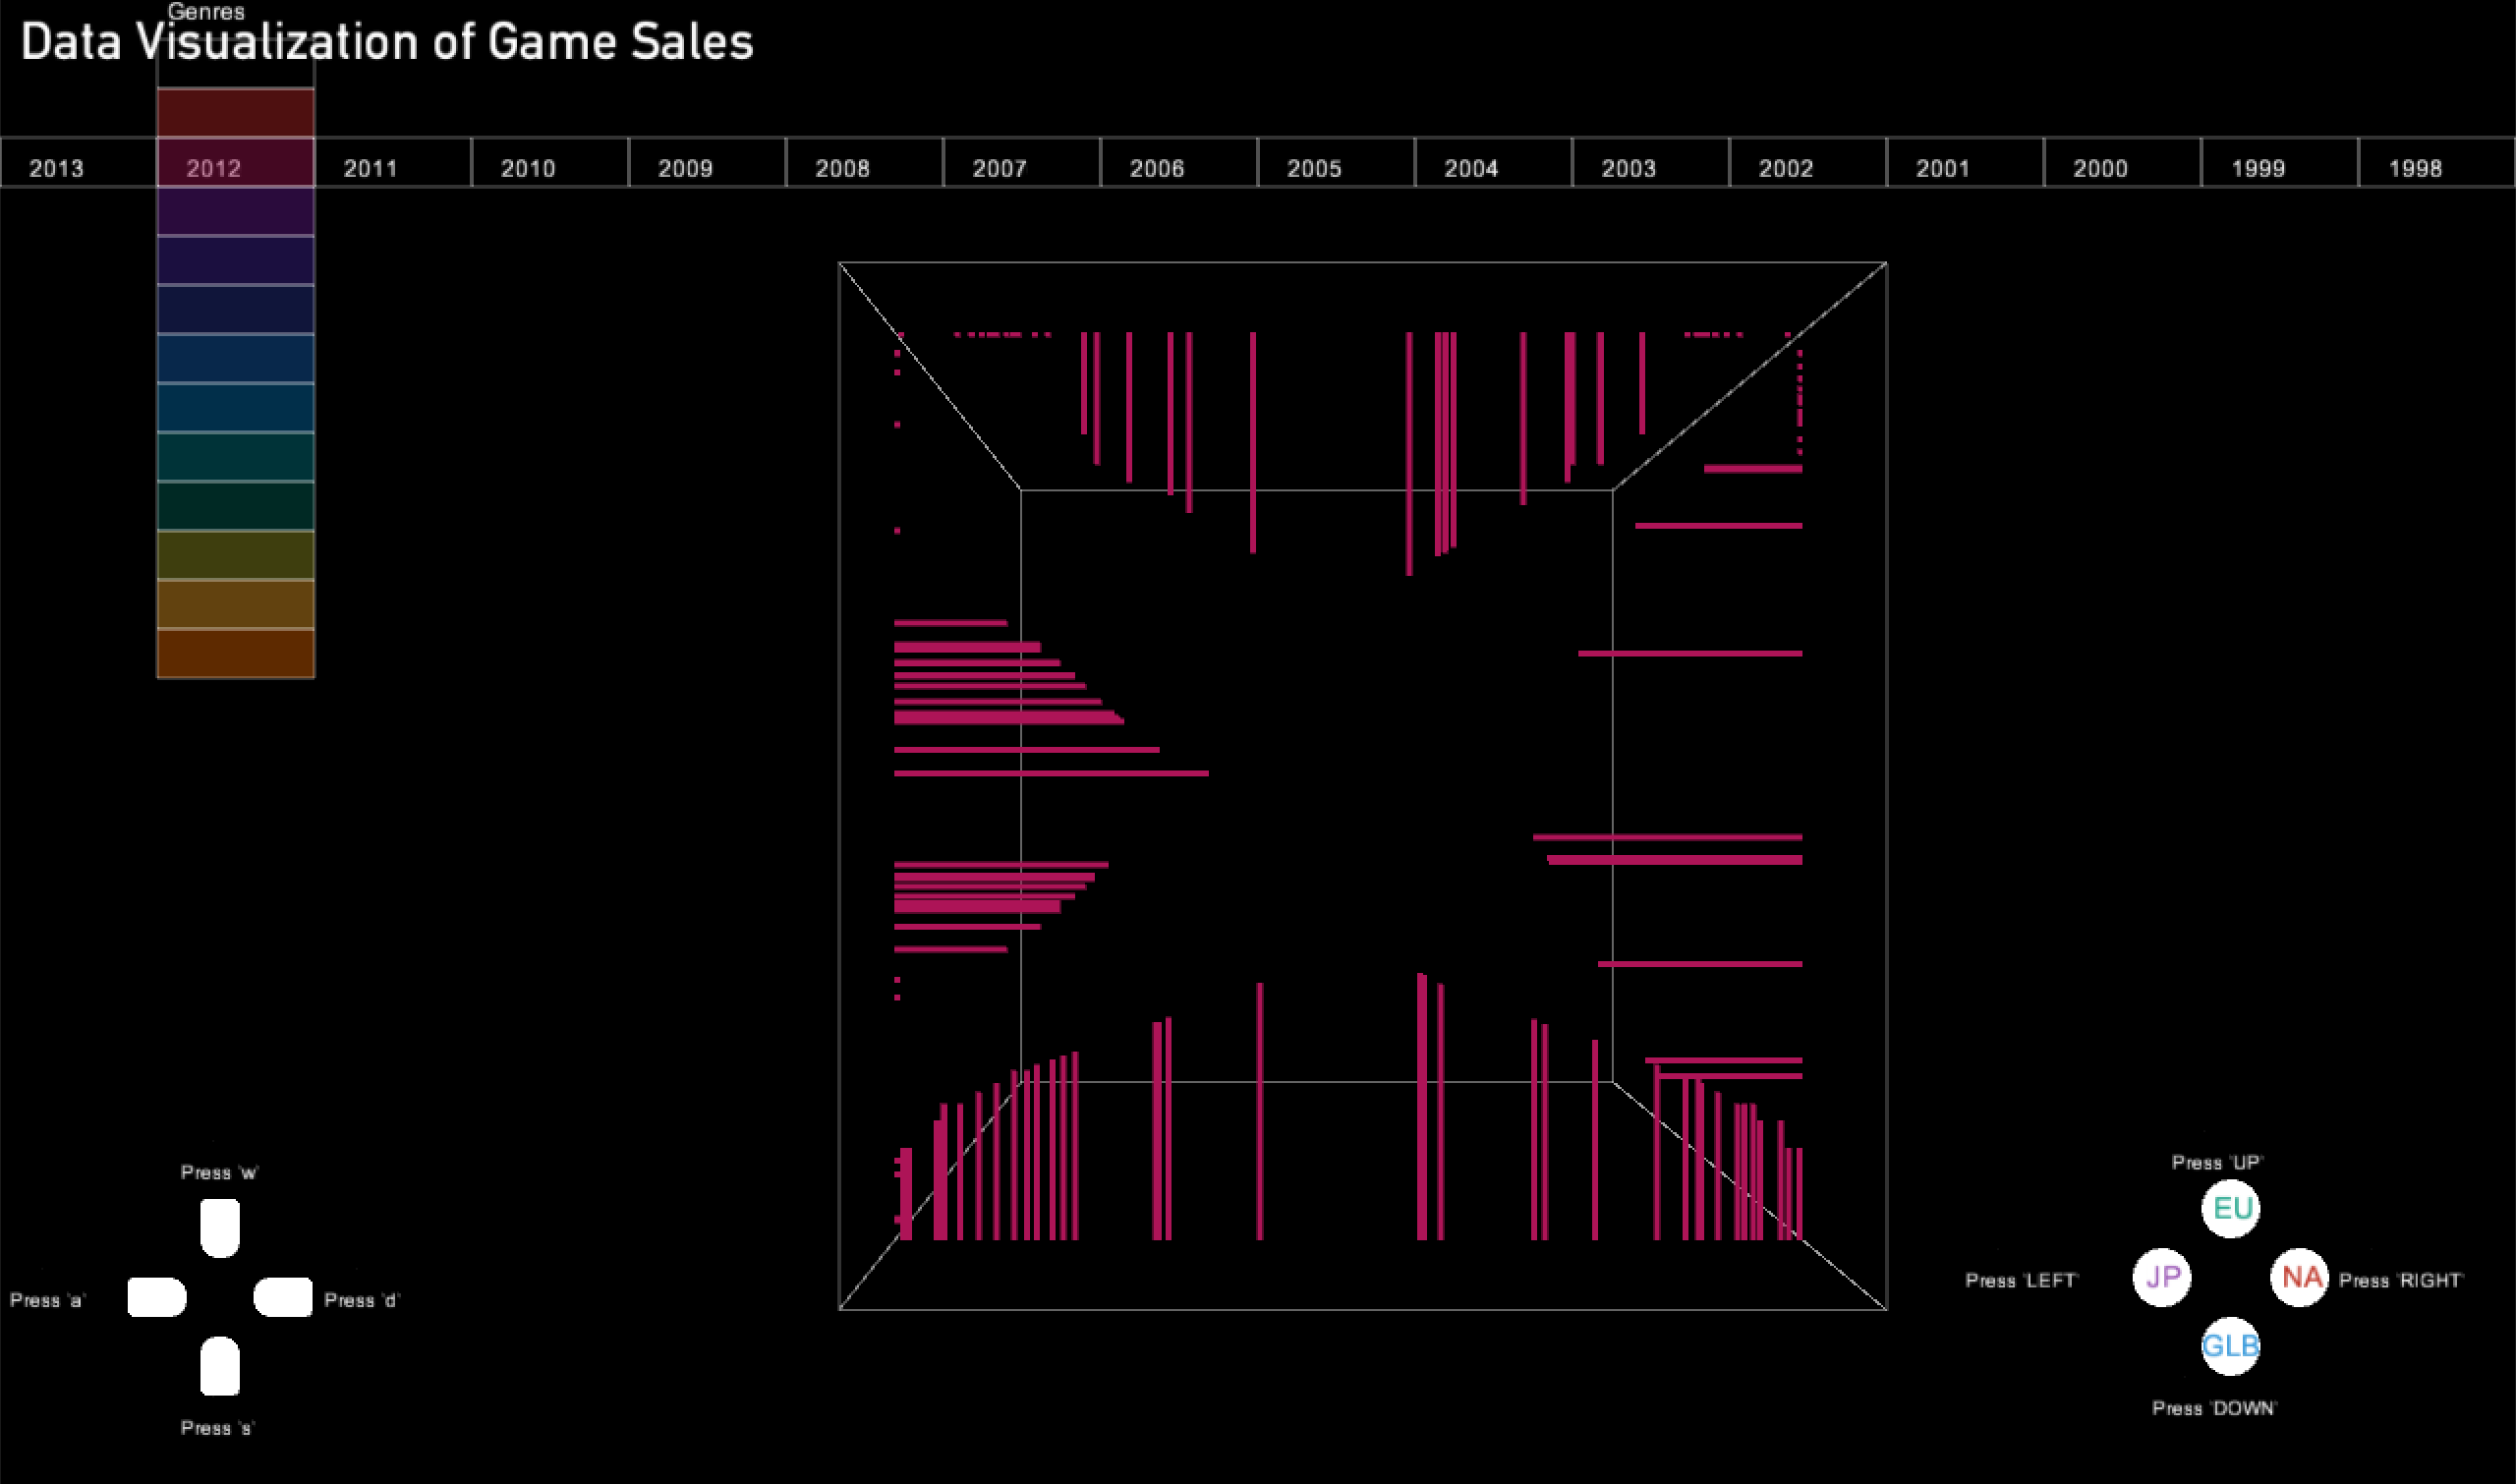
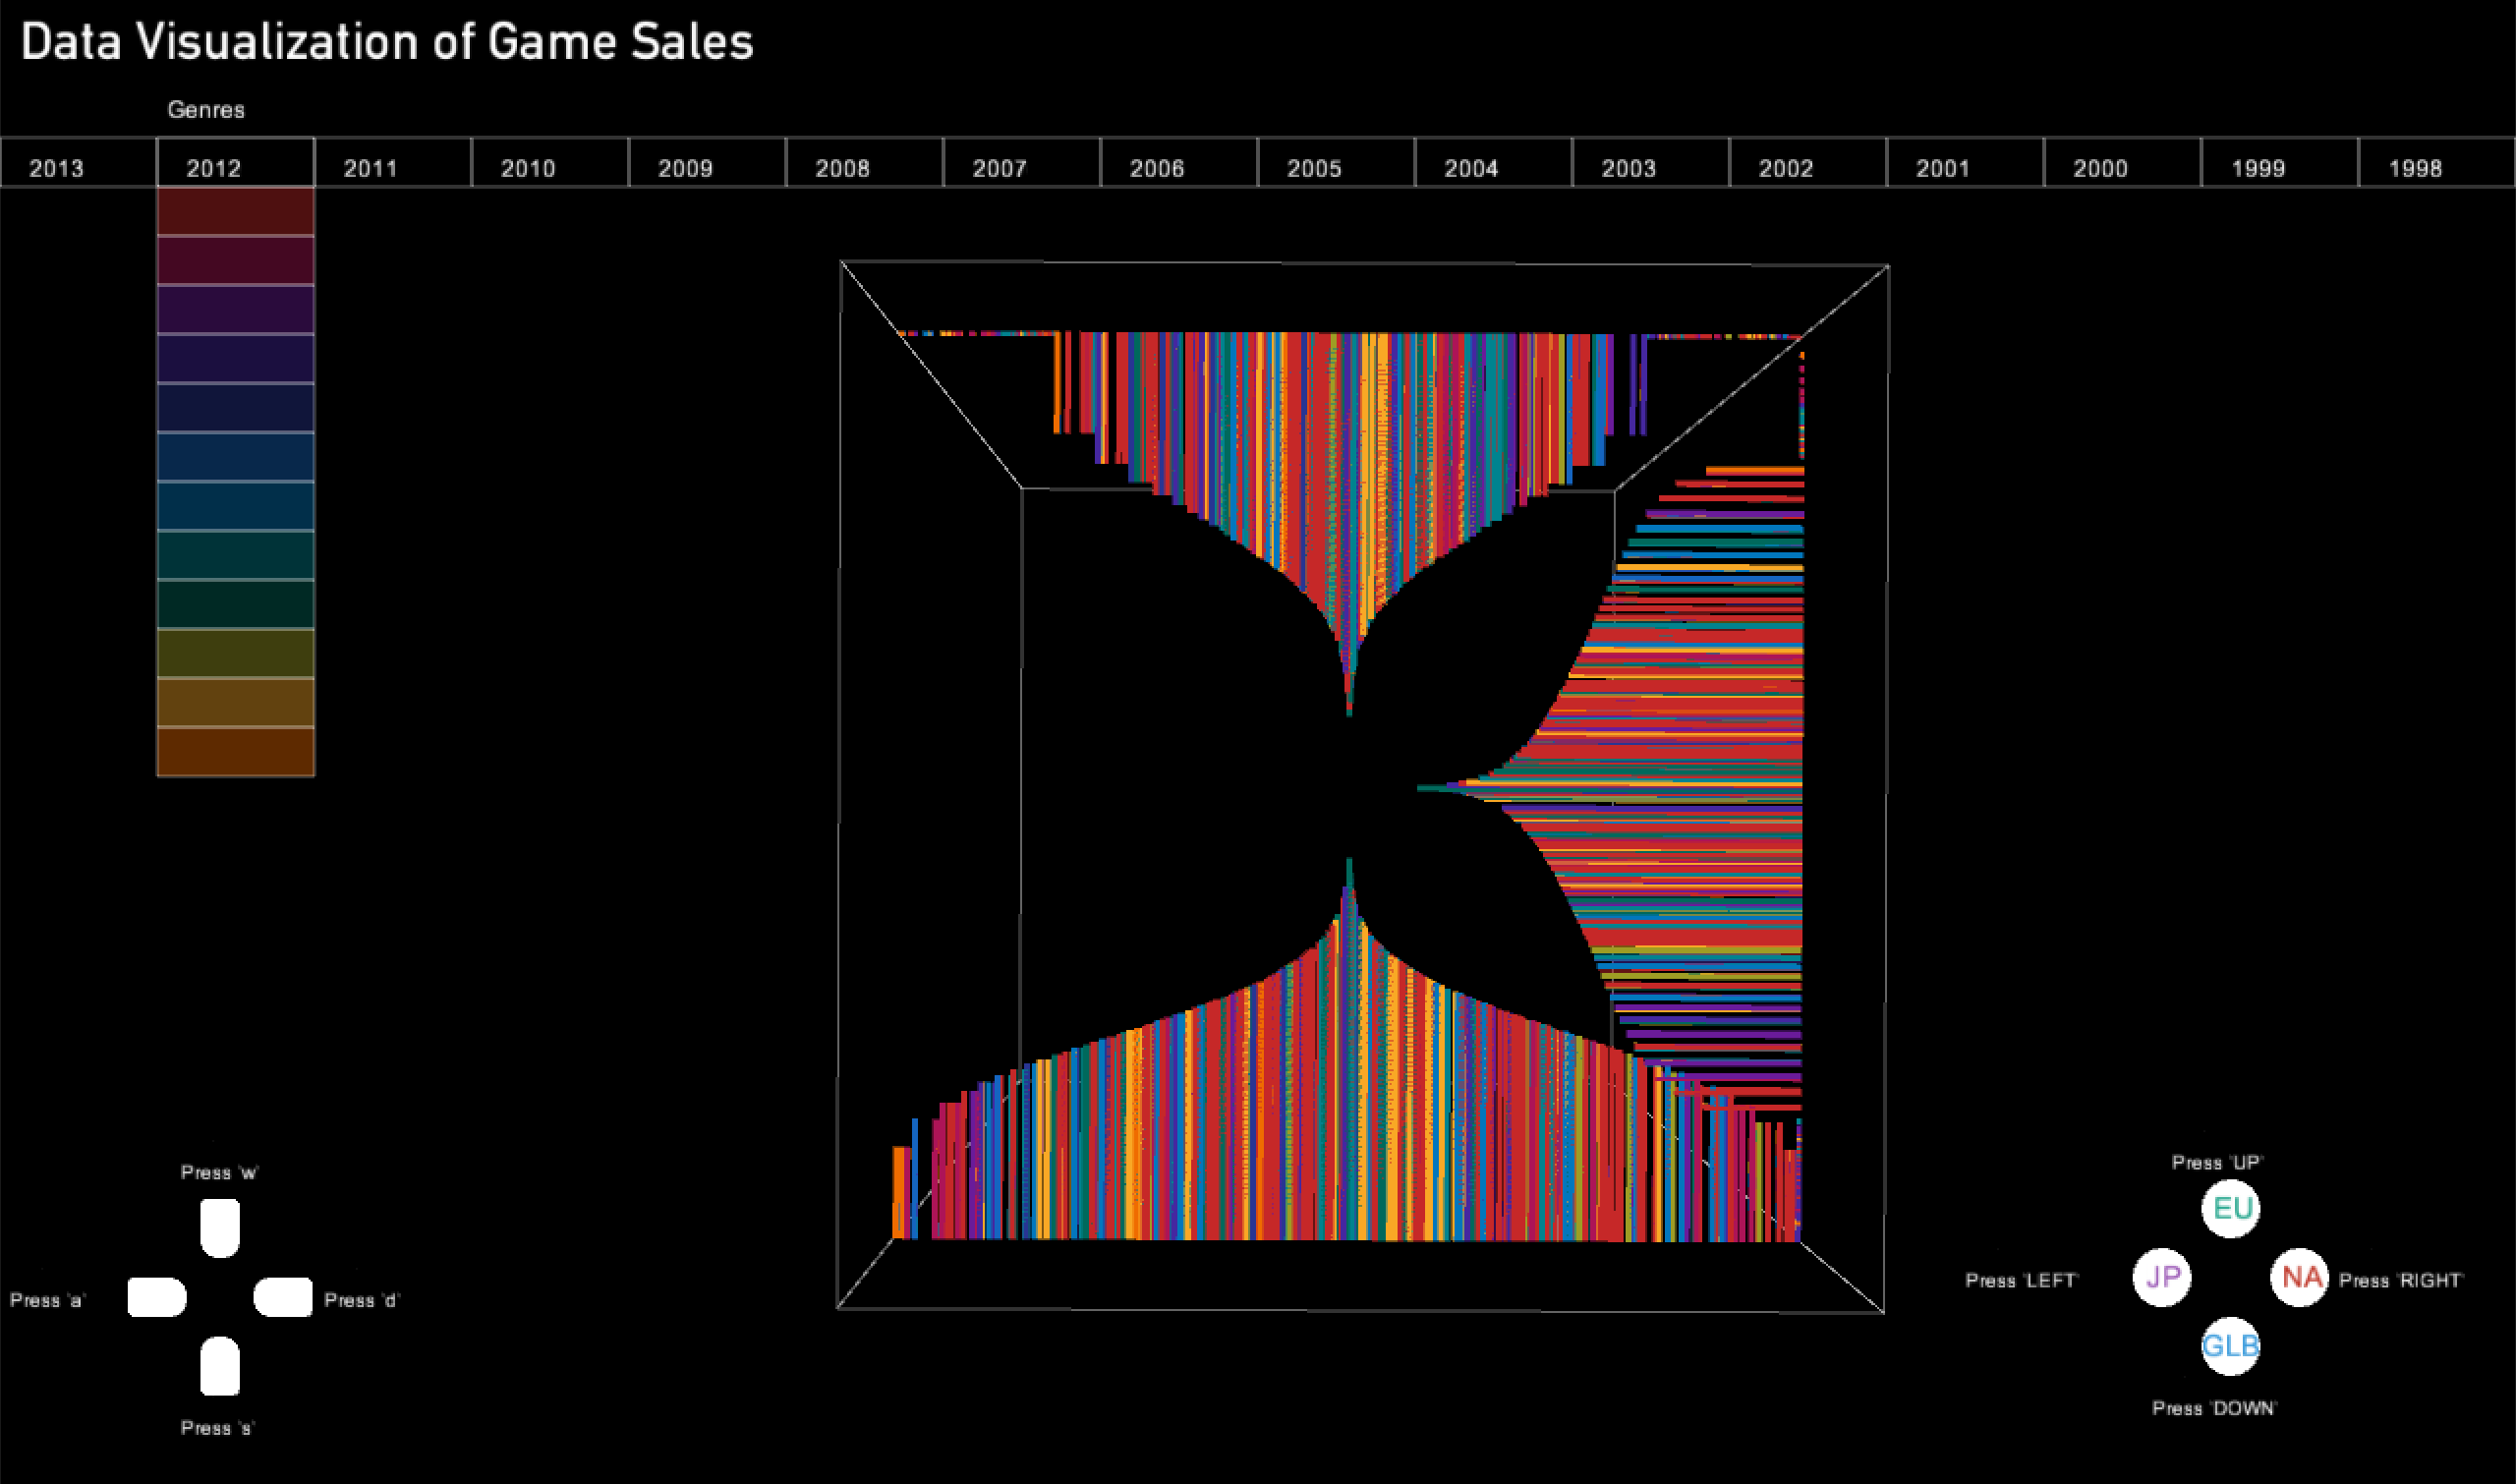
I have the data of game sales from 4 markets: Japanese Market, European Market, North American Marktet, and Global Market. I use a cube to contain these data. Starting from left, top, right, and bottom, each surface indicates one market. The left is Japanese market, top is European market, right is North American market, and bottom is global market. The sale of each game from different regions is drawed from each surface towards the center of the cube which means the longer of the ploted line the larger of the game sale. Additionally, the different color of each line indicates a game genre for instance the red color is action game.

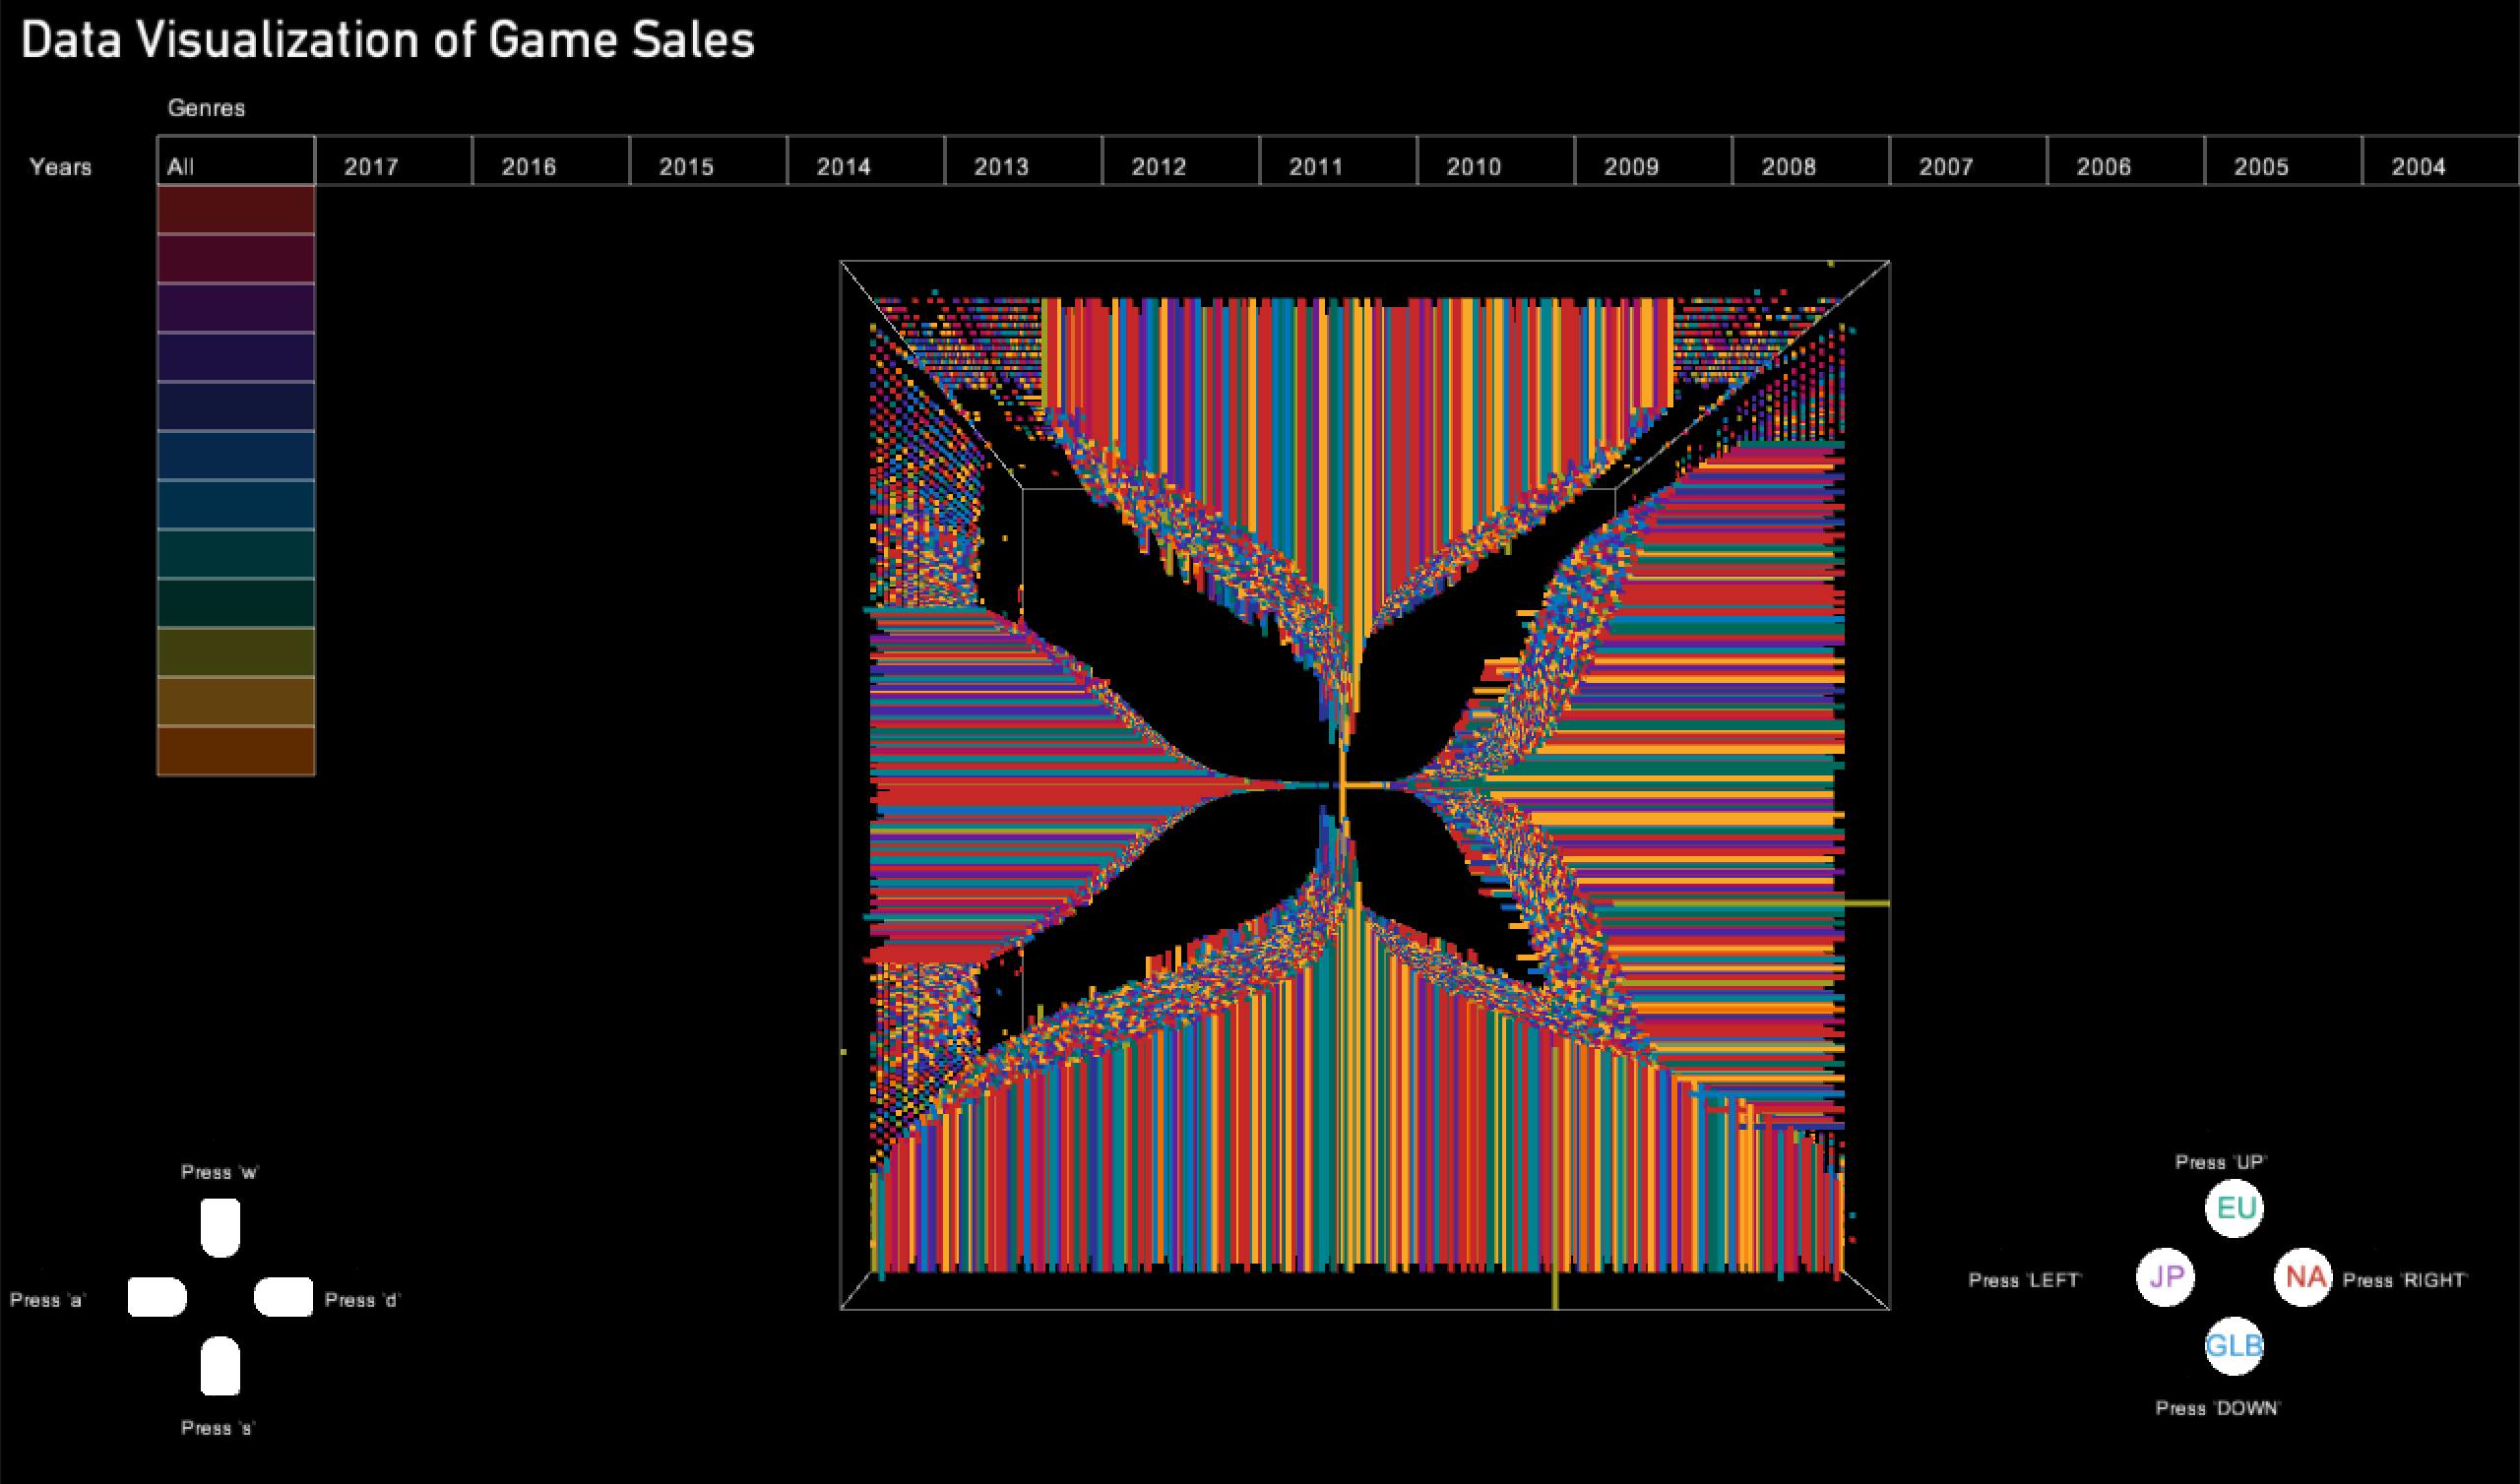
Final result
To give viewers a clearer understanding of the graph, I build two controllers on the left bottom and right bottom. Because it is a game sale project, the controllers are built based on the PS4 gaming controller. There are two bars, the bar with numbers of years is year bar, and the bar with color is game genre bar. These bars are controled by the left controller, pressing 'a' or 'd' or clicking the buttons controls the year bar movement, pressing 'w' or 's' or clicking the buttons controls the genre bar movement. Putting mouse on the genre bar can show the corresponding game genre of each color. The crossing rectangle of two bars indicats the status of the graph for intance at the beginning of the graph, it will be ALL with blank color which means all years' data and all game genre, if it becomes 2000 and red which means the data of 2000 and Action game. This idea is coming from some role-playing game status bar. The 4 markets are controled by the right bar, there are some words in left buttons that 'JP' means Japanese market, 'EU' means Euopean market, 'NA' means North Amercian market, and 'GLB' means global market. Clicking the buttons or pressing 'LEFT', 'UP', 'RIGHT', 'DOWN', viewer can control the appearance of each market.
Code