The Popularity of Uploaders in Bilibili
MAT 259, 2016
Guanyu Chen
Concept
The goal of this project is to discover the popularity (measured by numbers of followers) of uploaders in a video website named Bilibili (Chinese YouTube) from different subclasses including game, technology and etc. The main concentration of my analysis is on a relationship between the popularity of uploaders and their corrsponding posted numbers of views of videos from 2018 to 2020. Also, since all data would be related with consistent time, another feature, days of week, will be included into the project. Moreover, numbers of bullet comments and numbers of shares that can be measured the popularity of videos would be added as elements into my graphs.
Here are fundamental features of my visualization:
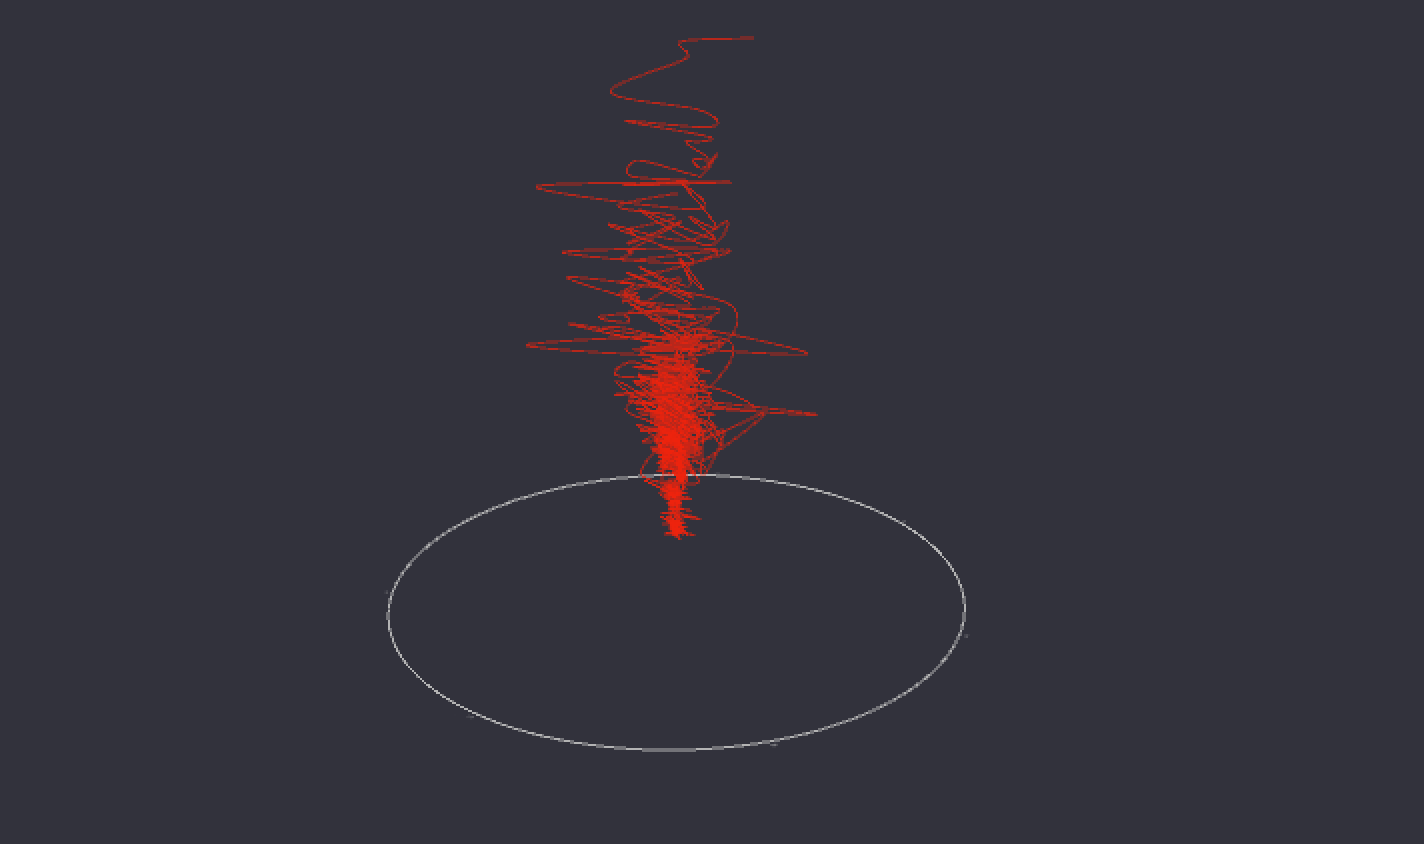
1. The height of plots are numbers of followers of uploaders.
2. The radius of each point represents the number of views of such video.
3. The line thickness represents numbers of shares of one video. With thicker lines, the videos had more shares.
4. The transparency of lines repesents numbers of bullet comments of one video. With lighter color, the videos had more bullet comments.
Note: All data is supported by an uploader "LePtC". Thank you so much for supporting me to realize this work.
Query
No queries for this project. Accessing all data from databases would be done with Python scripts.
Preliminary sketches
I spent a lot of time to figure out one possible way to visualize my idea in practice. After seeing this picture, I tried to mimic my data as random curves in space. The theme might be considered about 'light and shadow'.

The following scratch showed my rough imagine picture:
Process
Here are some initial drafts of my plots:
Final result
Explanations of some Important variables and features:
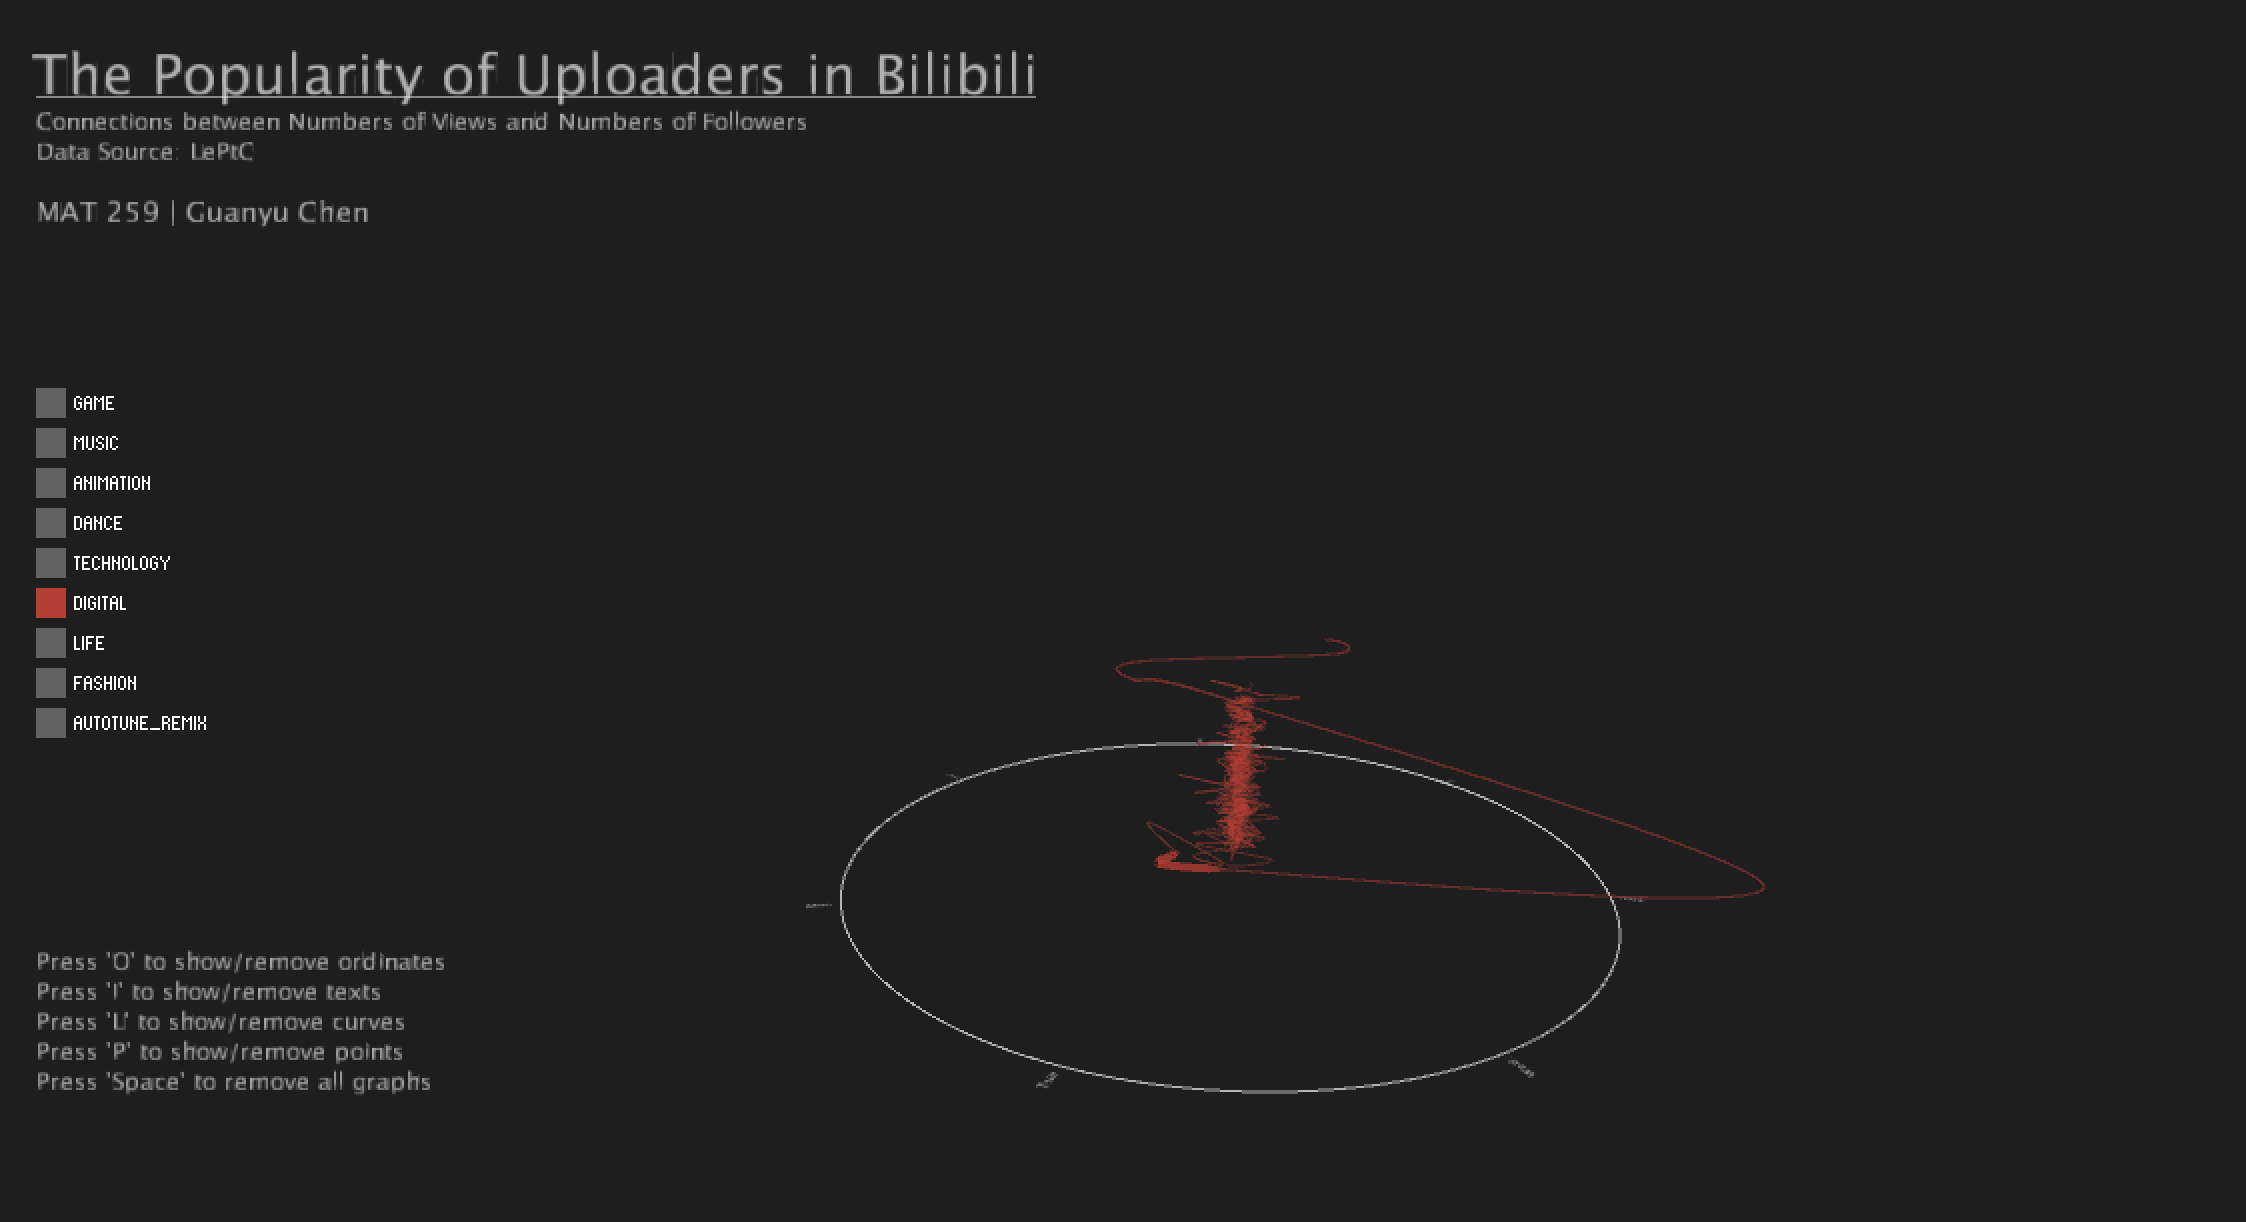
For data, I picked up top10 uploaders from each class in Bilibili (Chinese Youtube). All classes have 9 subclasses including Game, Music, Animation, Dance, Technology, Digital, Life, Fashion and Autotune_Remix.
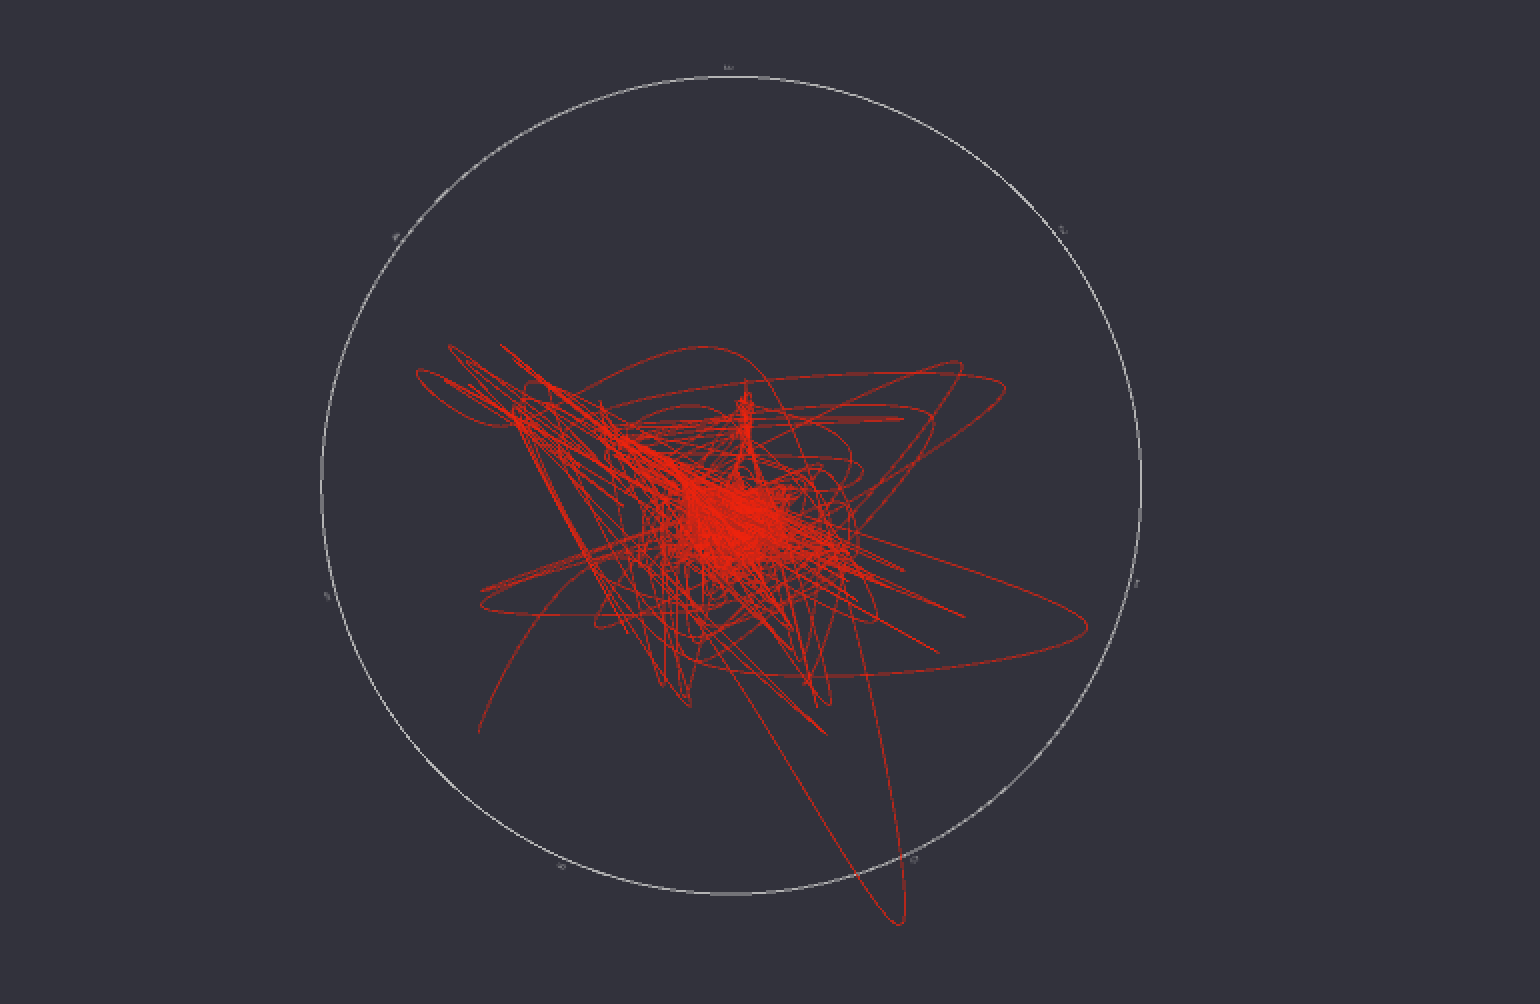
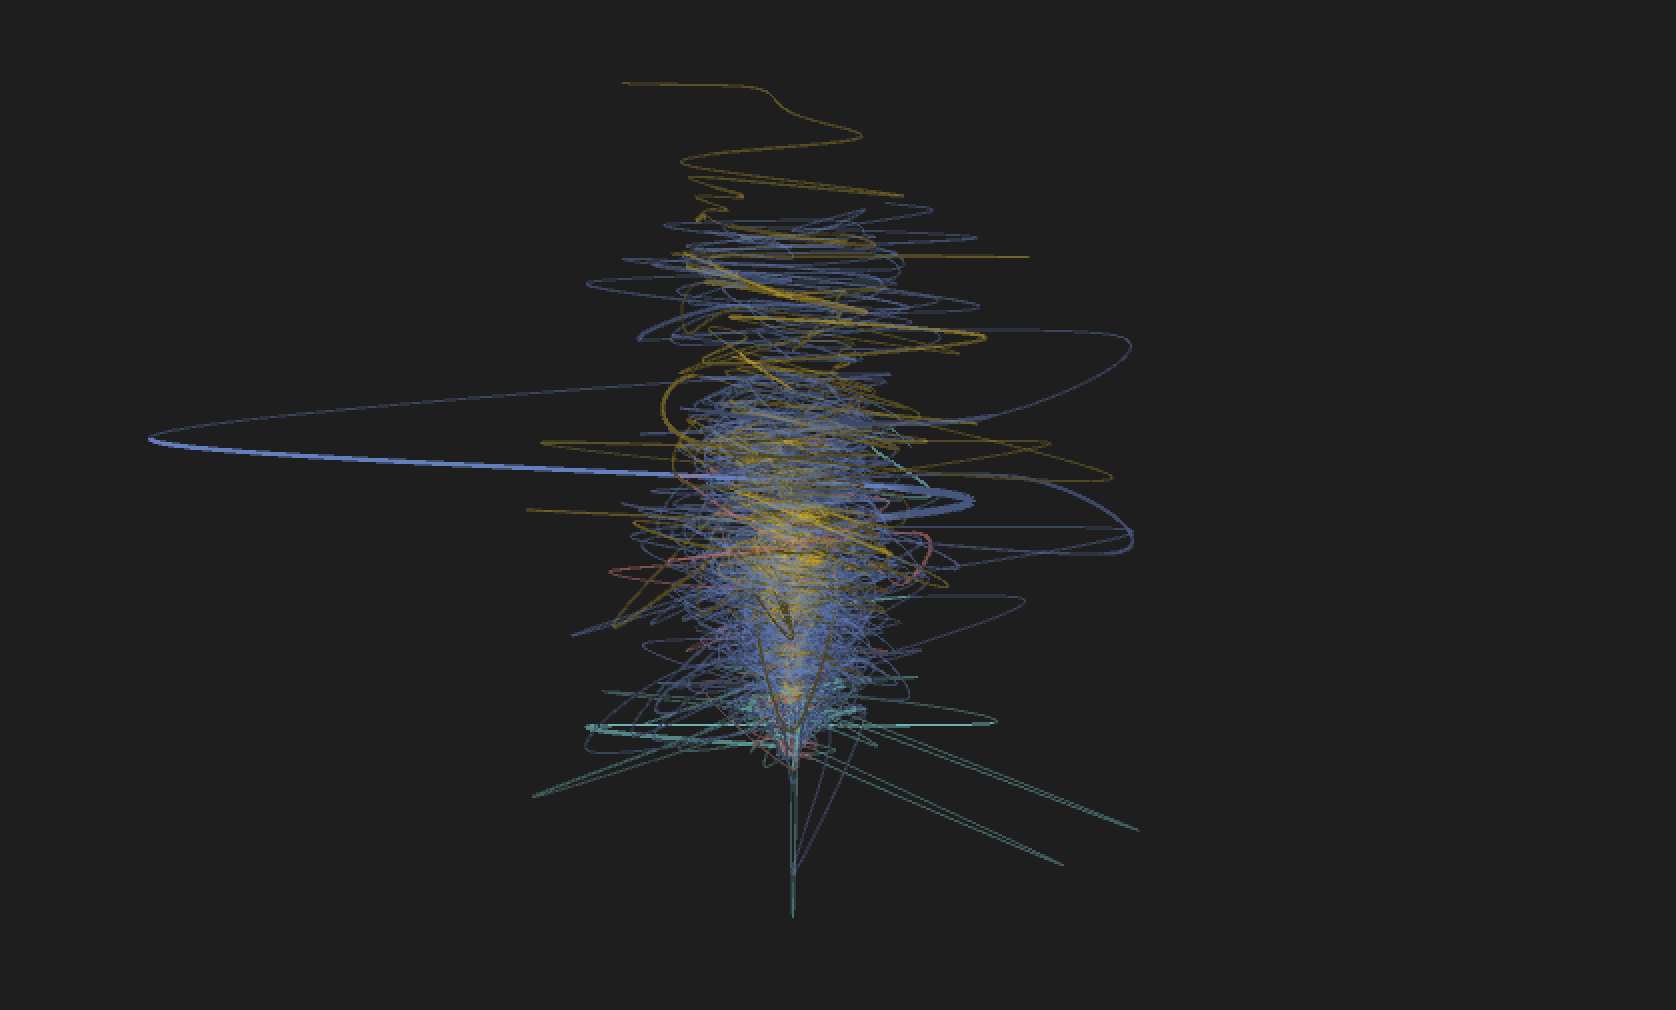
From first and second graphs:
- Each point represents posted video from the uploader.
- Each line represents posted videos from one uploader from 2018 to 2020.
- Each direction presents days of the week(Monday to Sunday) of the posted video.
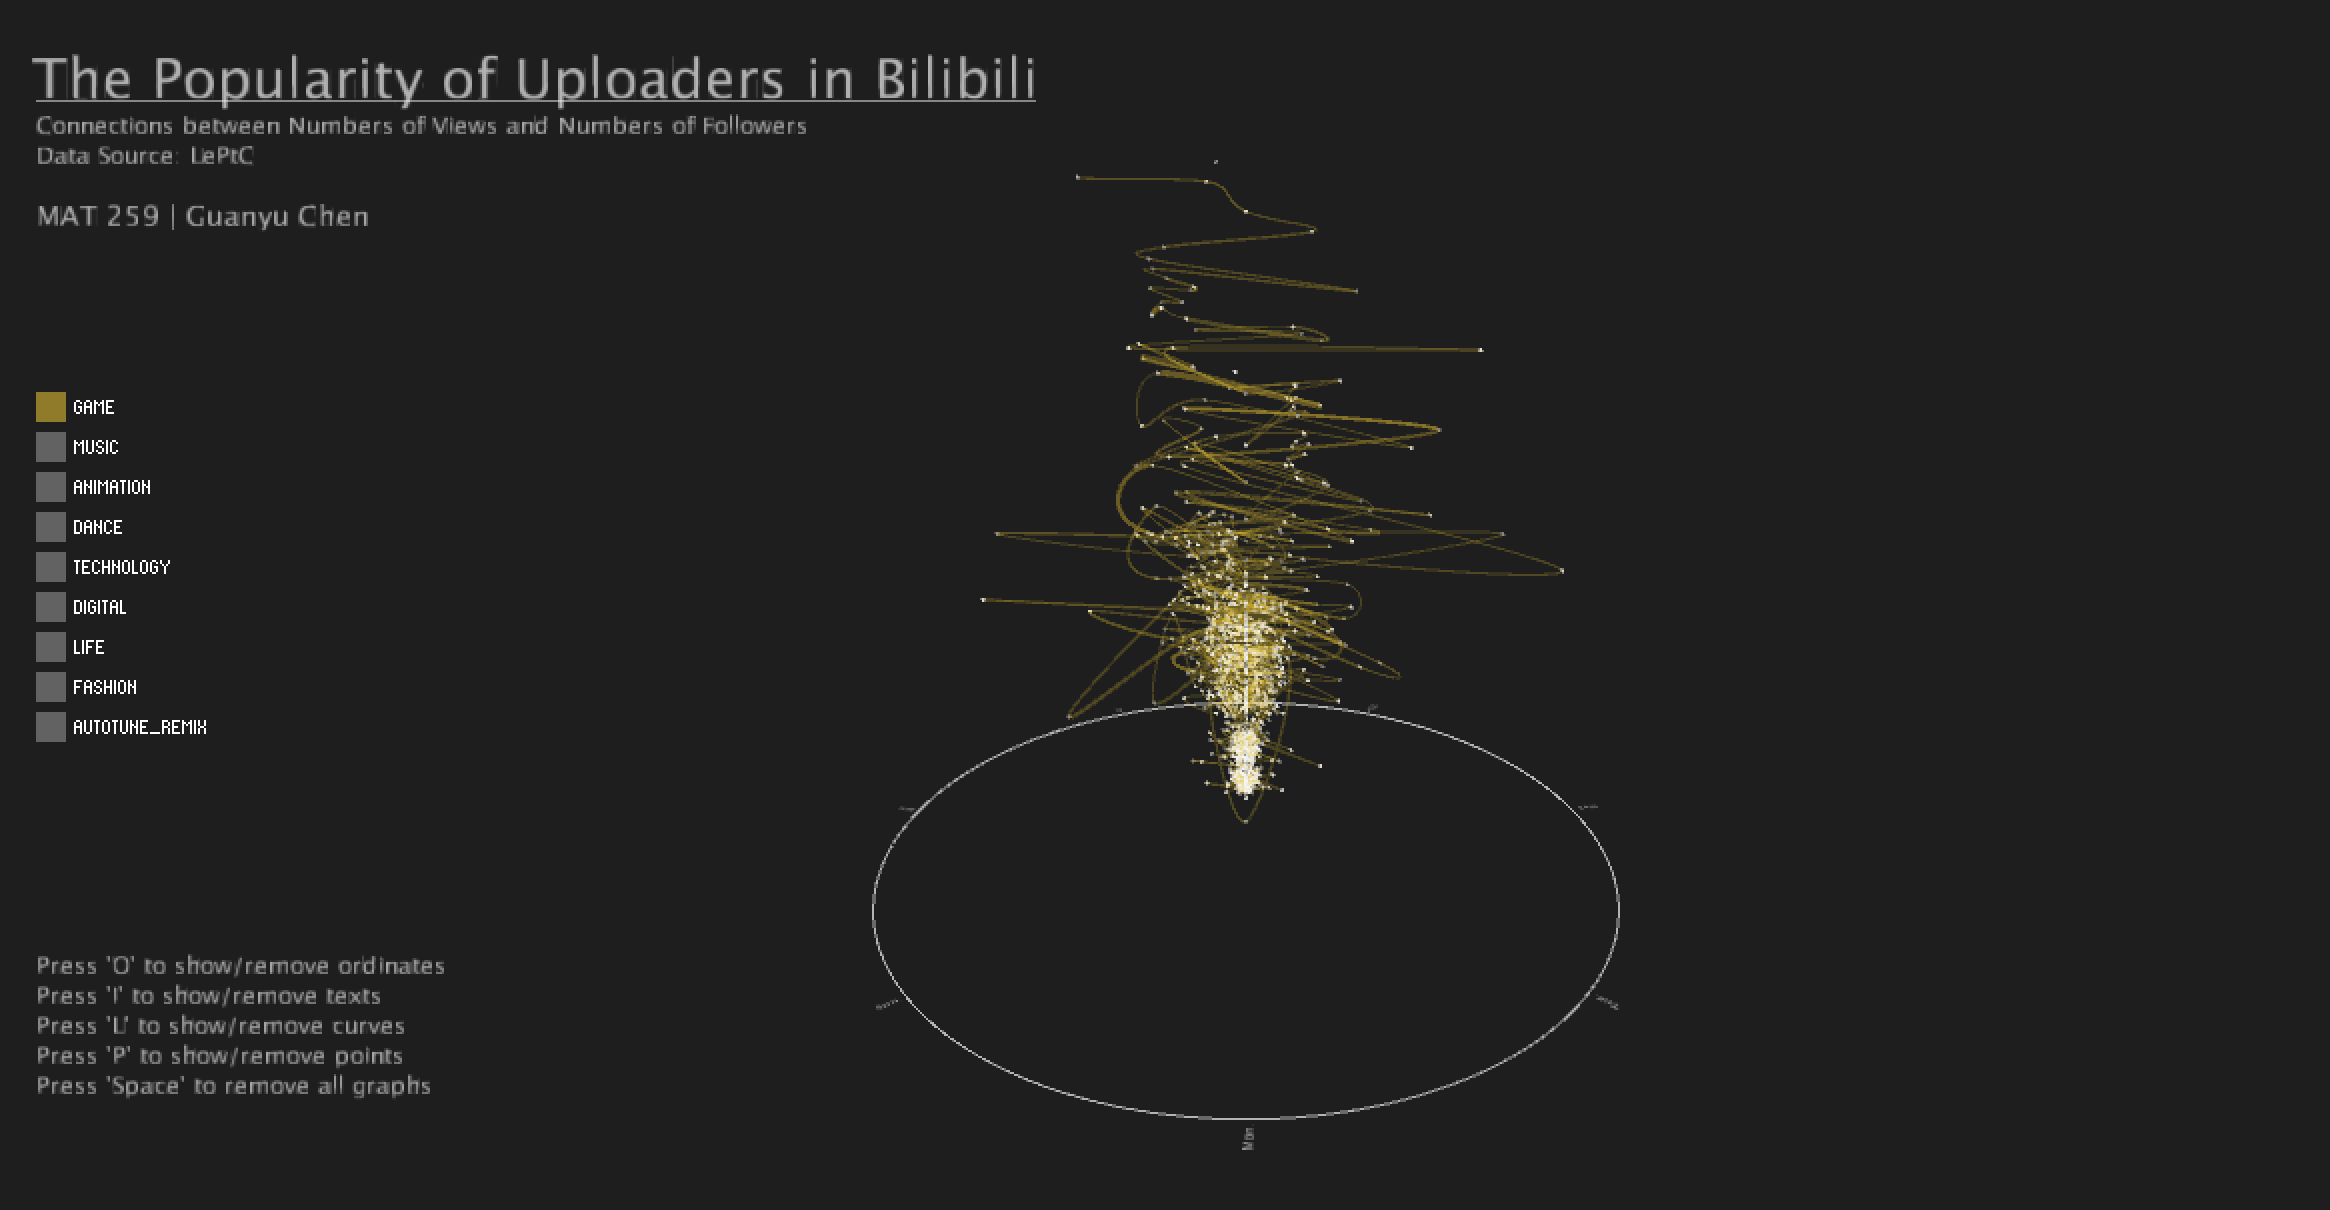

Some uploaders in Bilibili might get a large number of followers with huge amounts of views of videos, but some ones not. The motivation of this project is to make visualizations about different tendencies of this relationship in diverse areas.
For example, some autotune remix videos by uploading from music uploaders might receive large numbers of views. However, these uploaders still could not collect more followers relatively.
Also, if observing the lines plot below, many popular videos ahve drawn great attention from audiences so that numbers of followers of uploaders would exponentially increase. This will lead to matthew effects that attractive works in Bilibili will accelerate uploaders' increasing numbers of followers, which will further lead to more views of videos uploaders post in future. In other words, popular uploaders will become more popular in some subclasses.
For the last picture, it is obvious to see a huge curve in digital area. That indicates an influential video that a uploader posted promoted him to become popular and gained many followers in short time. Over the time, the uploader became the most popular character in digital area.
Also, from my perspective, some uploaders could not be the most popular uploaders in whole video website because selected fields they concerned might have some limitations. That means they would have few specific-groups of audiences in website and their works hardly attract new audiences to get interested.
Code