The Fates of Volga Germans
MAT 259, 2020
Evgeny Noi
Concept
I am using a data set, provided by Human Rights Society «Memorial» (non-commercial organization
studying political repressions in the USSR and in present-day Russia). The data contains more than
3 million records on victims of political terror in the Soviet Union.
I am particularly interested in a specific ethnic group among the victims: Wolgadeutsche (Volga Germans), a group of ethnic Germans who colonized southern Russia and settled along Volga river under Catherine the Great in XVIII century. In 1942 around 438,000 Germans were arrested, tried and deported to work in labor camps in Kazakhstan, Siberia and Urals, of which tens of thousands died during the transportation that could last several month with limited food and water available. After arrival the death toll rose to 30-40% due to labor coniditions, severe weather and inadequate provision of food, clothing and shelter in labor camps.
I am particularly interested in a specific ethnic group among the victims: Wolgadeutsche (Volga Germans), a group of ethnic Germans who colonized southern Russia and settled along Volga river under Catherine the Great in XVIII century. In 1942 around 438,000 Germans were arrested, tried and deported to work in labor camps in Kazakhstan, Siberia and Urals, of which tens of thousands died during the transportation that could last several month with limited food and water available. After arrival the death toll rose to 30-40% due to labor coniditions, severe weather and inadequate provision of food, clothing and shelter in labor camps.
Query
The data set contains 3M records with varying degree of detail. First the dump of the database was donwloaded
from Github and imported onto a MySQL Server. Second the index on one of the tables was generated to speed up
lengthy joins. Finally, the following query was run on the database to generate the data for further analysis.
The resulting database consist of 80,000 rows with more than 10 columns.
                create INDEX idx_personid on memo.crcase (PersonID);

                SELECT *
                INTO OUTFILE 'C:/ProgramData/MySQL/MySQL Server 5.7/Uploads/wolga66.csv'
                FROM (
                SELECT
                        t1.PersonID, Surname, FirstName, Patronymic, Gender, BirthYearMin as birth, t4.Description as birthplace,
                    FirstRepressionYearMin as repr, t3.Description as nation, ArrestDay, ArrestMonth, ArrestYear,
                    TrialDay, TrialMonth, TrialYear, RepressionYear, Accusation, Sentence, Death, Execution, RehabDay,
                    RehabMonth, RehabYear, t22.Description as live
                    #count(*)
                FROM memo.person t1
                INNER JOIN memo.persondata t2
                ON t1.PersonID = t2.PersonID
                INNER JOIN memo.nationality t3
                ON t2.NationalityID = t3.NationalityID
                INNER JOIN memo.birthplace t4
                ON t2.BirthPlaceID = t4.BirthPlaceID
                INNER JOIN
                        (SELECT
                                PersonID, ArrestDay, ArrestMonth, ArrestYear, TrialDay, TrialMonth, TrialYear,
                                RepressionYear, Accusation, Sentence, Death, Execution, RehabDay, RehabMonth, RehabYear, LivingPlaceID
                        FROM memo.crcase) c
                ON t1.PersonID = c.PersonID
                INNER JOIN memo.livingplace t22
                ON c.LivingPlaceID = t22.LivingPlaceID
                WHERE lower(t3.Description) LIKE '%нем%') a
                LIMIT 100000;
Preliminary sketches
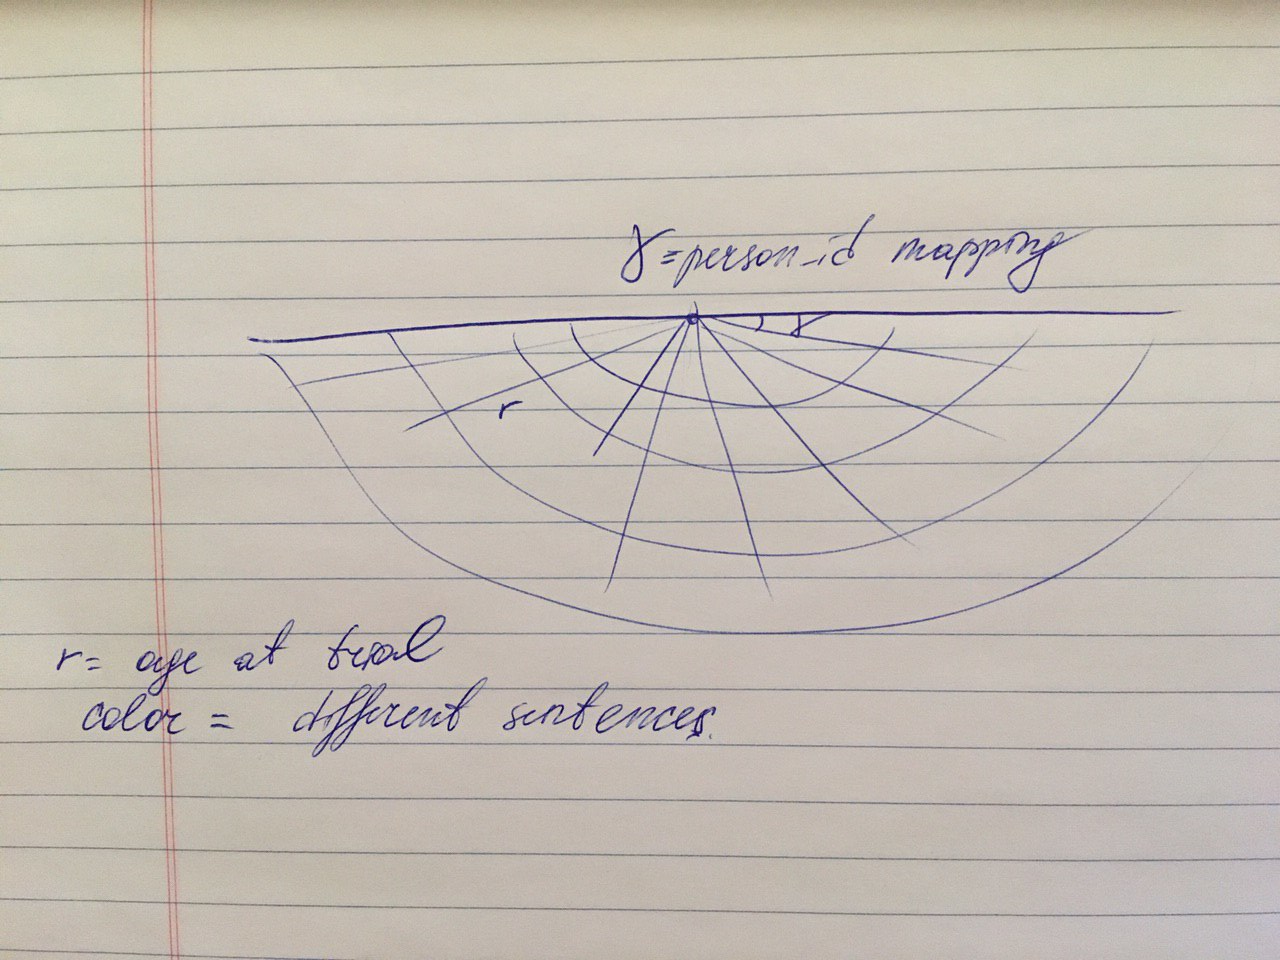
I created two types of design for this project. The first one is a 2d mapping of polar coordinates
(personal id) to radius (age).
The second part of the project was including a 3d representations of data. Geodetic coordinate system was utilized to reference locations of the points within given coordinates.
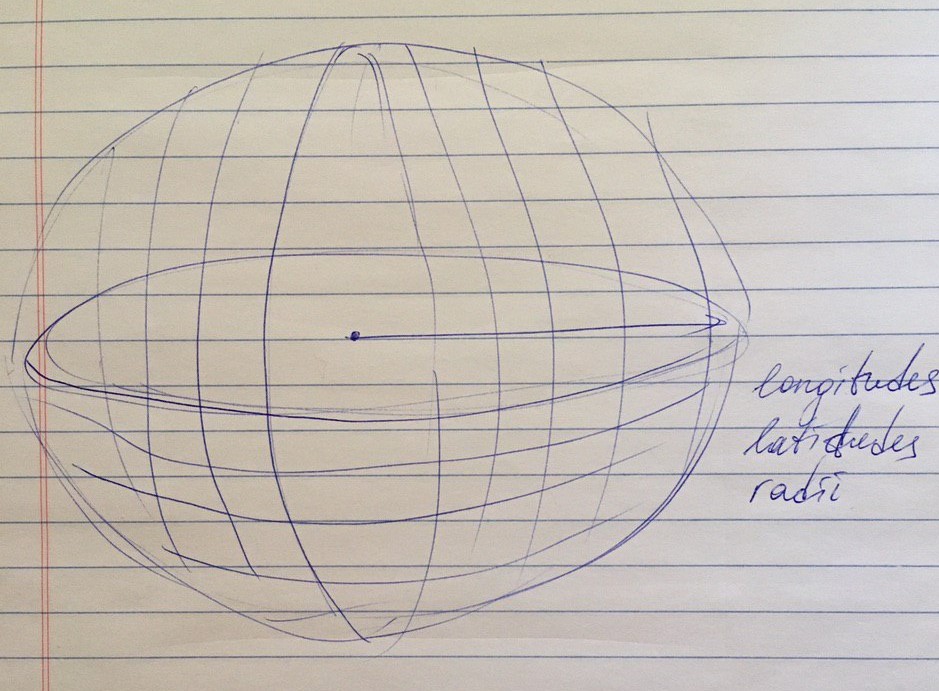
The second part of the project was including a 3d representations of data. Geodetic coordinate system was utilized to reference locations of the points within given coordinates.
Process
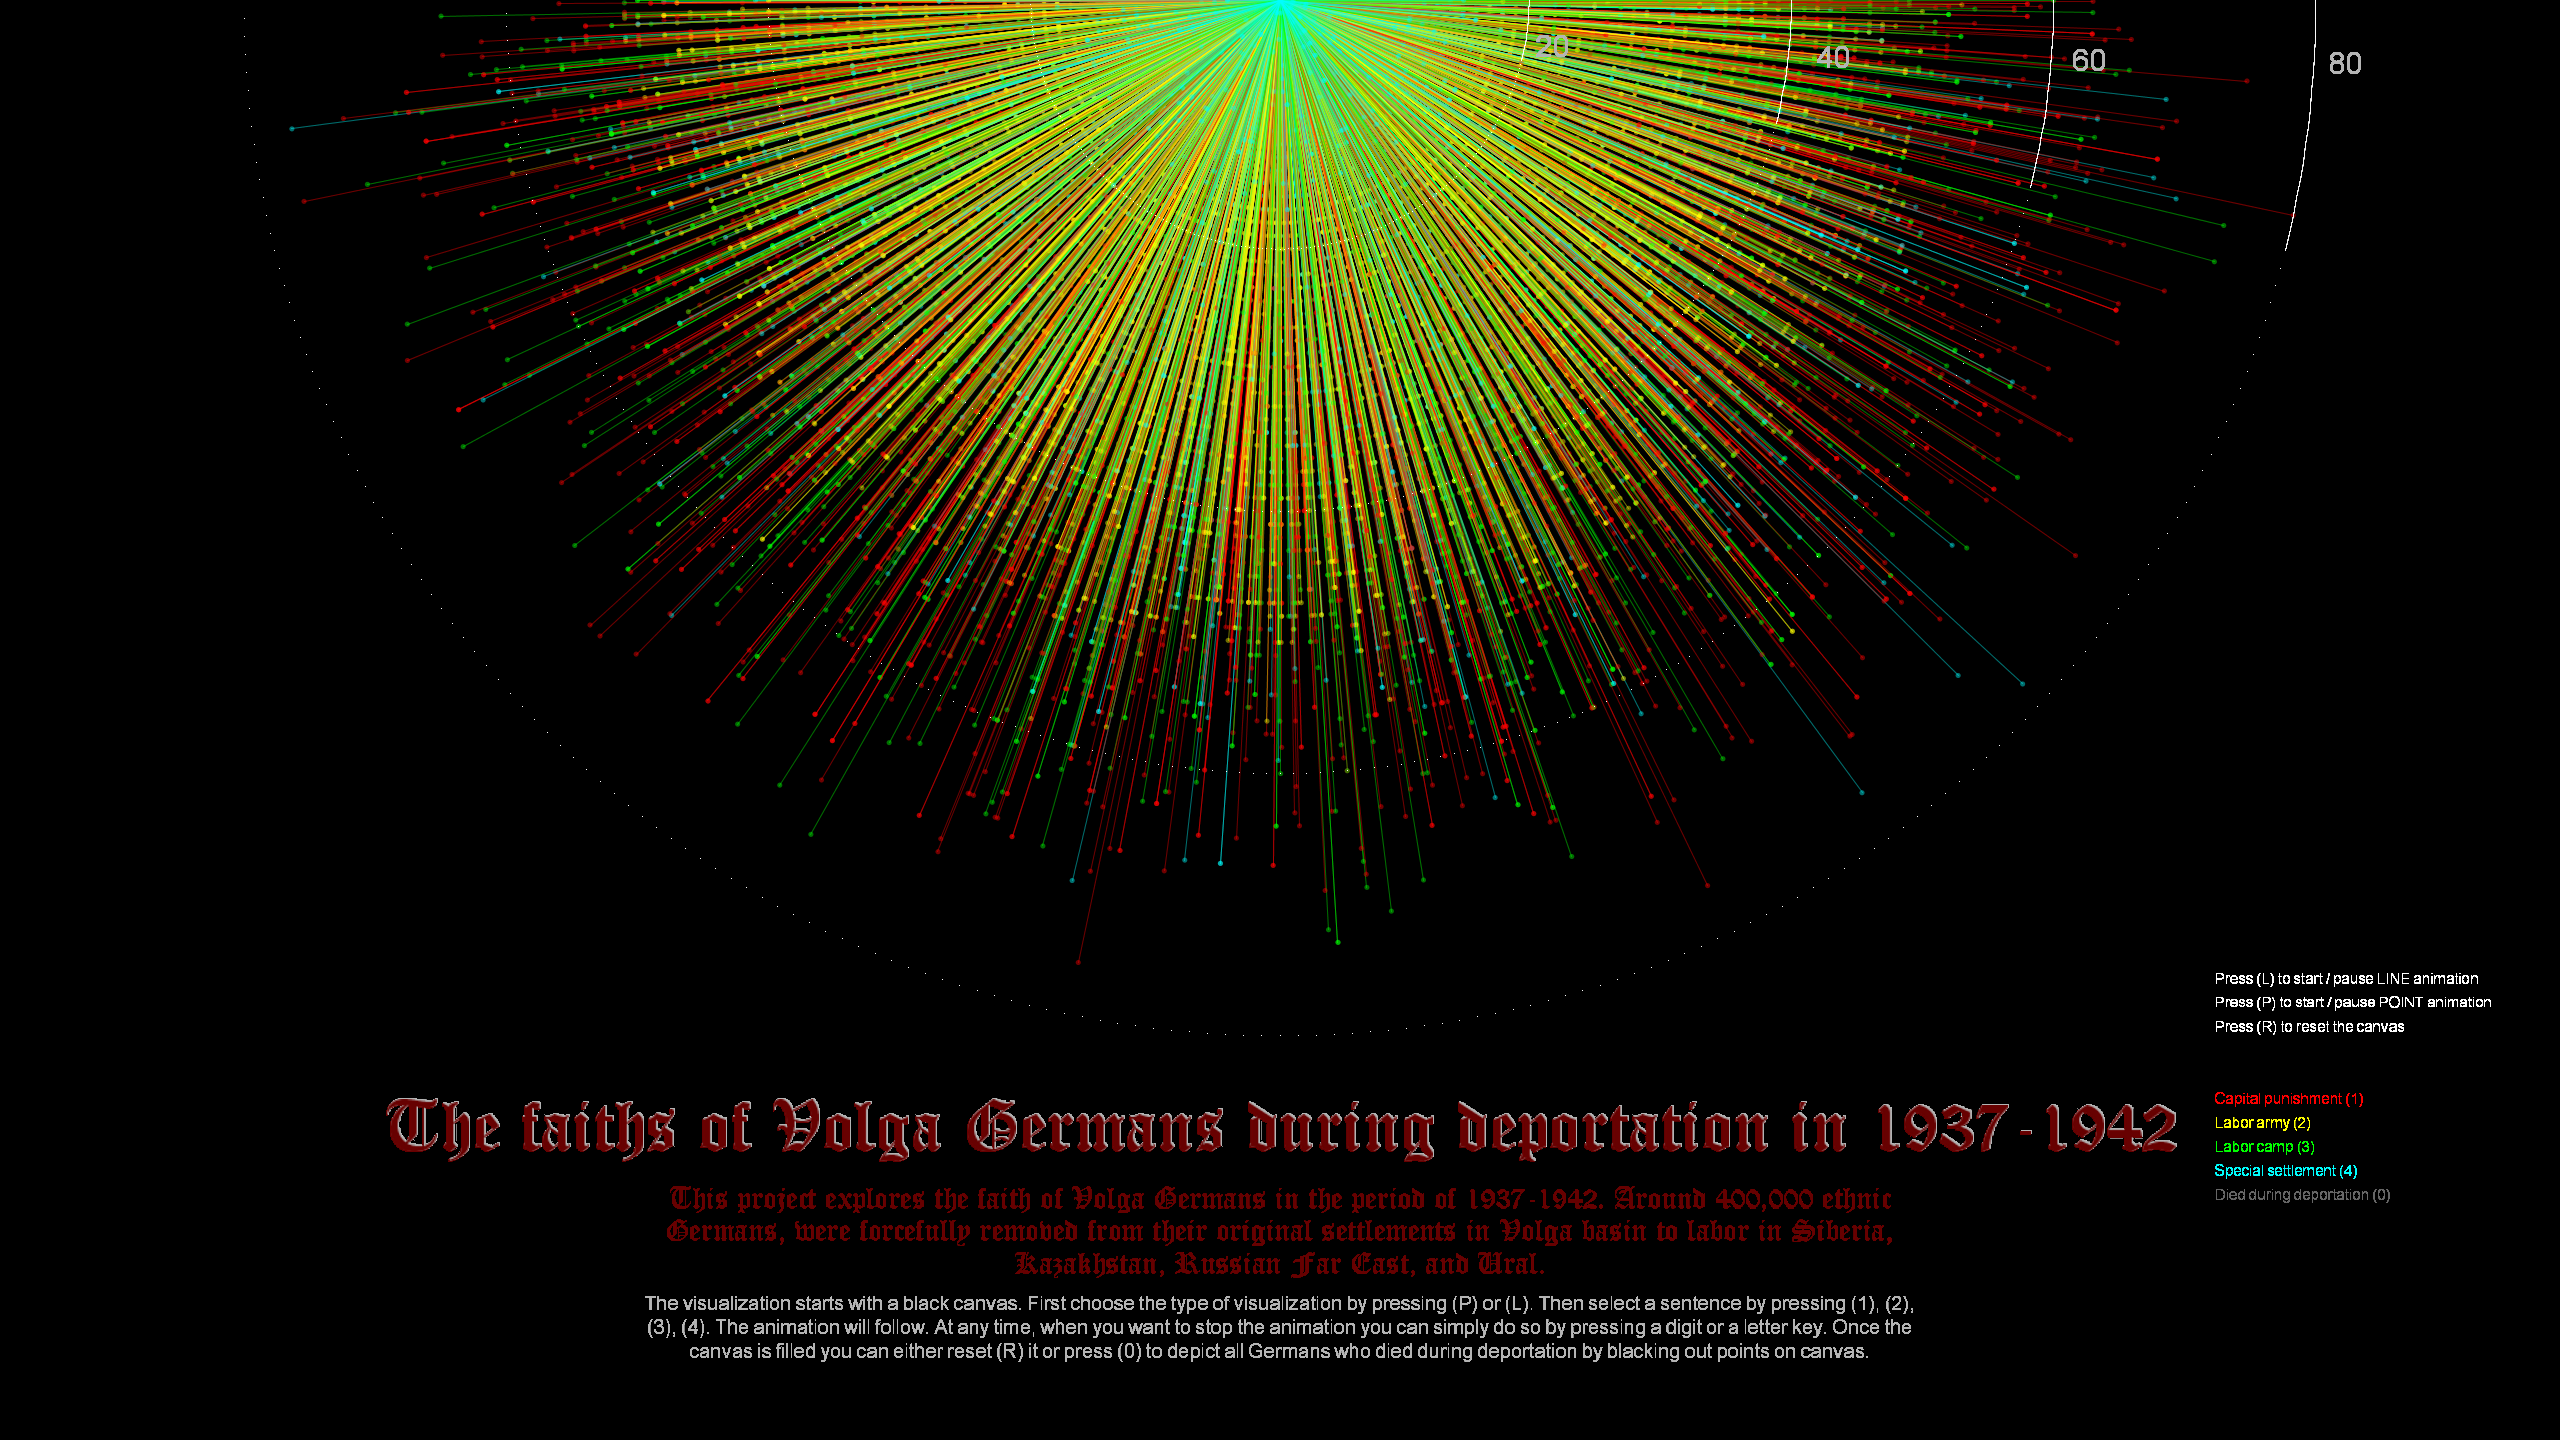
From the very start I wanted this project to incorporate sound component. In the end, the early
desktop mp3 players design was an inspiration for the visualization that I created. The origin of the data
in the top middle is metaphoric of the Sun. The rays emanating from the Sun represent the length of life
before trial, while their endpoints symbolize the beginning of the deportation.
Two modes of visualization exist: POINT and LINE, which can be combined or looked at separately. The color of lines/points signifies four common sentences (capital punishment, labor army, labor camp, and special settlement), while distance from the center represents the age of a person at trial. Due to the volume of data, it was impossible to visualize entities within one iteration, therefore, I randomly initiate a starting point and sample from the dataset at specific interval (n=750) to enable animation. The "location" of a person on the axes remains fixed, so that when repetitive resampling of a record occurs, the point/line is added at exactly the same location, where the first one appeared. After the animation is run for at least 10 seconds, one can try to visualize those, who died or was shot during the deportation by blacking out the drawn points on canvas.
The animation enables sequential visualization by four groups and in two different modes. POINT mode illustrations are found below. Notice differences in age distribution for four different groups. For instance, many children and teenagers who were sent to special settlements or orphanages.
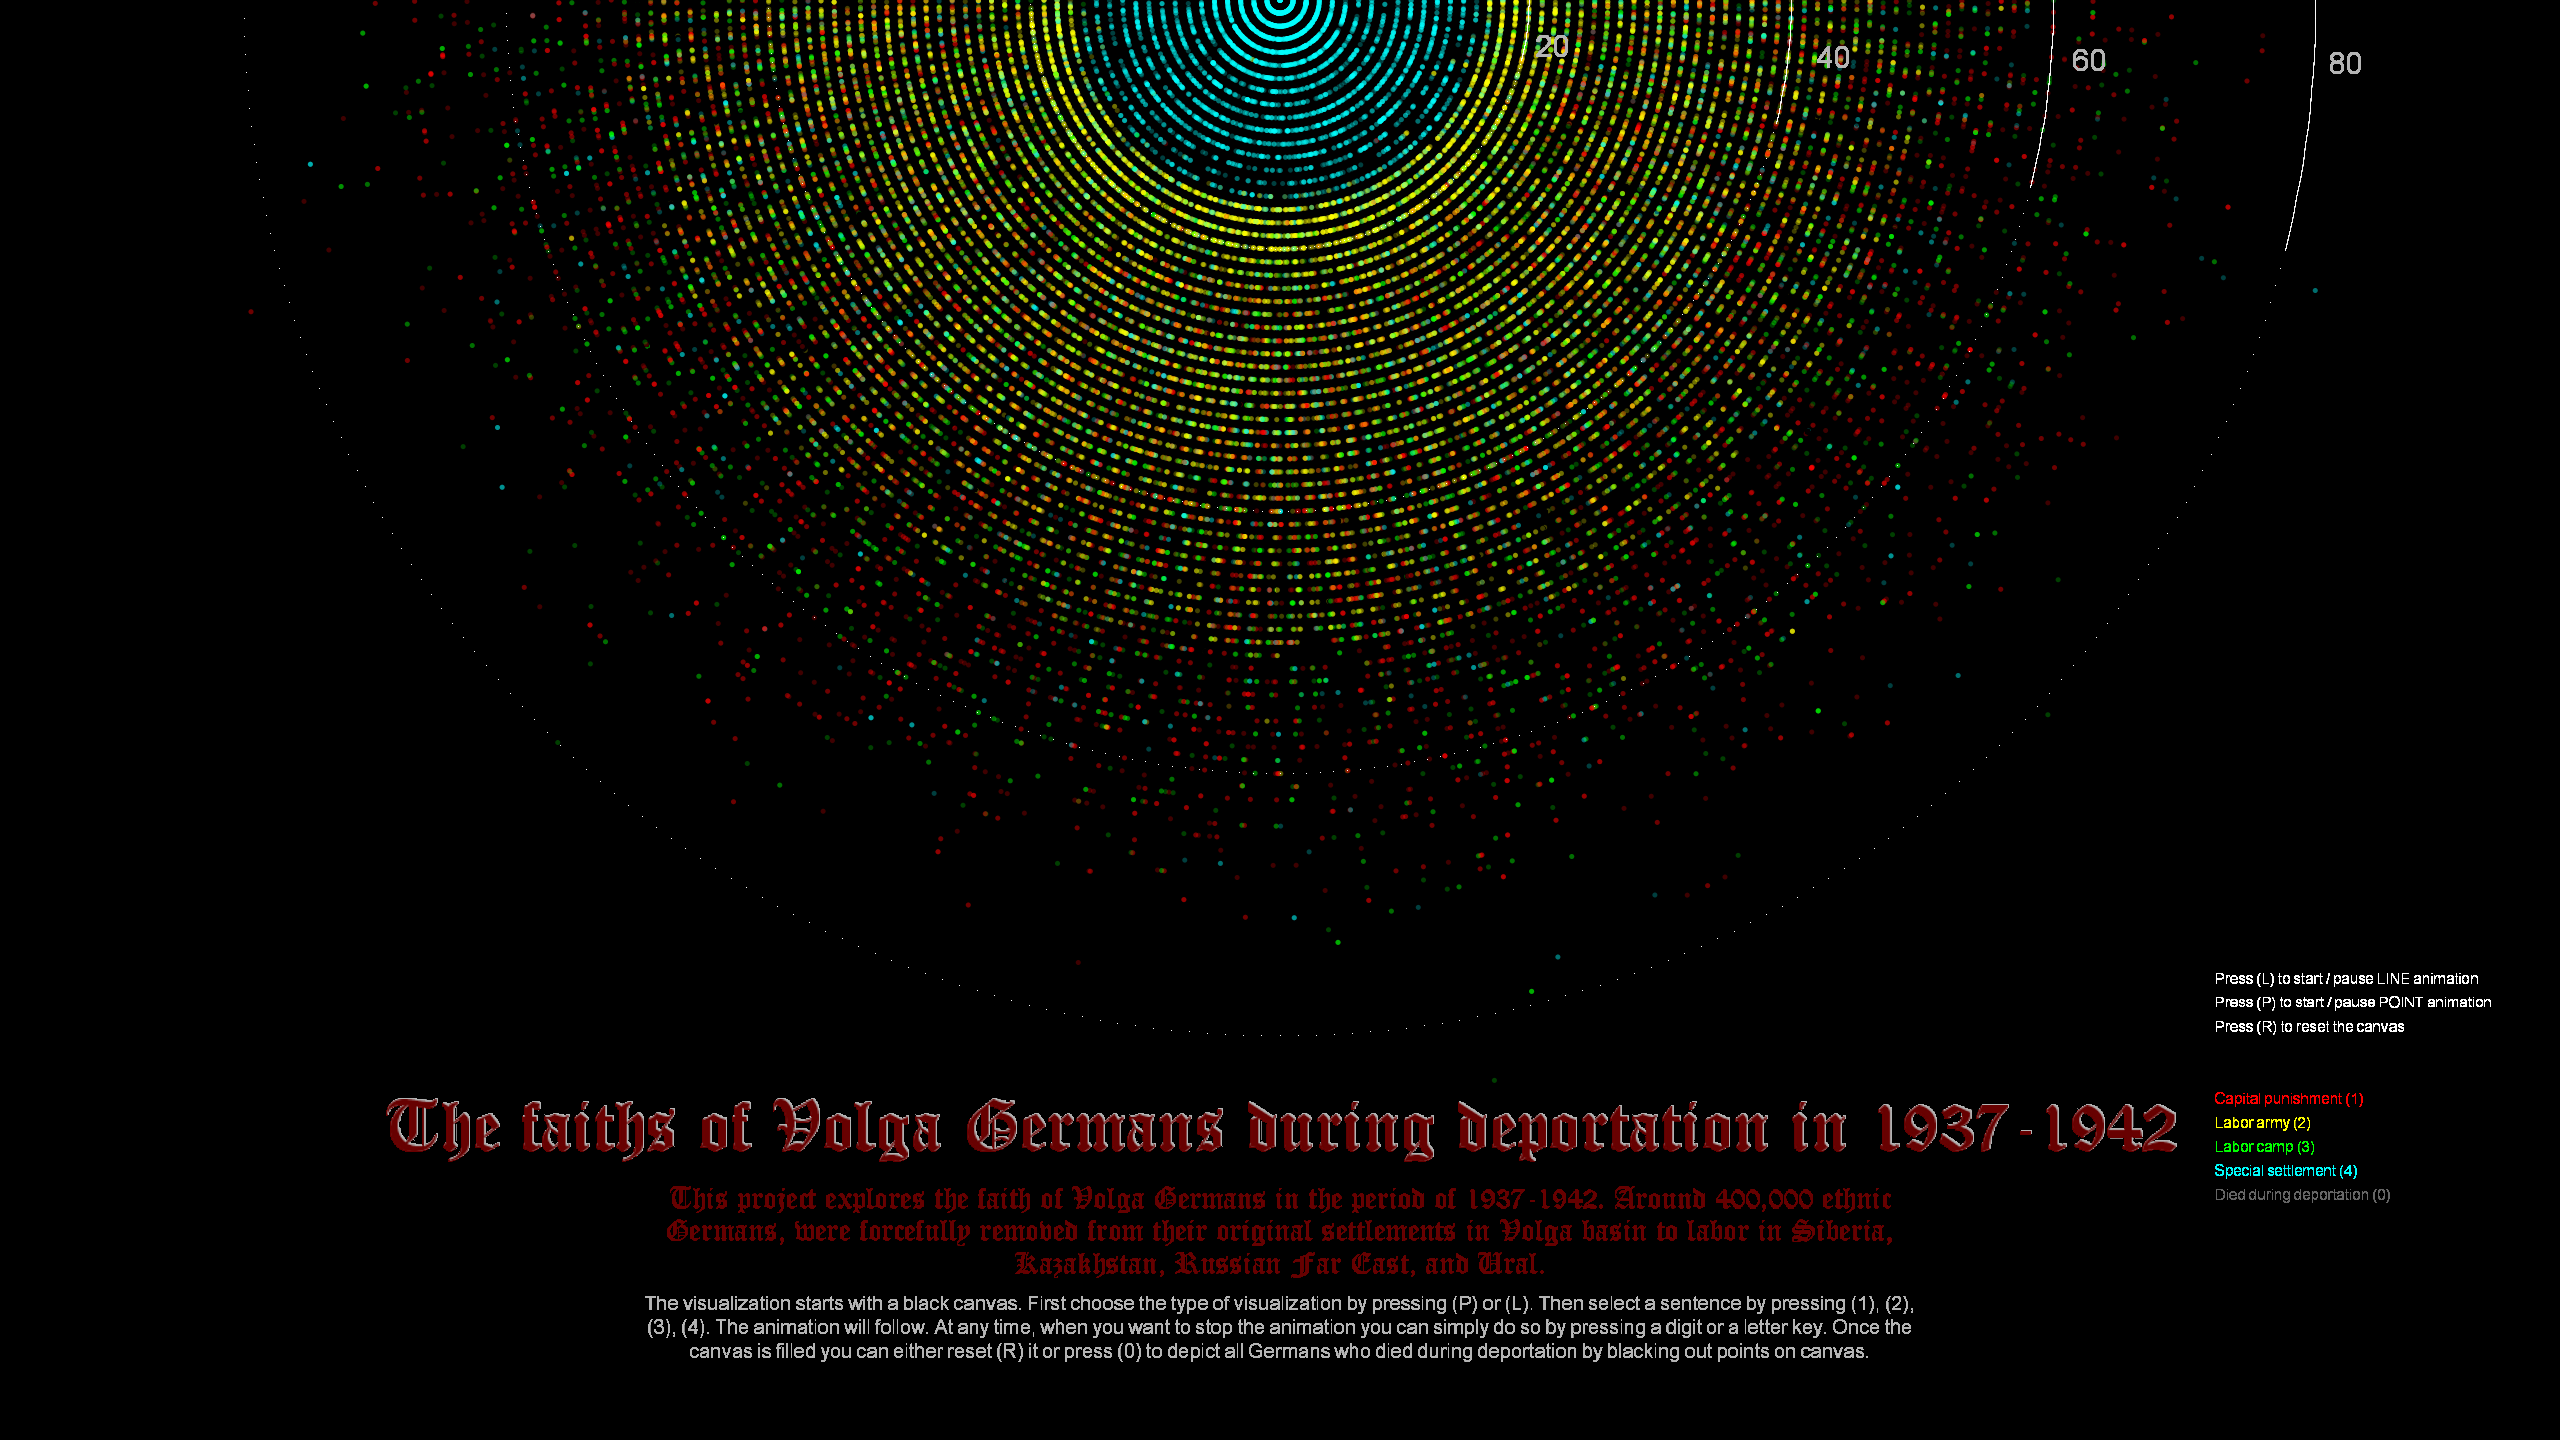
Final result
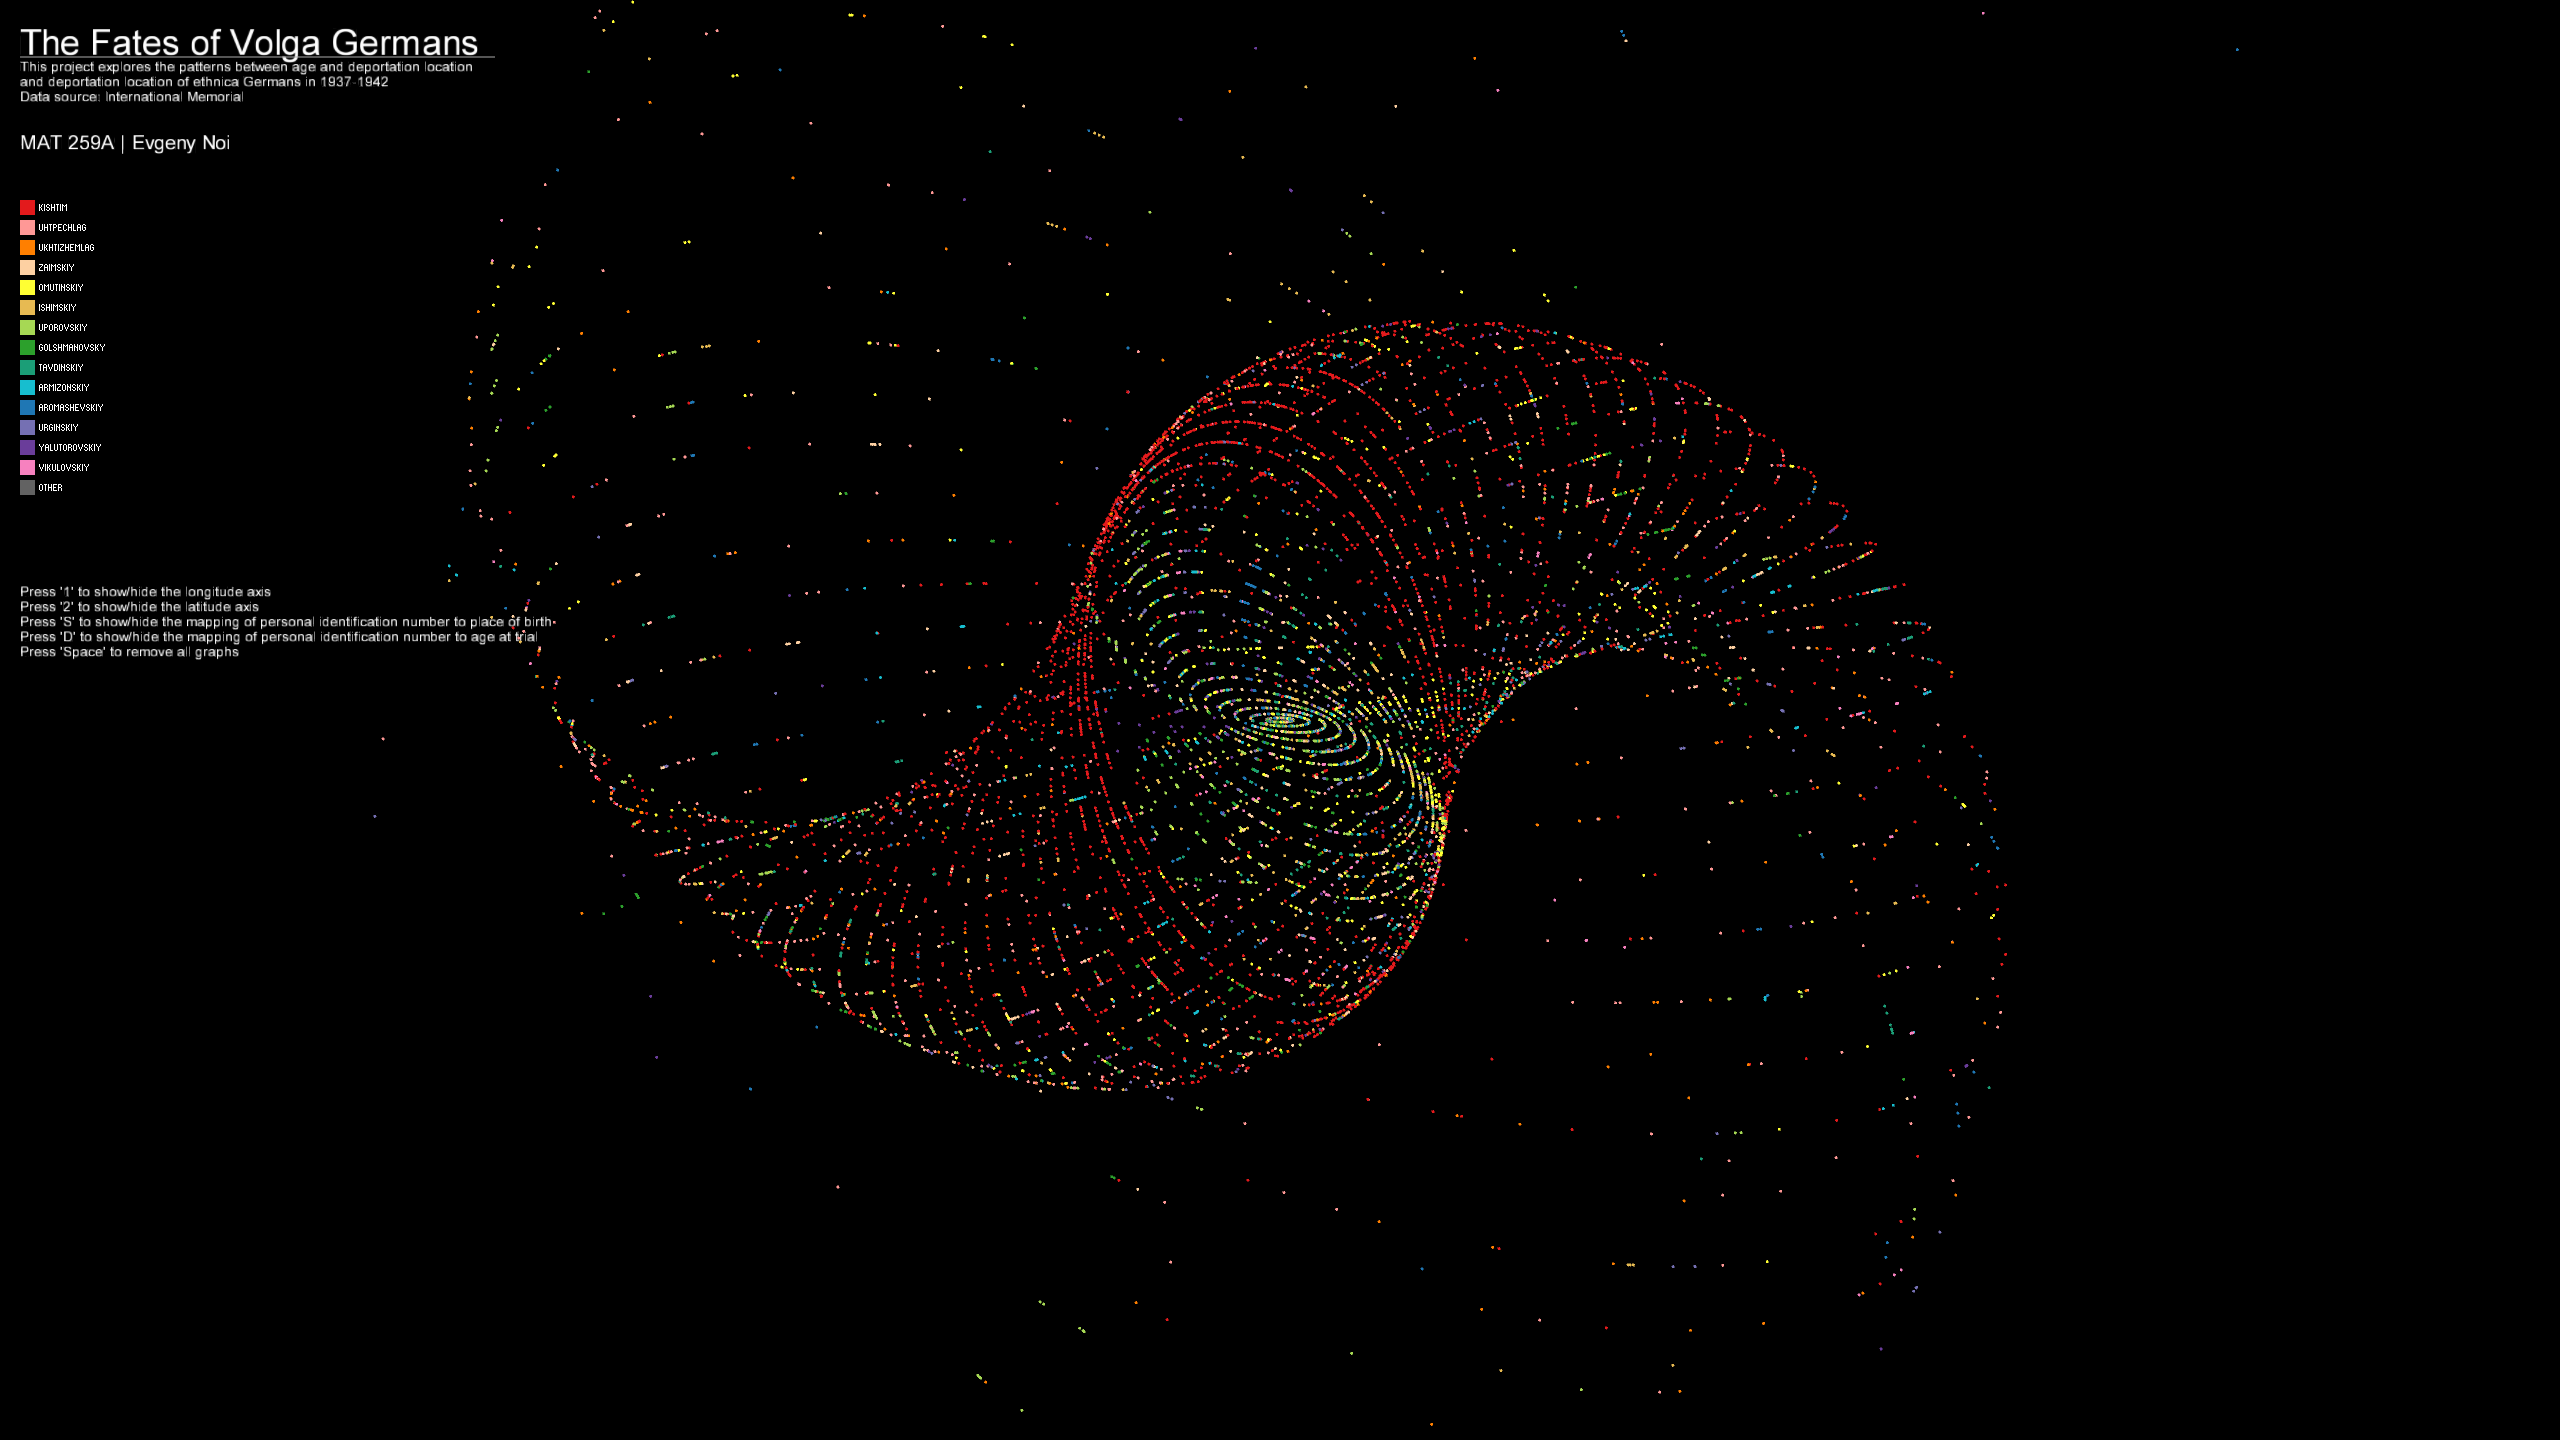
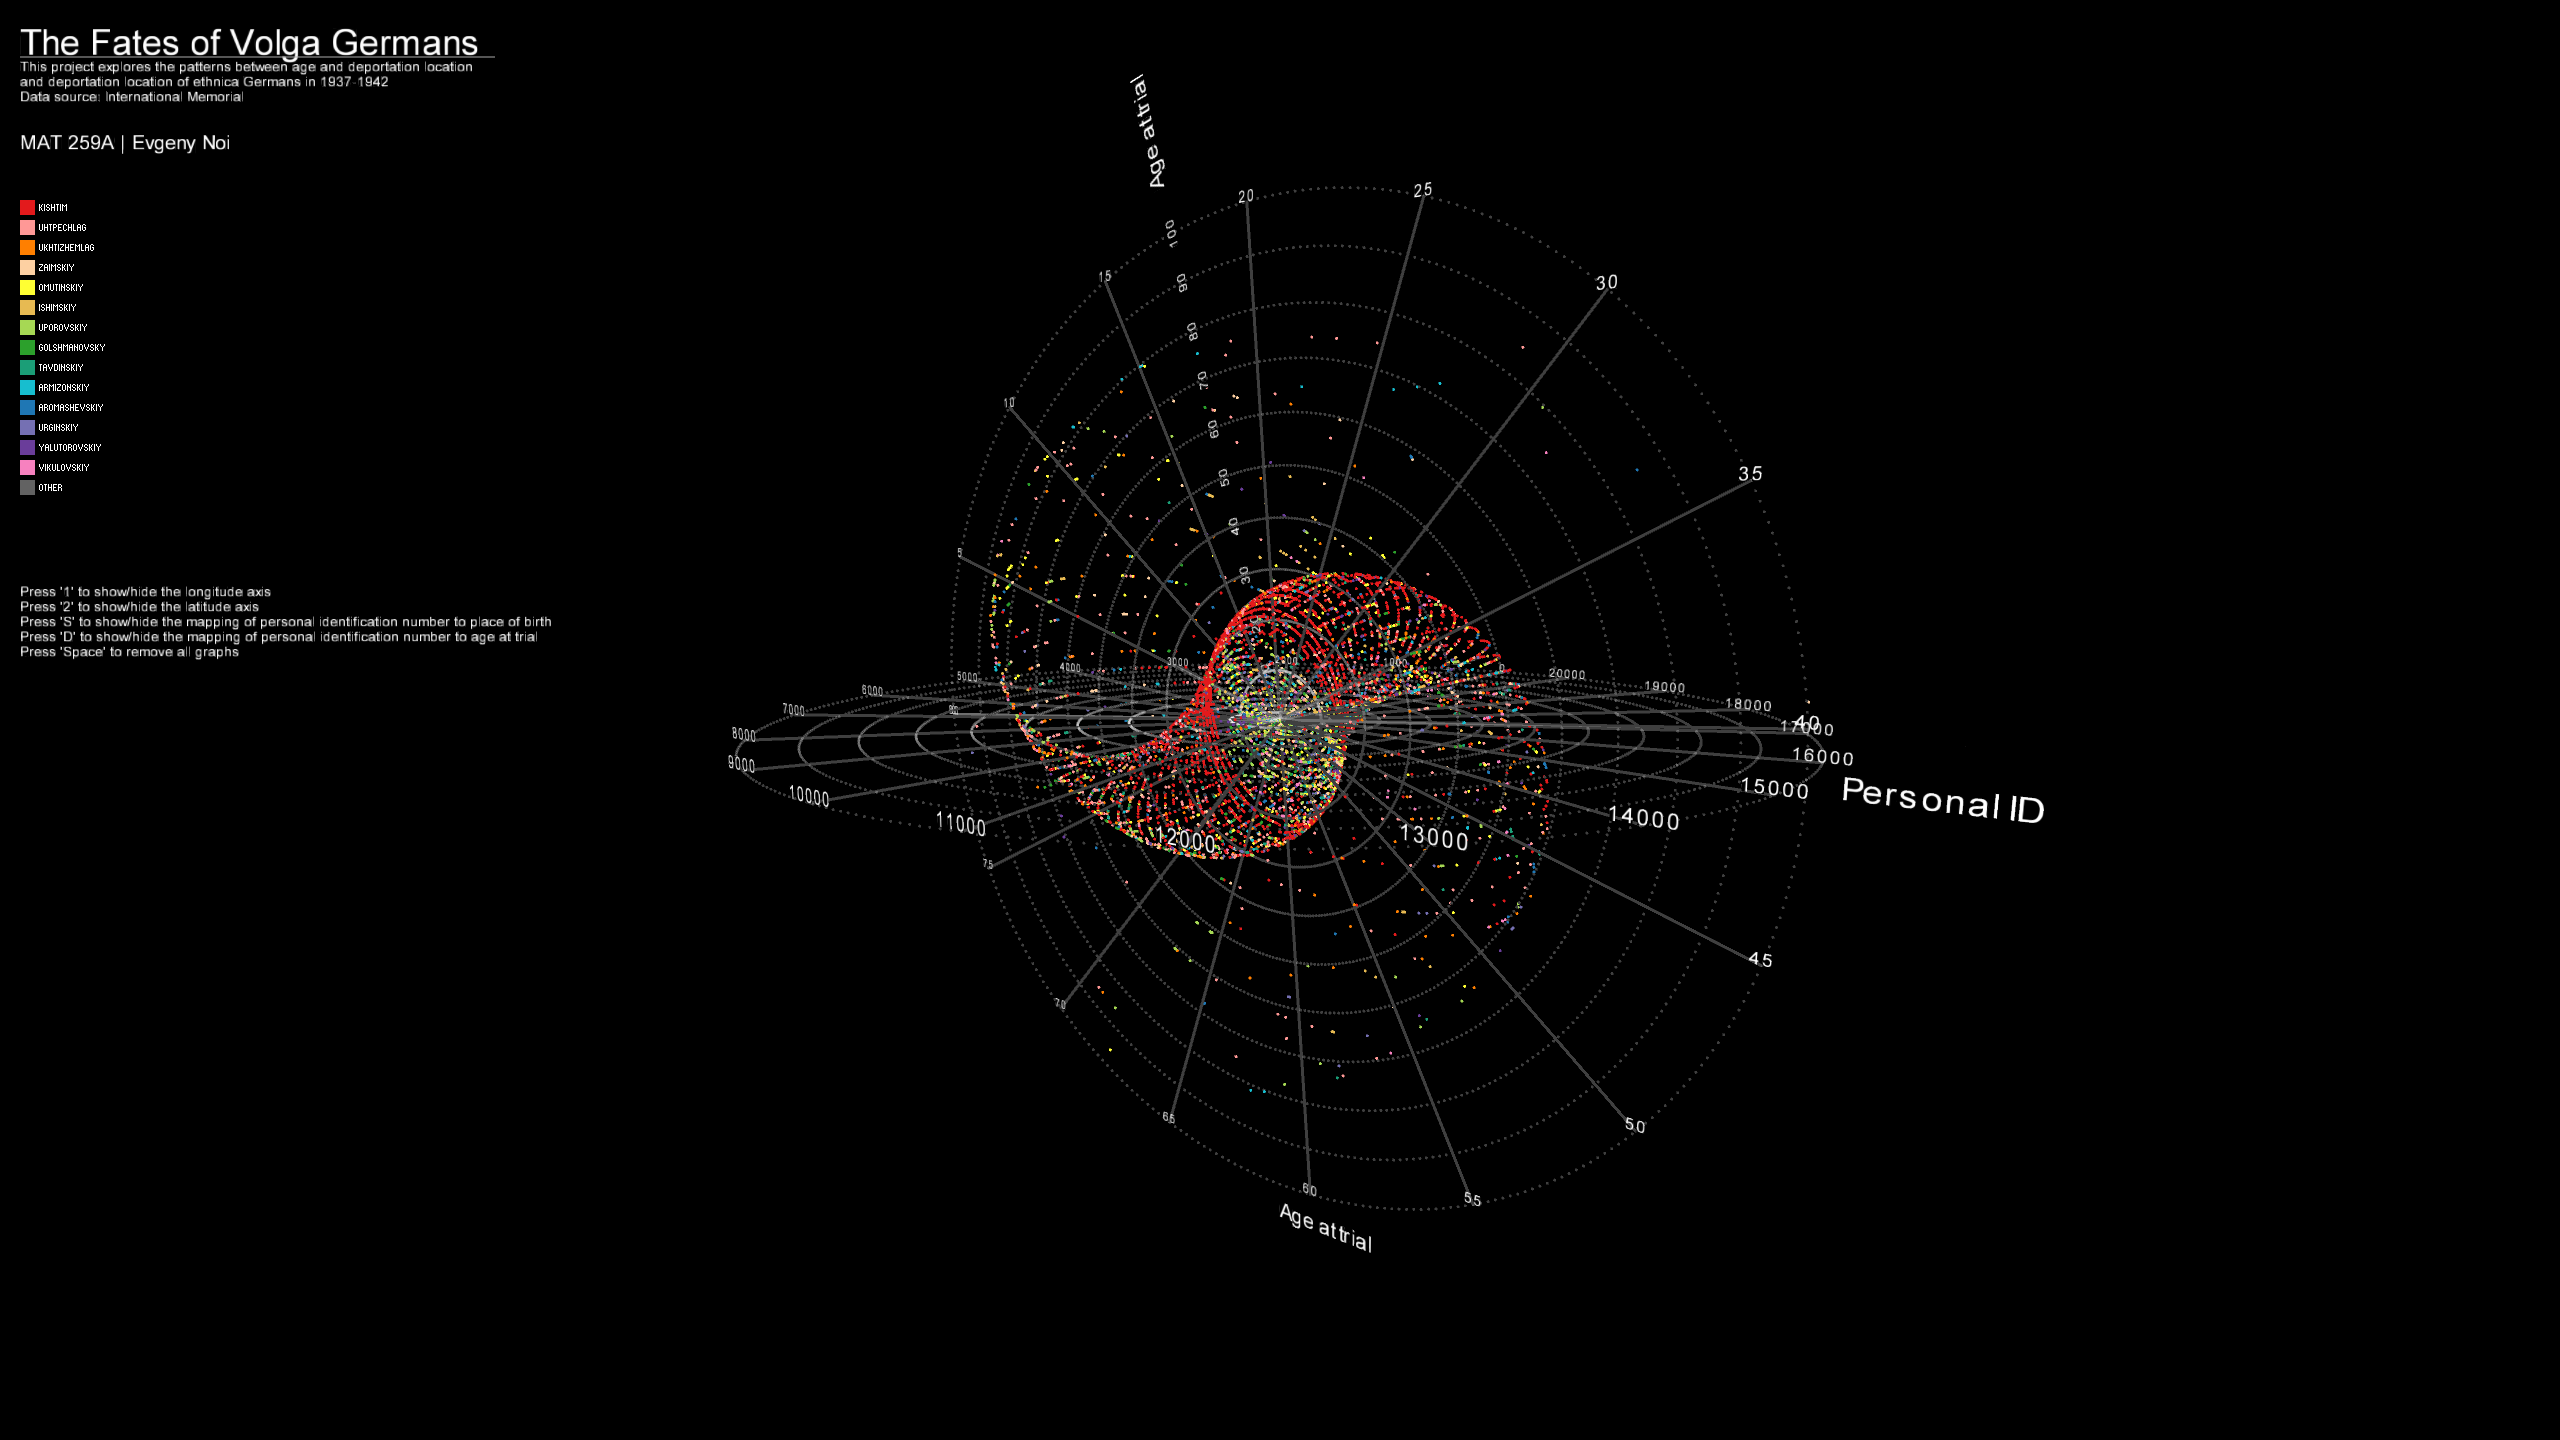
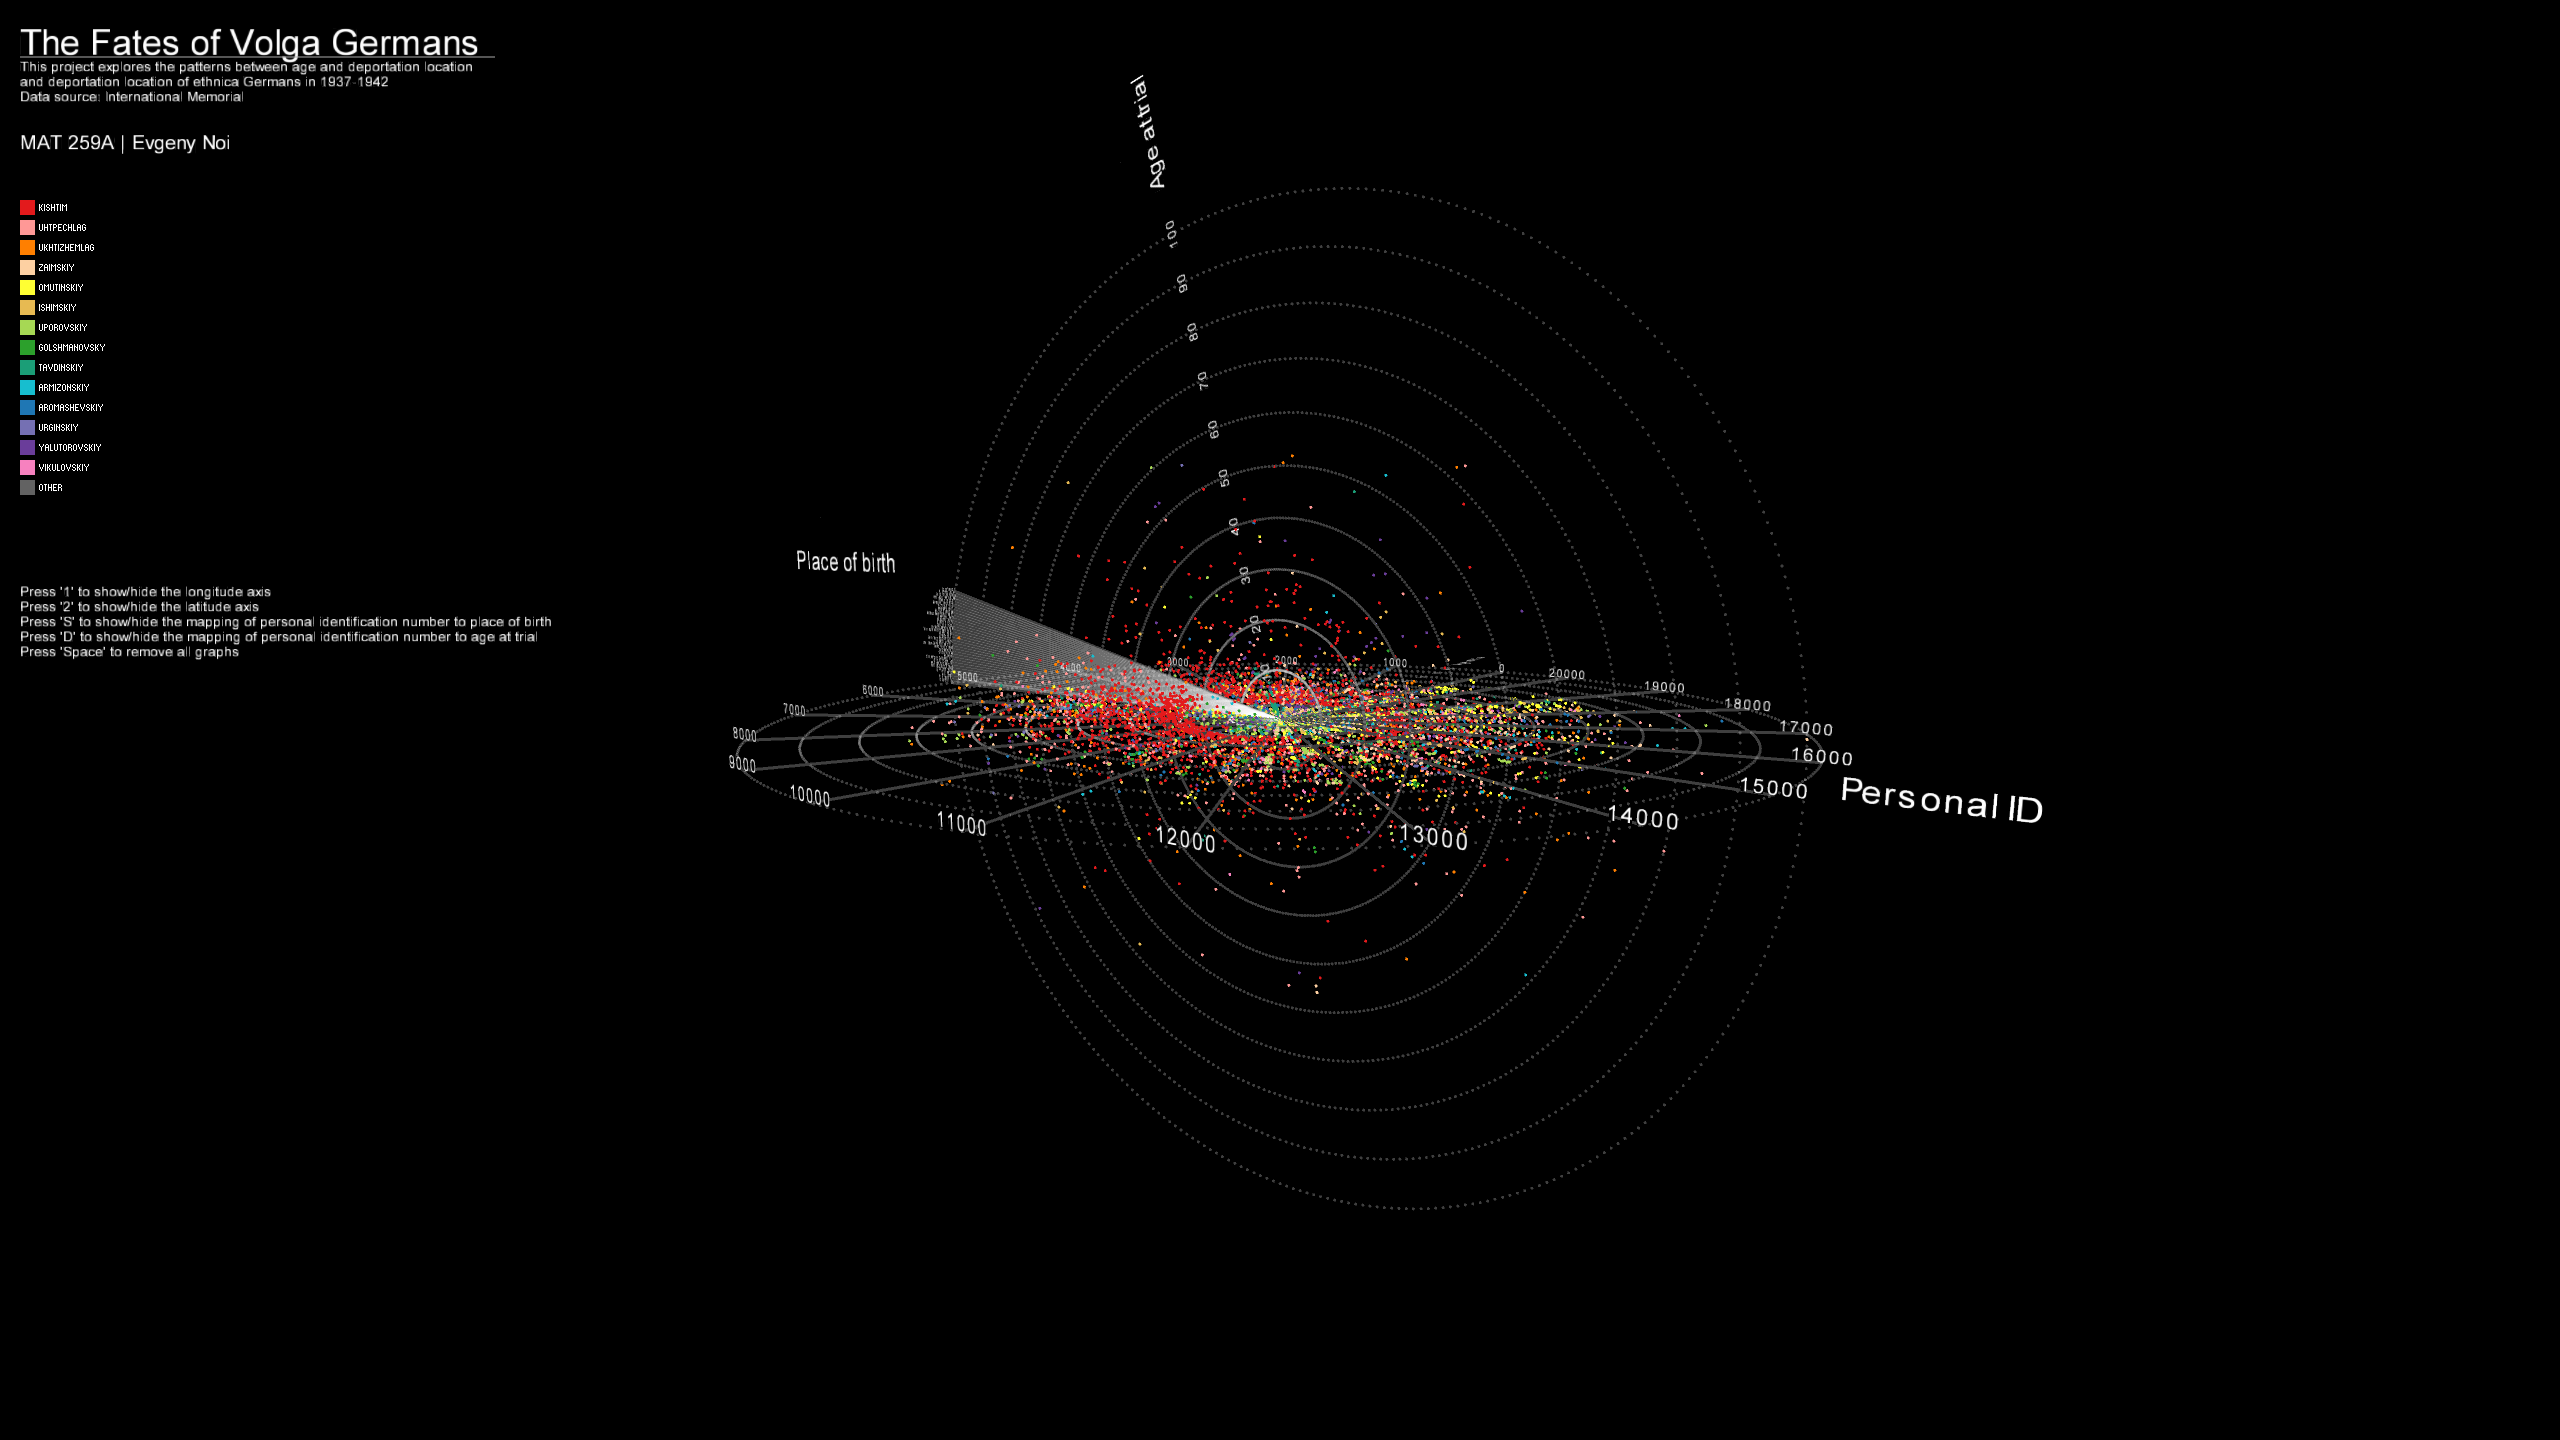
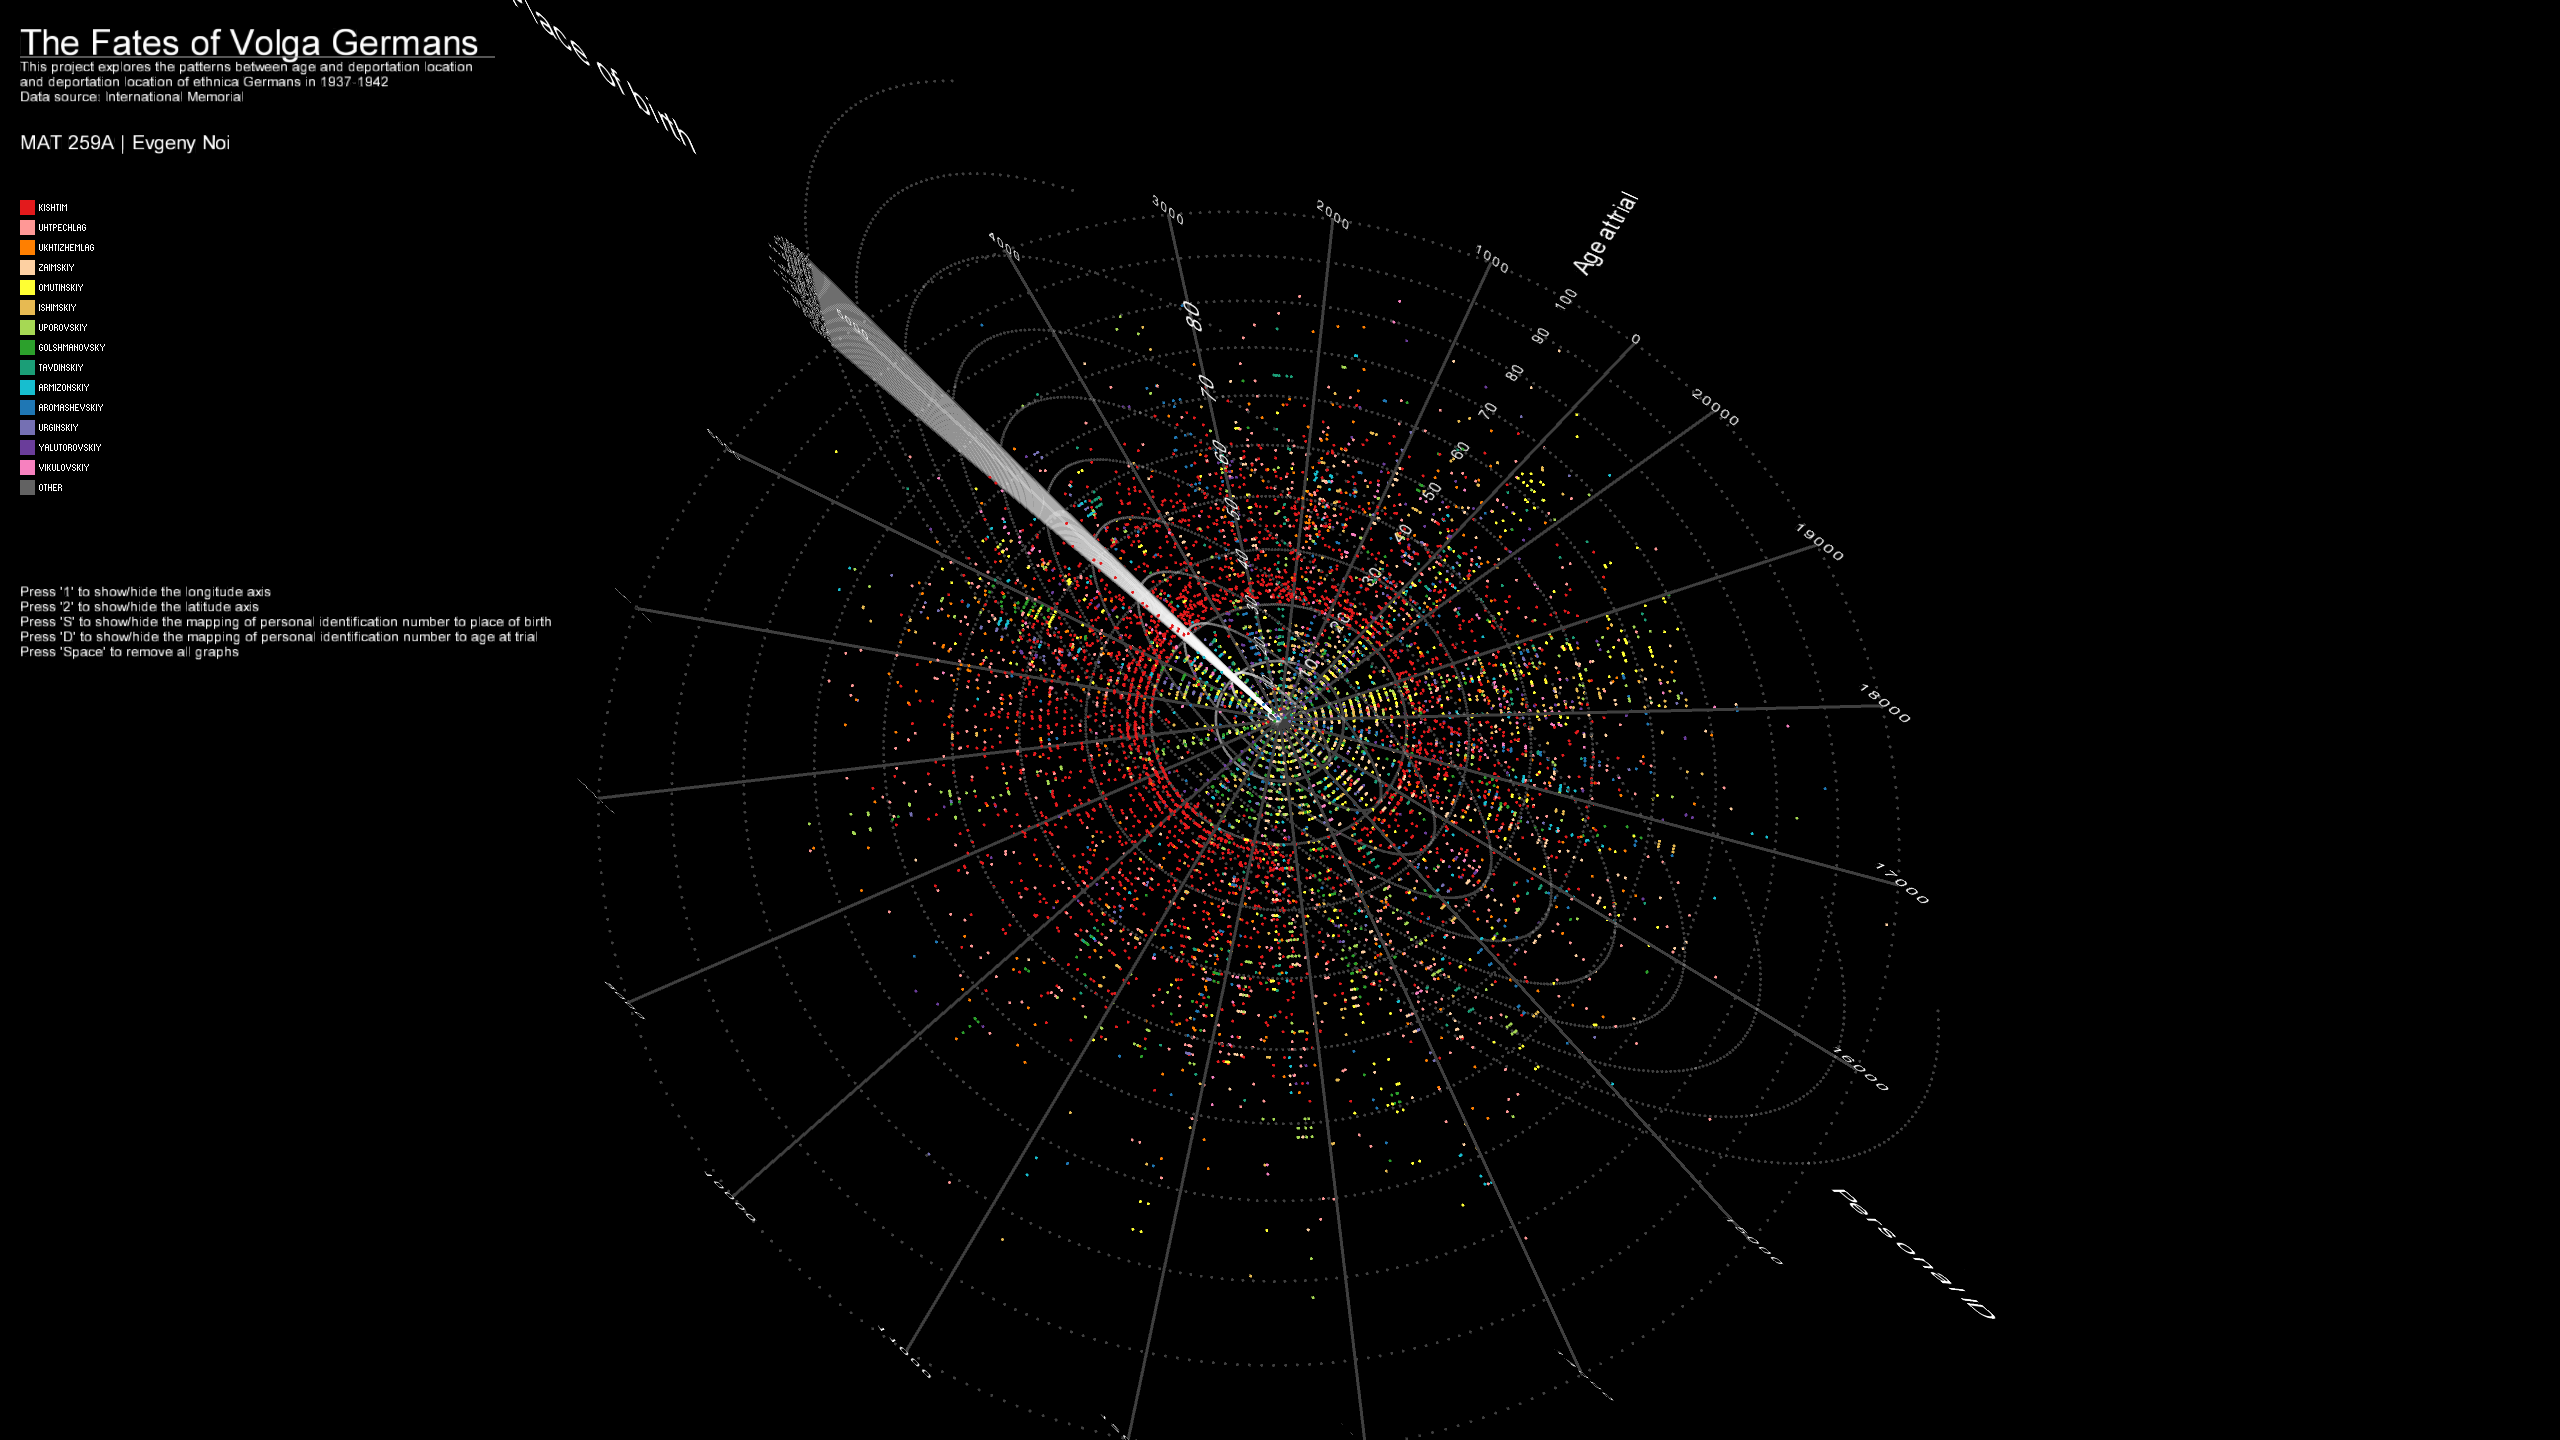
The final version of visualization has two modes as well: the spherical and seashell.
The seashell representation maps personal id (longitude), age (latitude) and age (radius).
The color denotes the destination (location) of deportation.
The seashell-like appearance stems from the double mapping of age, when the smaller values of latitude
correspond to smaller radii values. There are 15 checkboxes on the right for user controls,
each standing for a specific destination location. The words ending with 'iy' denote the
special settlement for the deportees. Analyzing the visualization you can see that there are many
more younger people who gets deported to special settlement, versus those working in
labor camps/army ('KISHTIM', 'UHTPECHLAG', 'UHTIZHEMLAG').
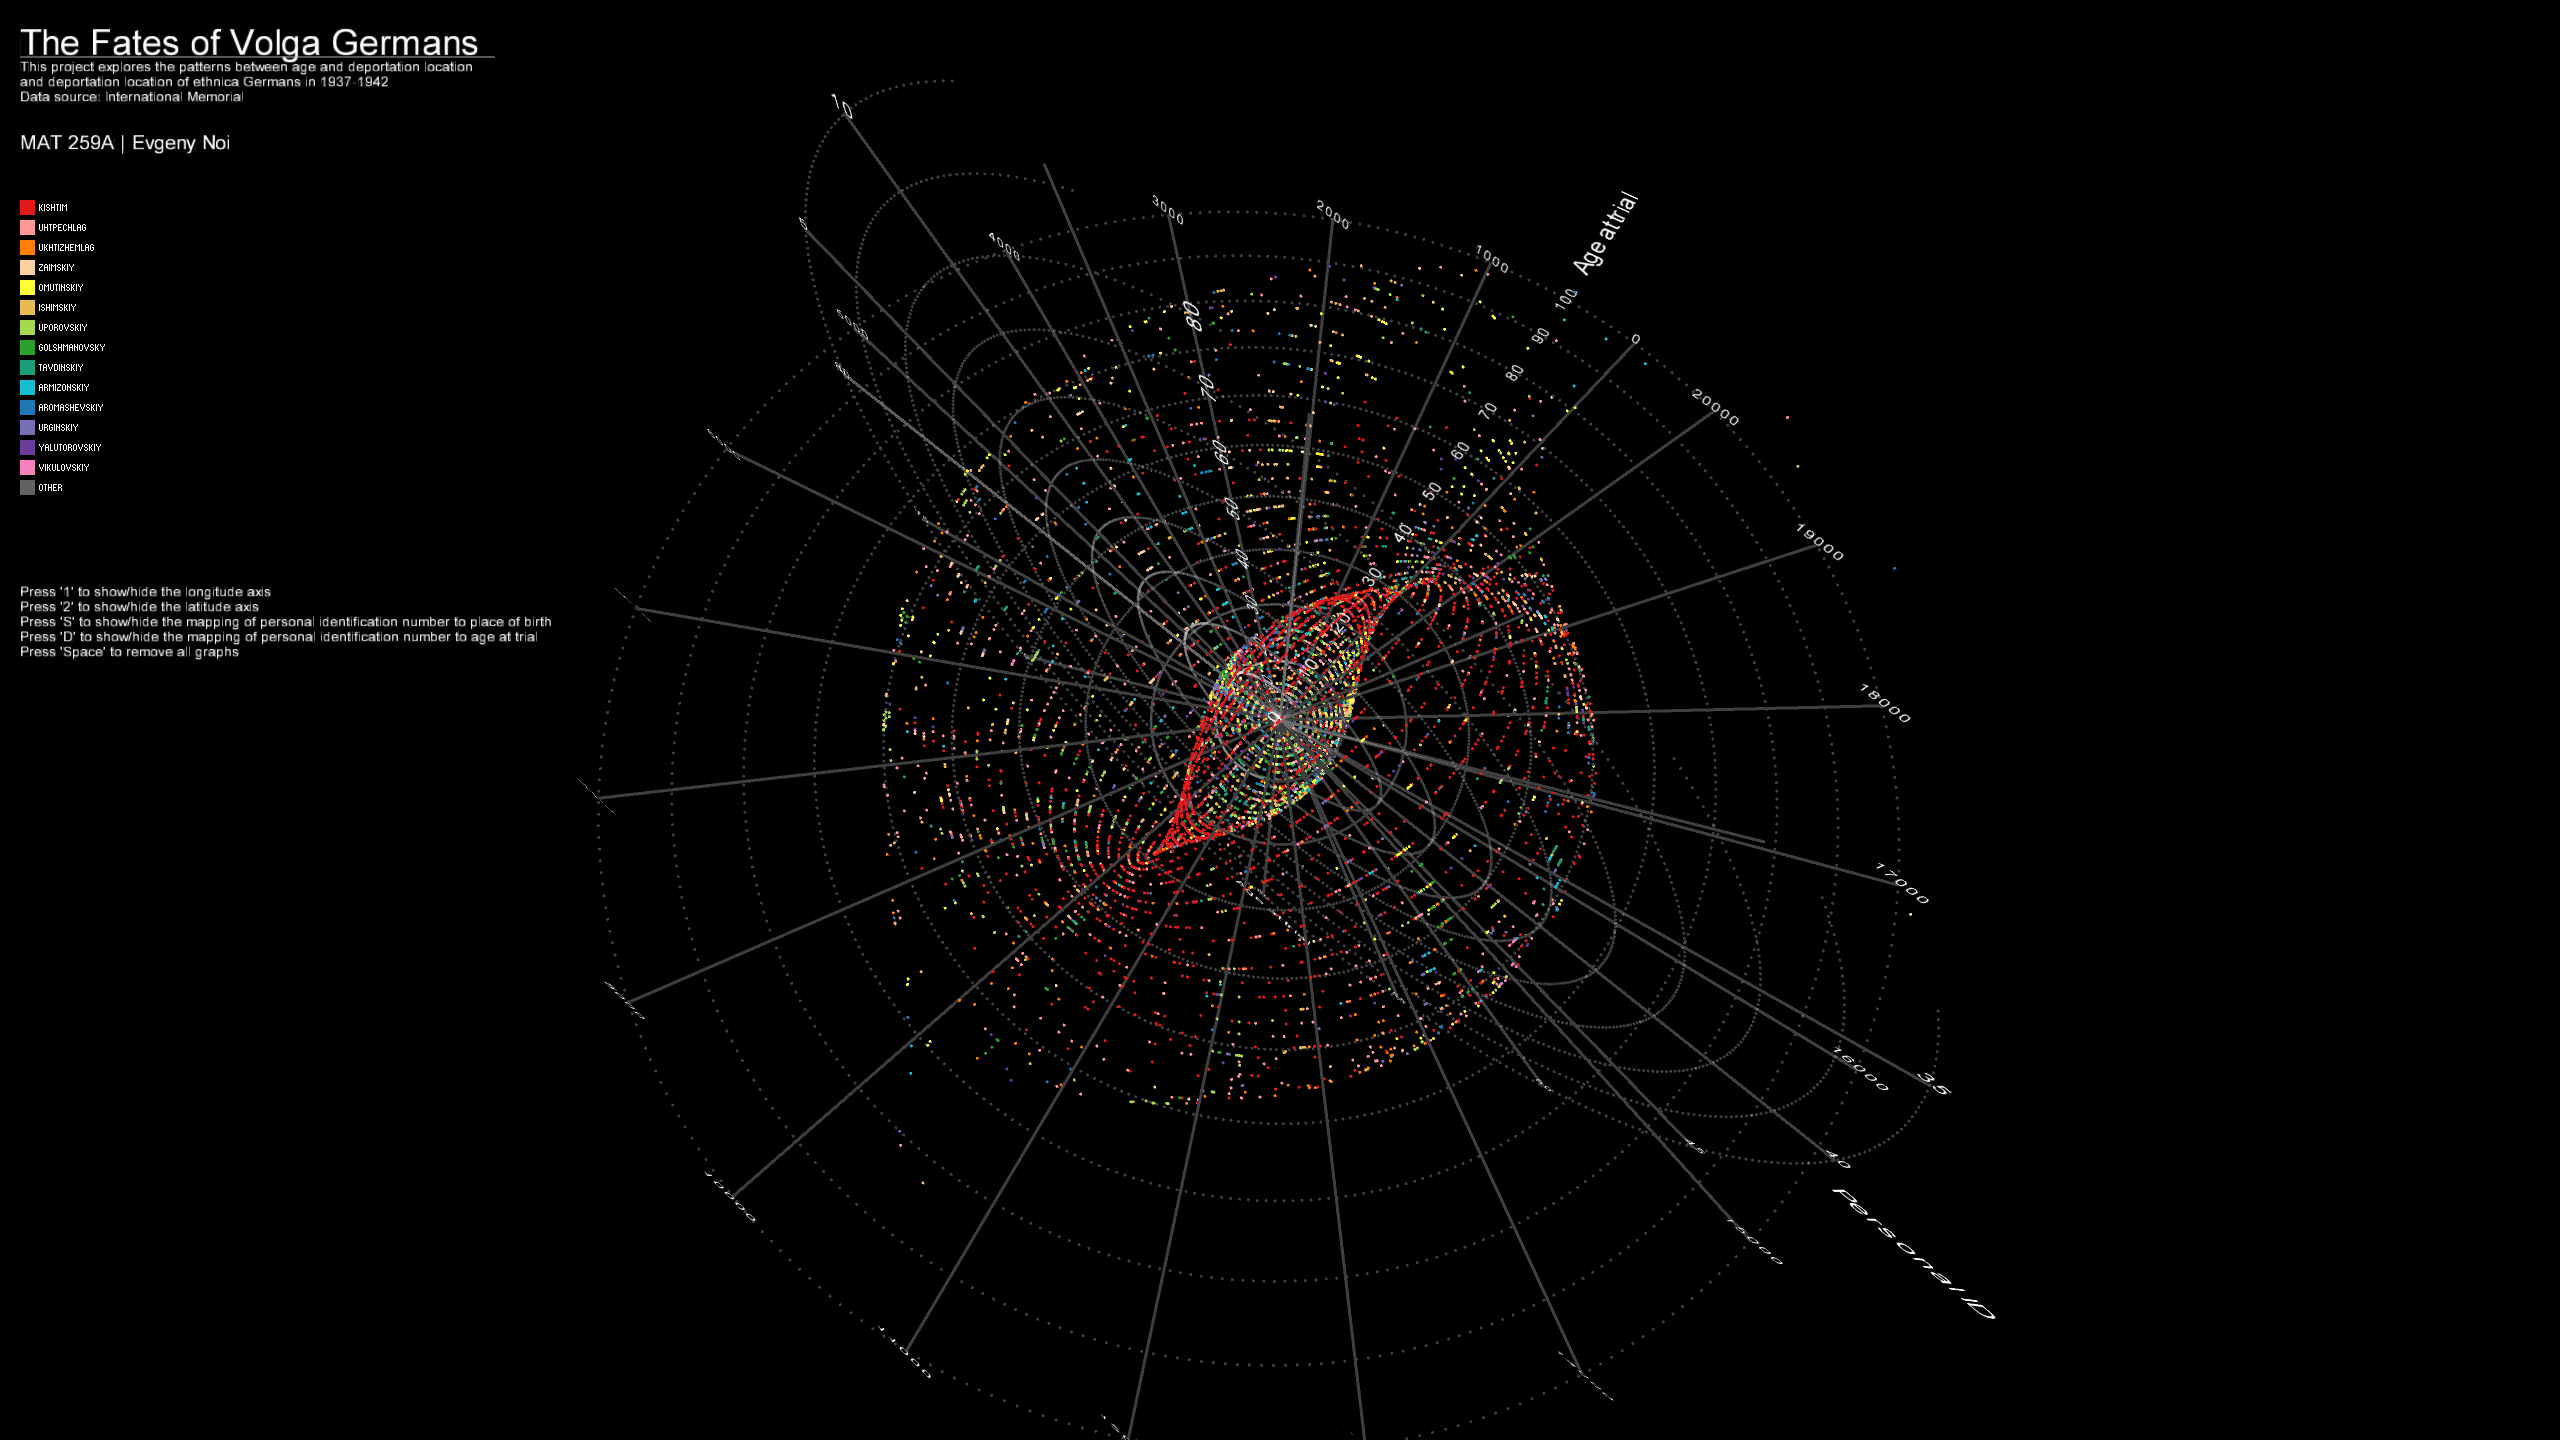
The spherical representation maps personal id (longitude), place of birth (latitude) and age (radius). The color denotes the destination (location) of deportation. As opposed to seashell, the points are evenly spread out, because none of the three variables are connected. Our earlier observations about age and destination holds in this representation. Additionally, we can make some inferences as to where these deportees were originally born. Majority of ethnic Germans were originally from the areas in nowadays Russia (Dobrinskiy and Frankskiy districts) and Ukraine (Zhitomir, Kiev, Odessa).
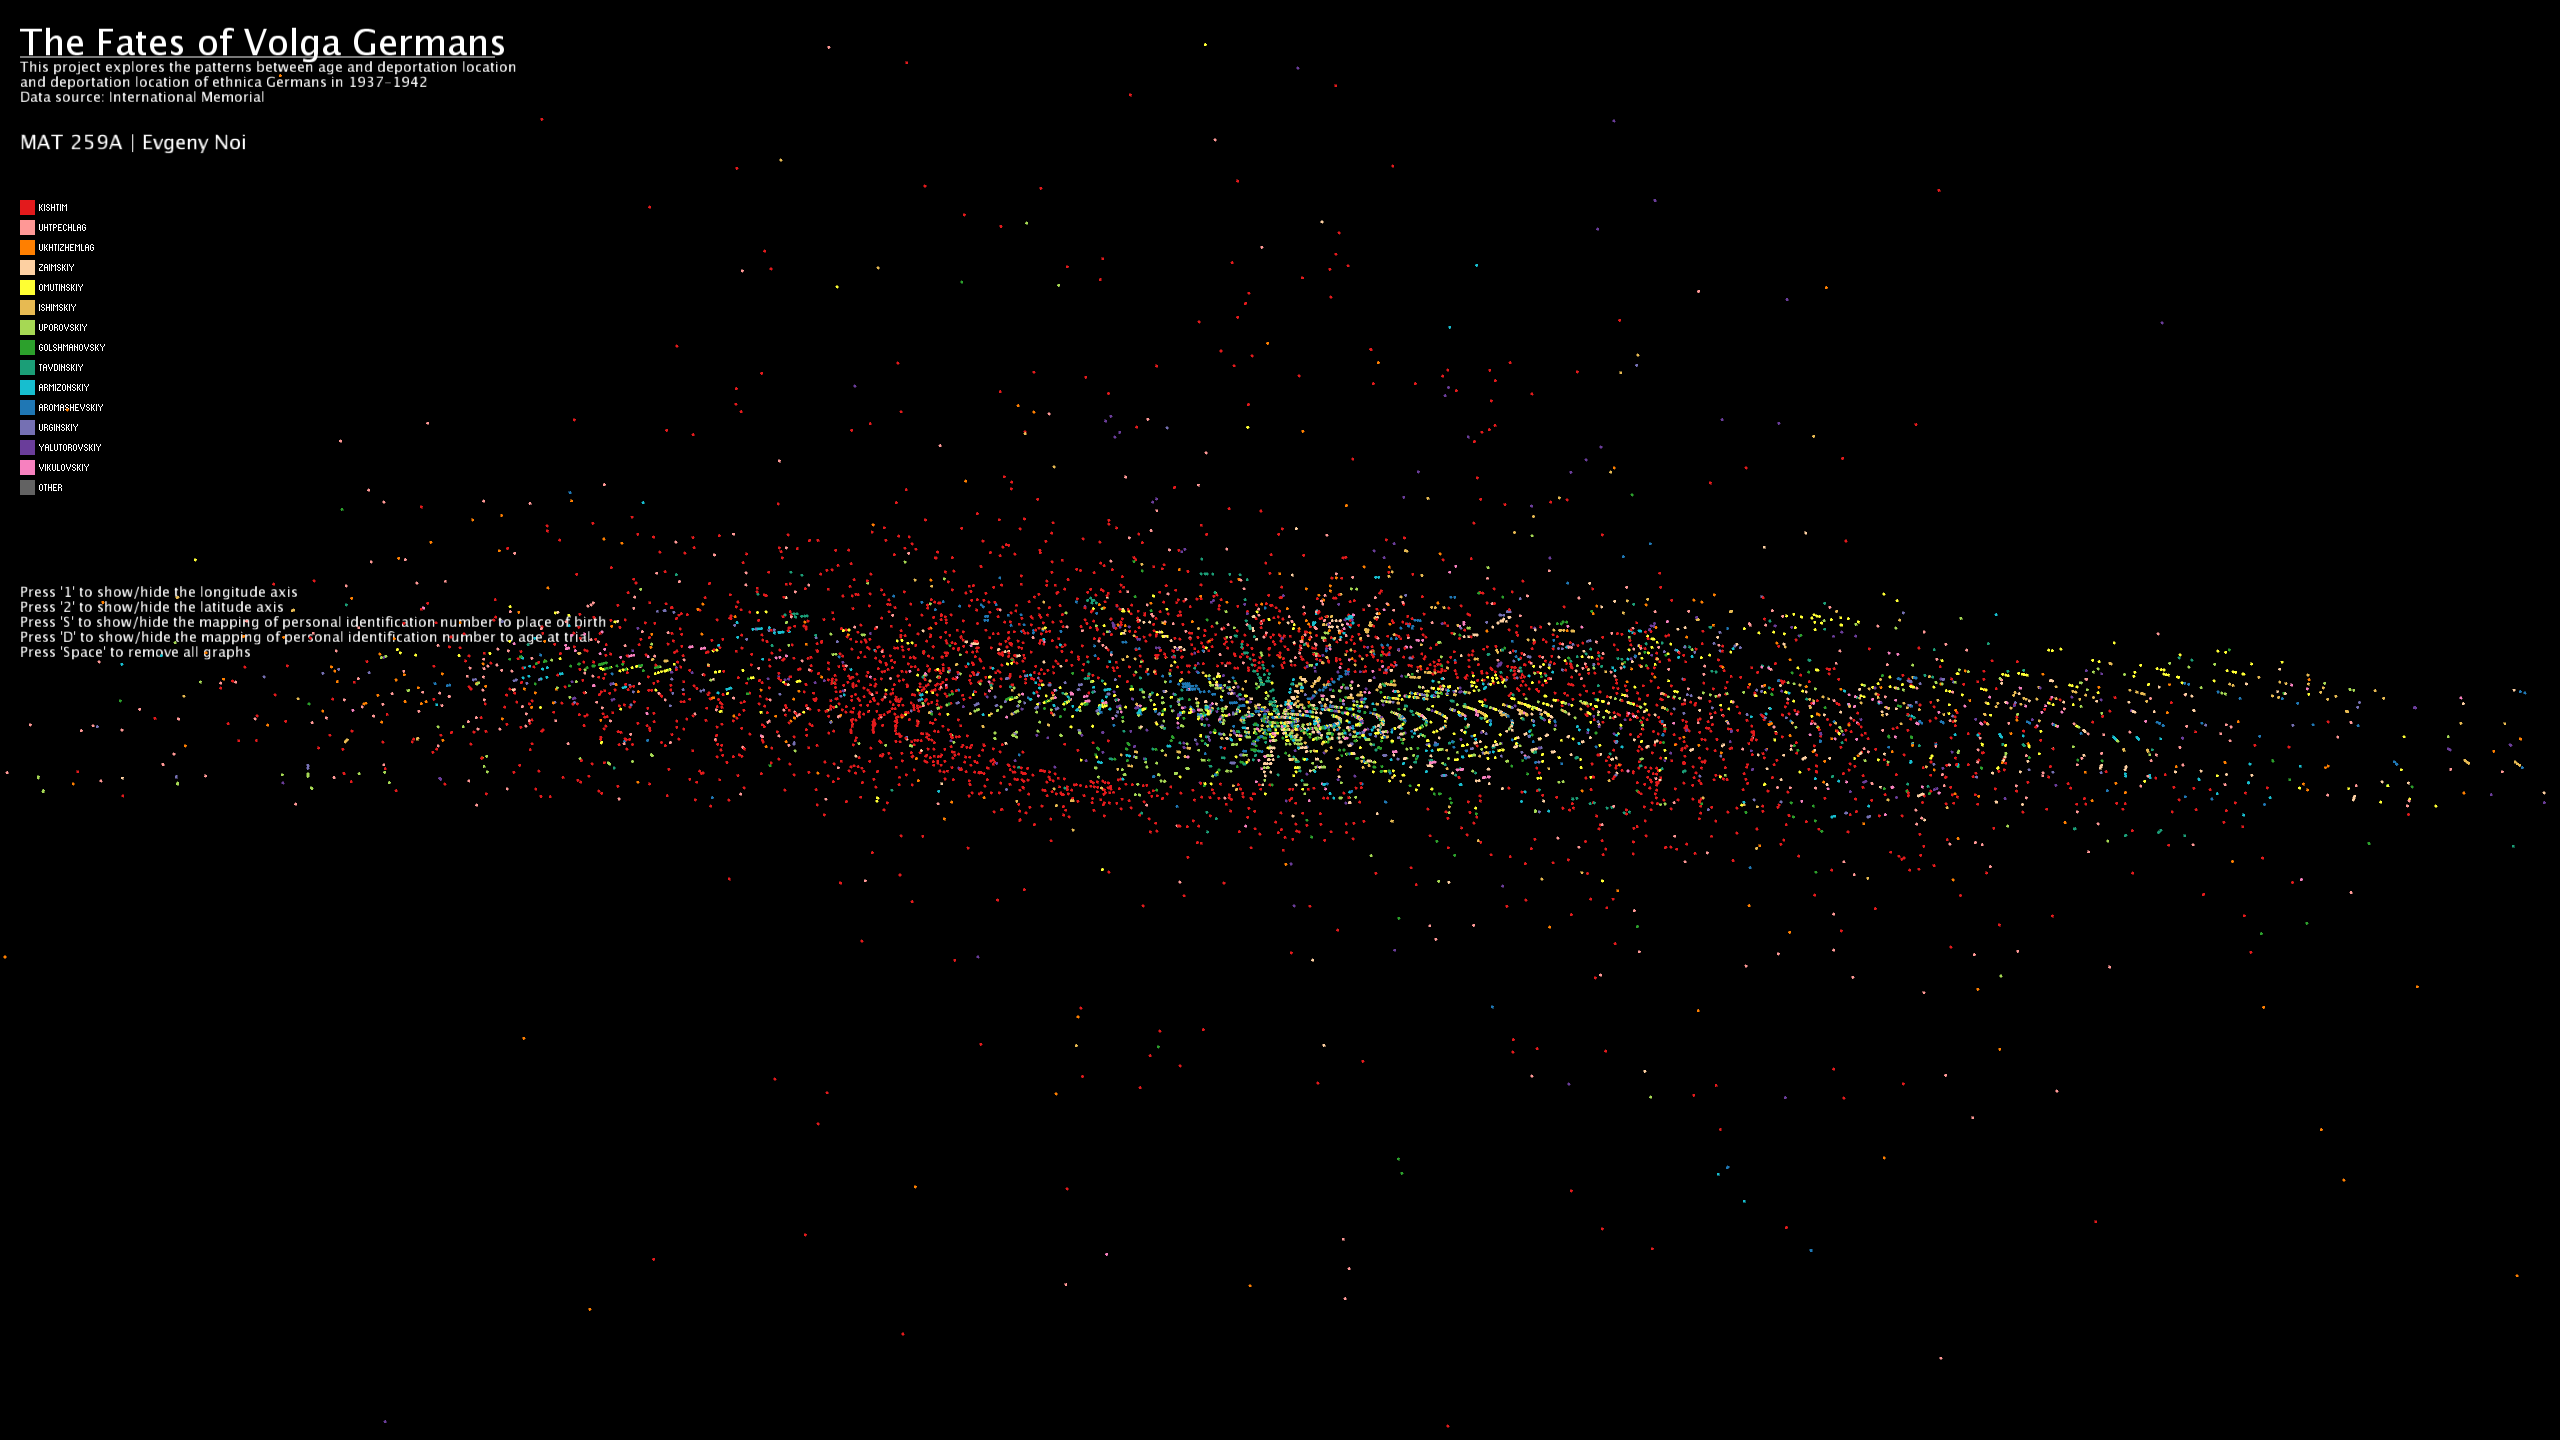
The spherical representation maps personal id (longitude), place of birth (latitude) and age (radius). The color denotes the destination (location) of deportation. As opposed to seashell, the points are evenly spread out, because none of the three variables are connected. Our earlier observations about age and destination holds in this representation. Additionally, we can make some inferences as to where these deportees were originally born. Majority of ethnic Germans were originally from the areas in nowadays Russia (Dobrinskiy and Frankskiy districts) and Ukraine (Zhitomir, Kiev, Odessa).
Code