MAT 259, 2020
Leo Lin
Concept
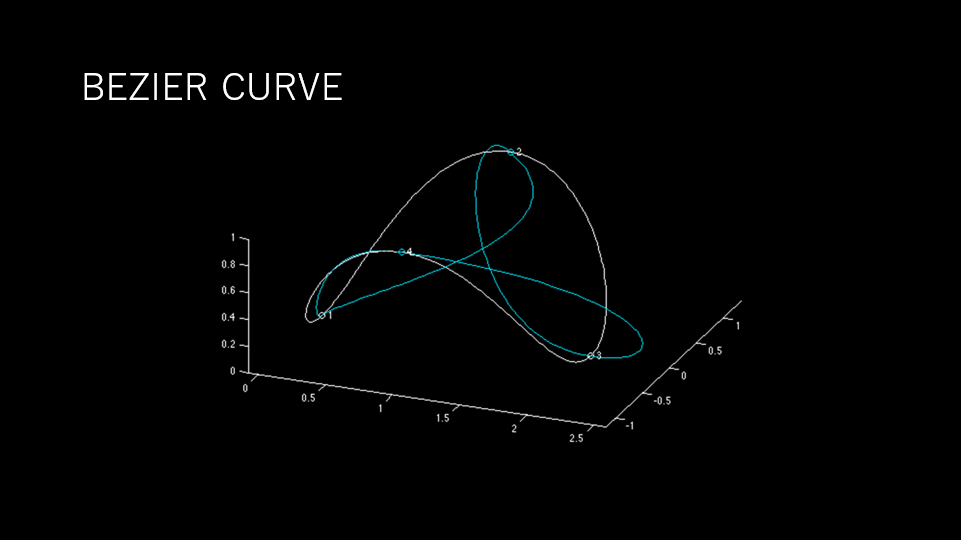
This is a 3D data visualization project finished with MySQL and P5 library. With the data provided by professor George Legrady, I was able to access some of the data from The Seattle Public Library. I chose some data set with check in and check out data during 2018 to visualize the trend of flow in different Dew class in the library. I chose to use Bezier curve to express some different meaning in dimensions of 3D space.
Query
At first, I tried to collect all the data from 2006 to 2018 and piece them by month. But then I found the data in these years are too scattered for showing in 3D space, because I needed to connect each month with its own check in and check out and this would happened in 12(months for each year) * 12(months for each year) * 13 years. Though it is easy for p5 to handle these data, the result would be too complex for audience to see the results. I chose to use the data set in 2018 and represent each month in order. Here is MySQL code for collecting check in and check out data for each month in 2018, and I divided each dew class into each part. Here is just the sample of the code. Because I have to adjust the code every time I change the month, so it could be different every time.
SELECT
MONTH(cout),
SUM(CASE
WHEN deweyClass > 770 AND deweyClass < 771 THEN 1
ELSE 0
END) AS D000to099,
SUM(CASE
WHEN deweyClass > 771 AND deweyClass < 772 THEN 1
ELSE 0
END) AS D100to199,
SUM(CASE
WHEN deweyClass > 772 AND deweyClass < 773 THEN 1
ELSE 0
END) AS D200to299,
SUM(CASE
WHEN deweyClass > 773 AND deweyClass < 774 THEN 1
ELSE 0
END) AS D300to399,
SUM(CASE
WHEN deweyClass > 774 AND deweyClass < 775 THEN 1
ELSE 0
END) AS D400to499,
SUM(CASE
WHEN deweyClass > 775 AND deweyClass < 776 THEN 1
ELSE 0
END) AS D500to599,
SUM(CASE
WHEN deweyClass > 776 AND deweyClass < 777 THEN 1
ELSE 0
END) AS D600to699,
SUM(CASE
WHEN deweyClass > 777 AND deweyClass < 778 THEN 1
ELSE 0
END) AS D700to799,
SUM(CASE
WHEN deweyClass > 778 AND deweyClass < 779 THEN 1
ELSE 0
END) AS D800to899,
SUM(CASE
WHEN deweyClass > 779 AND deweyClass < 780 THEN 1
ELSE 0
END) AS D900to999
FROM
spl_2016.inraw
WHERE
deweyClass >= 0 and
year(cout) = '2018'
GROUP BY MONTH(cout);
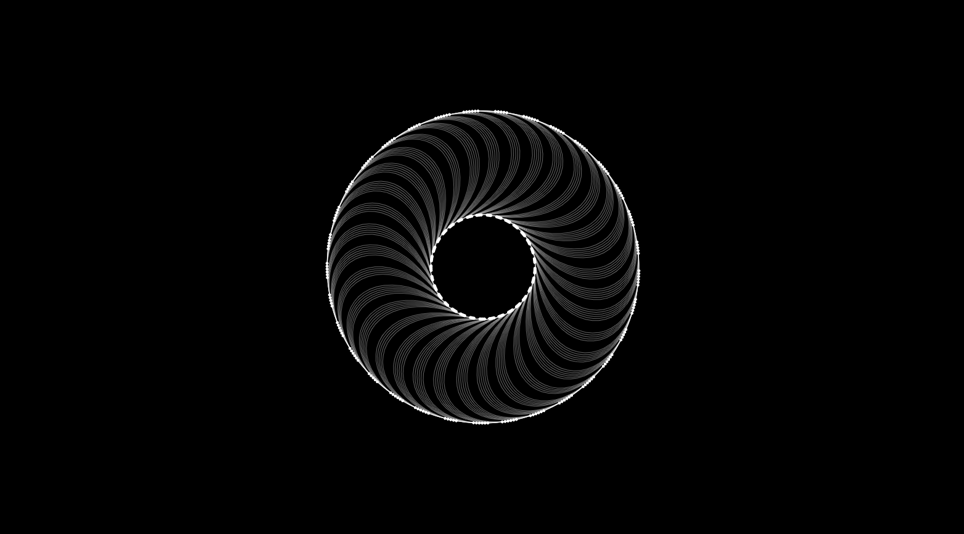
Preliminary sketches
I want to build a visualization based on Bezier curve in 3D space. I coded a little script to sketch the look in 2D surface.
Process
I coded a little script to sketch the look in 2D surface.
Here is the code.
x1 = sin(radians(0))*r;
y1 = cos(radians(0))*r;
x4 = sin(radians(0))*r/3;
y4 = cos(radians(0))*r/3;
x2 = x1-180;
y2 = y1;
x3 = x4-180;
y3 = y4;
rotate(i);
beginShape();
noFill();
stroke(‘white’,100);
vertex(x1,y1);
bezierVertex(x2,y2,x3,y3,x4,y4);
endShape();
fill(’white’);
noStroke();
ellipse(x1,y1,5,5);
ellipse(x4,y4,5,5);
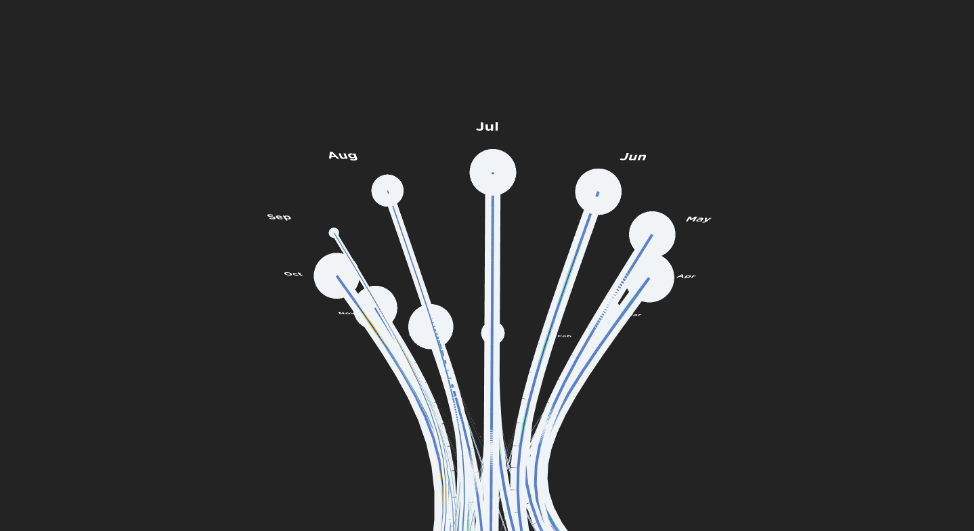
Final result
All the points represent the amount of check-in or check-out in month in 2018. The sizes of these points are controlled by the amount of check-in or check-out for each month. With different dew class, I chose different color and control point to draw curve from start point. The starting points and ending points are always the points which represents heck-out months and check-in months. Each big class of dew, such as 0-99, 100-199, 200-299 … etc. has their own control point to direct the curve.

Code