Project 2 - 3D Visualization - Trends in Parasychology & the Occult at SPL
MAT 259, 2020
Erin Woo
Concept
After watching the movie Hereditary, I was inspired to investigate trends and patterns in checkouts related to the paranormal and the occult. Many projects have previously examined popular topics such as science and religion, but I was fascinated by this genre since it belongs to neither of these categories. Sometimes, we experience things that cannot be explained by science-- so, when do we turn to the supernatural for explanation?
Query
The query for this dataset was very simple. The only data I needed was the checkout date of each title, the Dewey class and the checkout counts. The results were then returned in chronological order to make it easier to loop through the data when drawing it in the sketch.
SELECT deweyClass, bibNumber, title, DATE(cout), COUNT(bibNumber)

FROM spl_2016.outraw

WHERE deweyClass < 140 AND deweyClass >= 130

GROUP BY title, bibNumber

ORDER BY DATE(cout) ASC
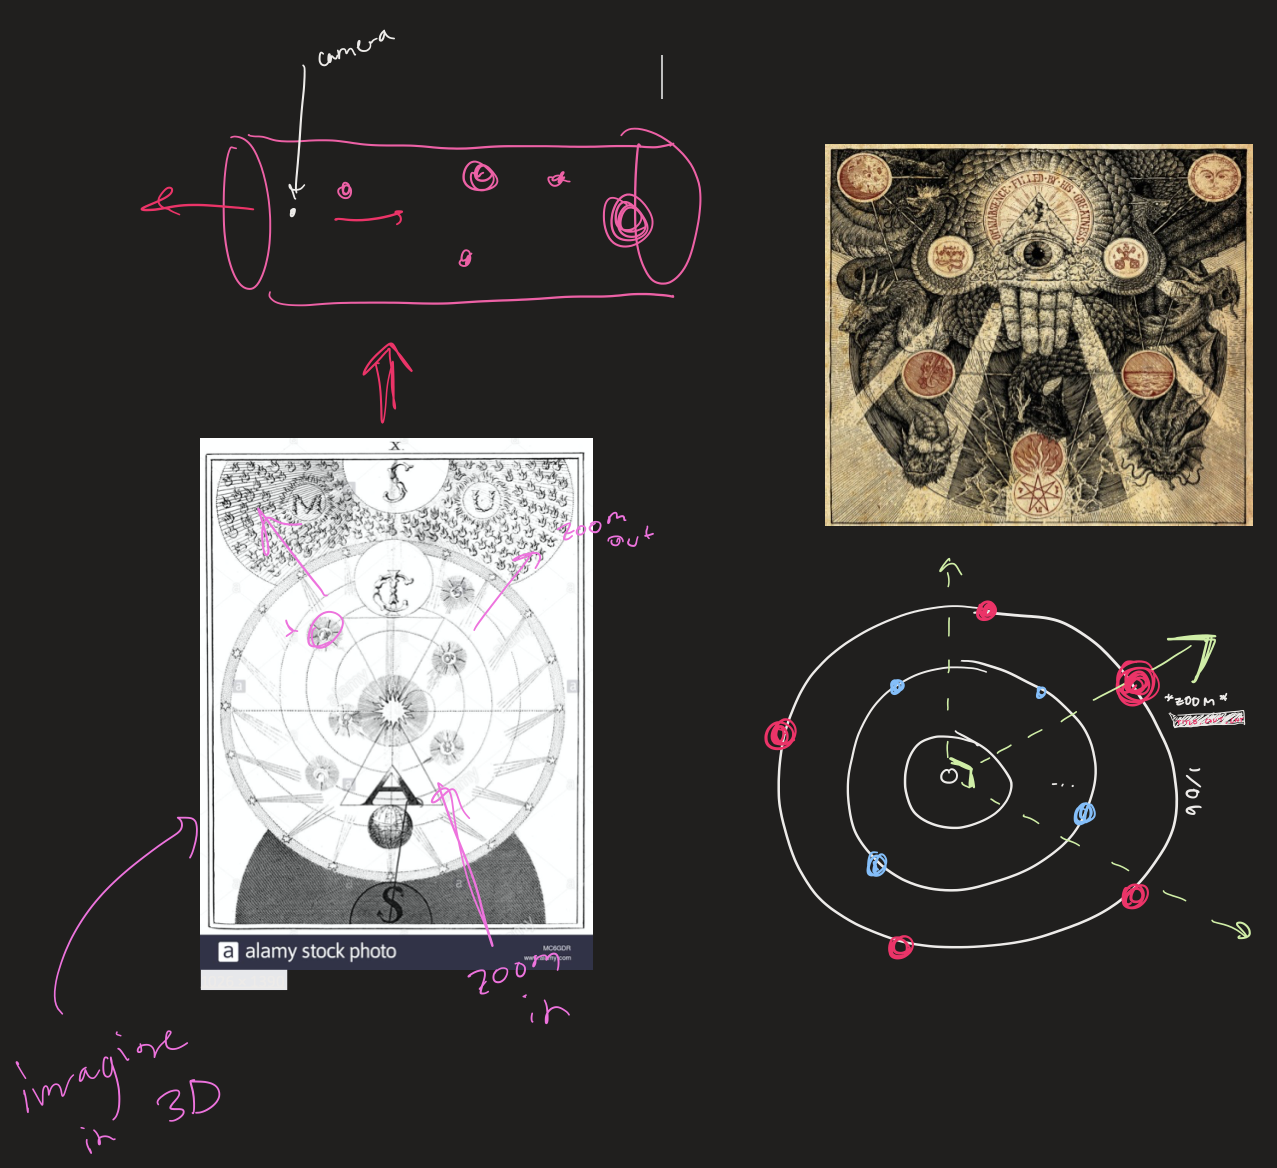
Preliminary sketches
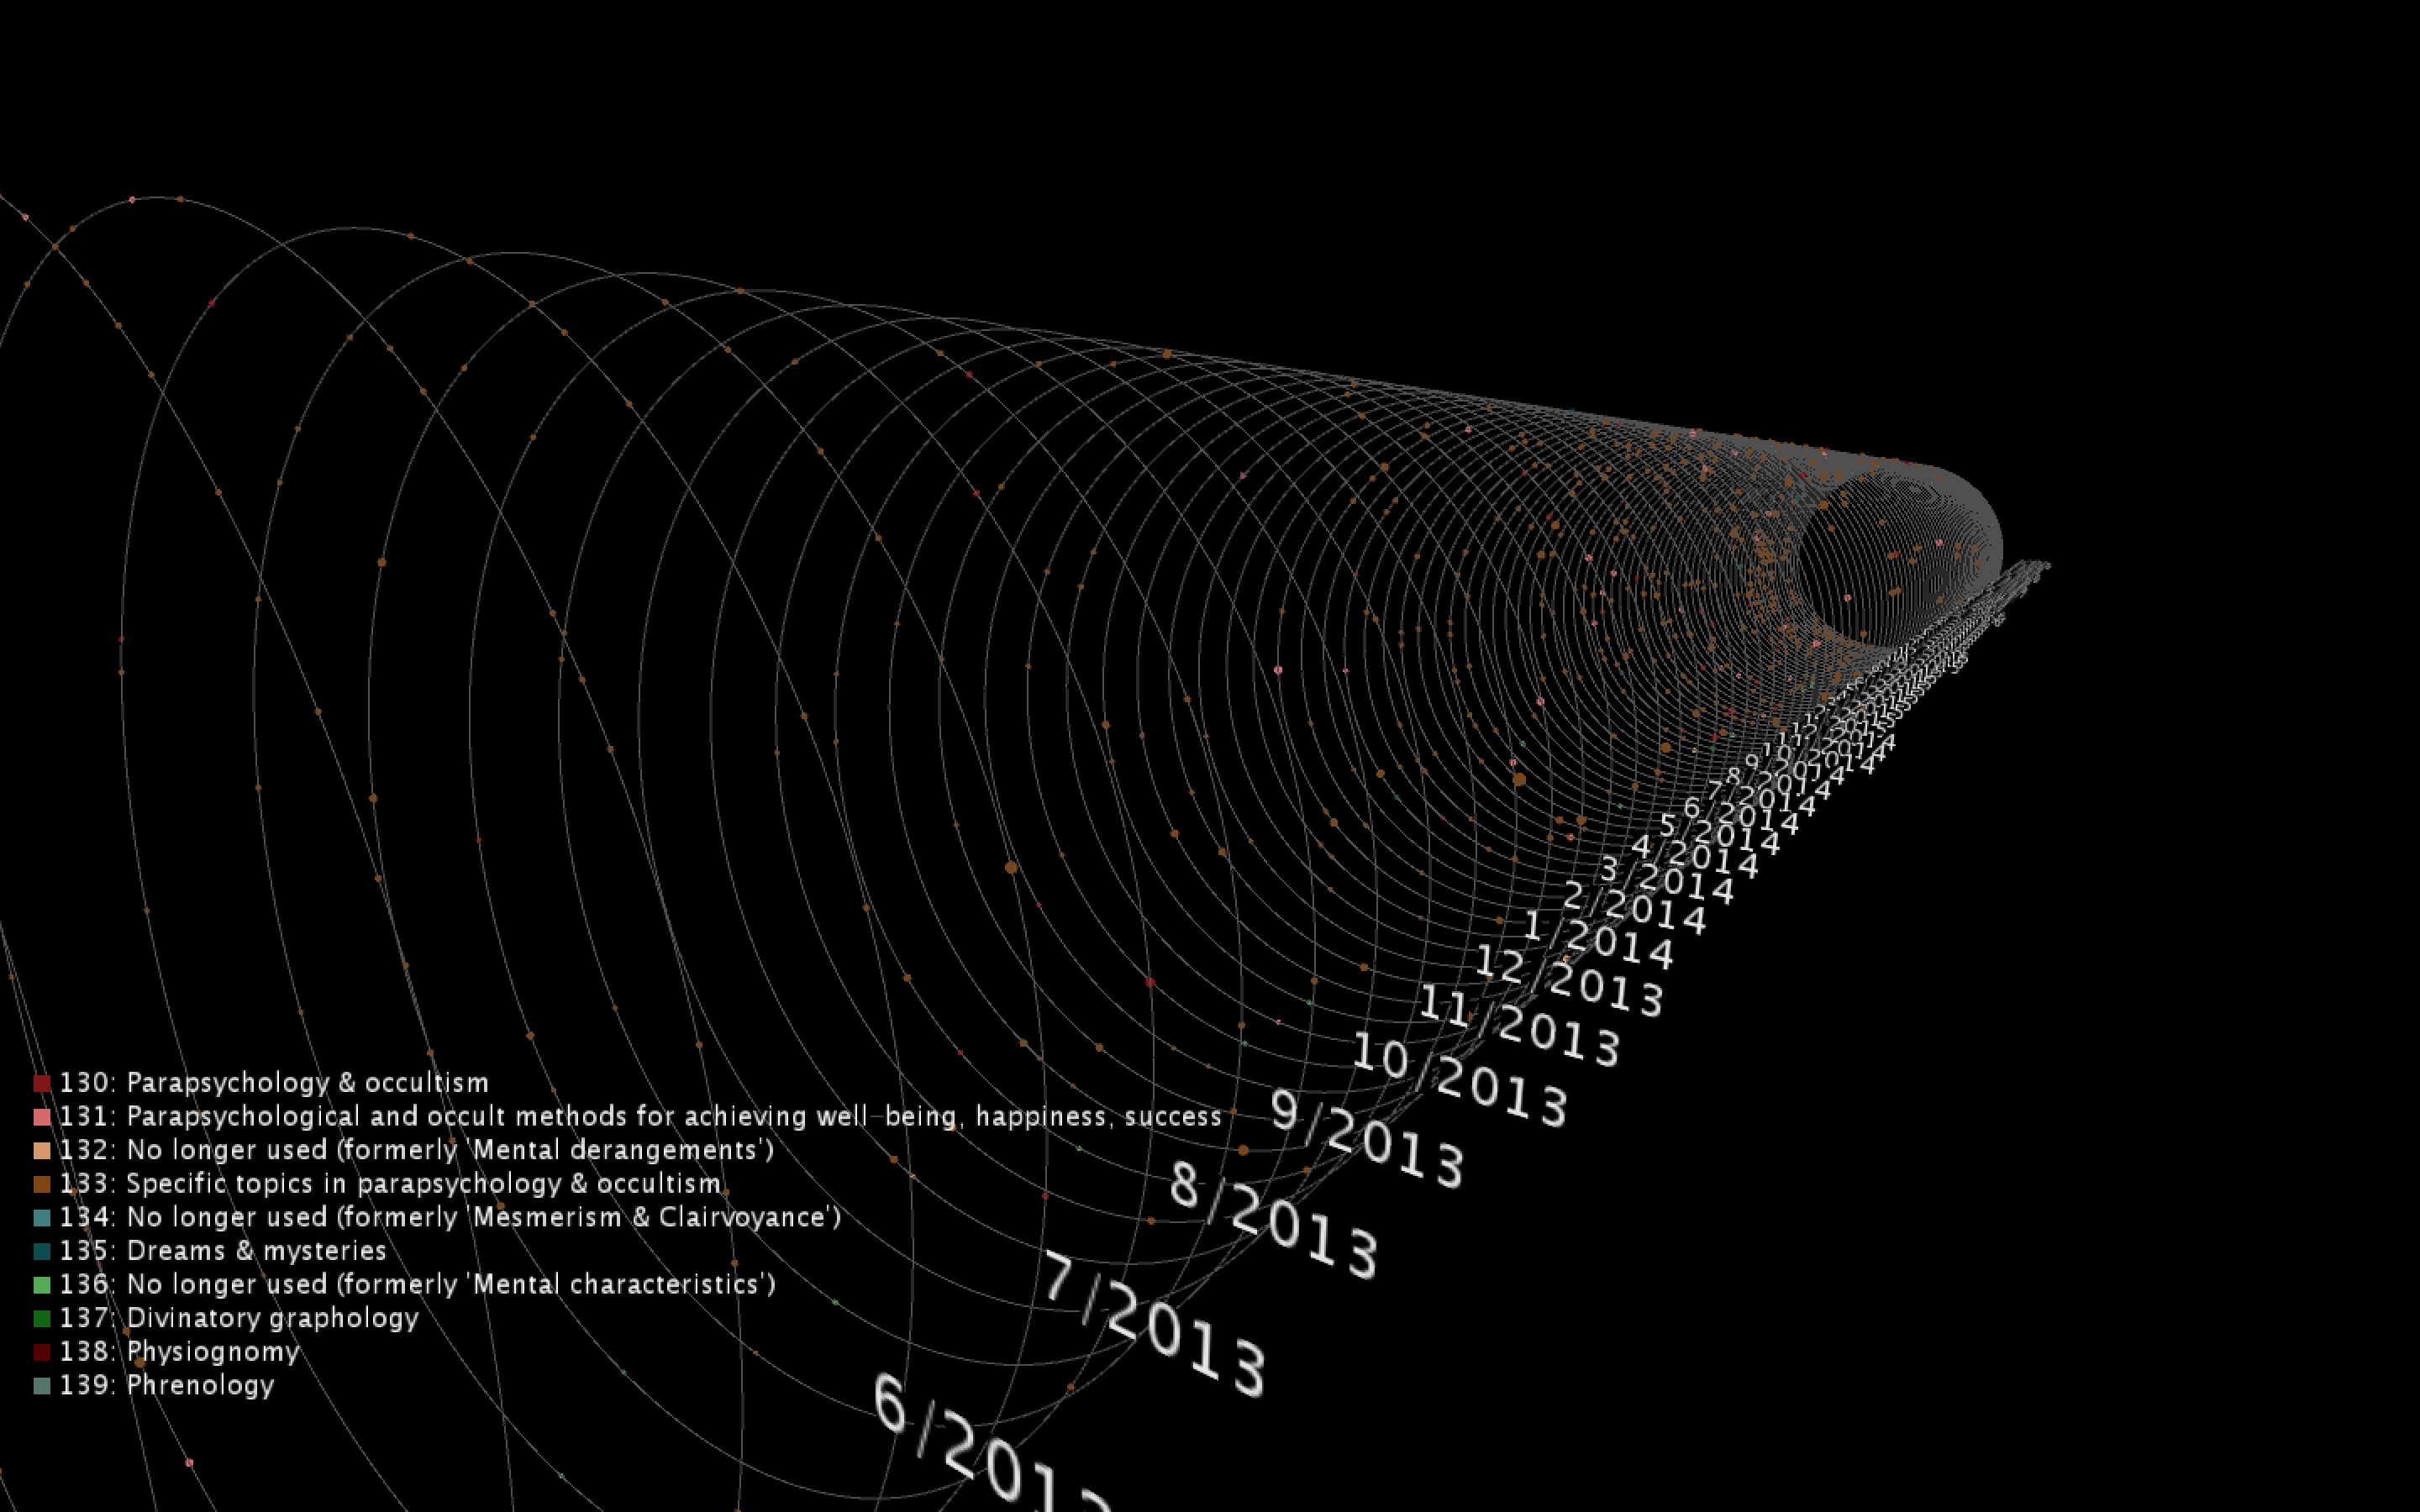
Visually, I found that many occult beliefs and traditions involved circle-shaped symbols and astrological imagery. An example of this type of symbol would be a pentacle. After some brainstorming, I was figuring out ways to take this shape and draw it into a 3D space. Since there is a lot of occult imagery related to stars and planets, I designed the data points to appear as orbiting planets, with each of the rings representing each month from February 2006 - present. I wanted the user to feel as if they are "travelling through time" as they zoom forwards and backwards inside the rings.
Additionally, as I was developing the intial design, I realized that my design was very similar to Flying Lotus's album cover art for Cosmogramma, which I was subconsciously thinking about when brainstorming ideas.
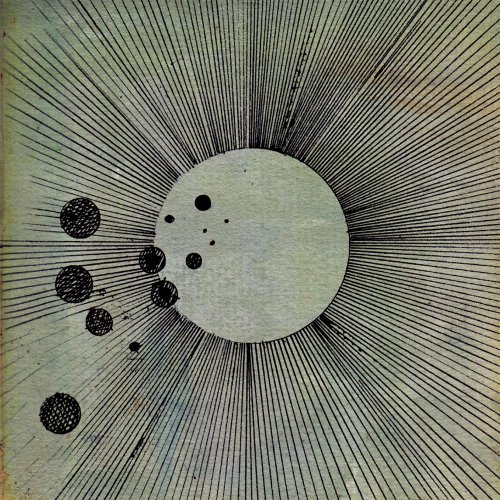
Additionally, as I was developing the intial design, I realized that my design was very similar to Flying Lotus's album cover art for Cosmogramma, which I was subconsciously thinking about when brainstorming ideas.
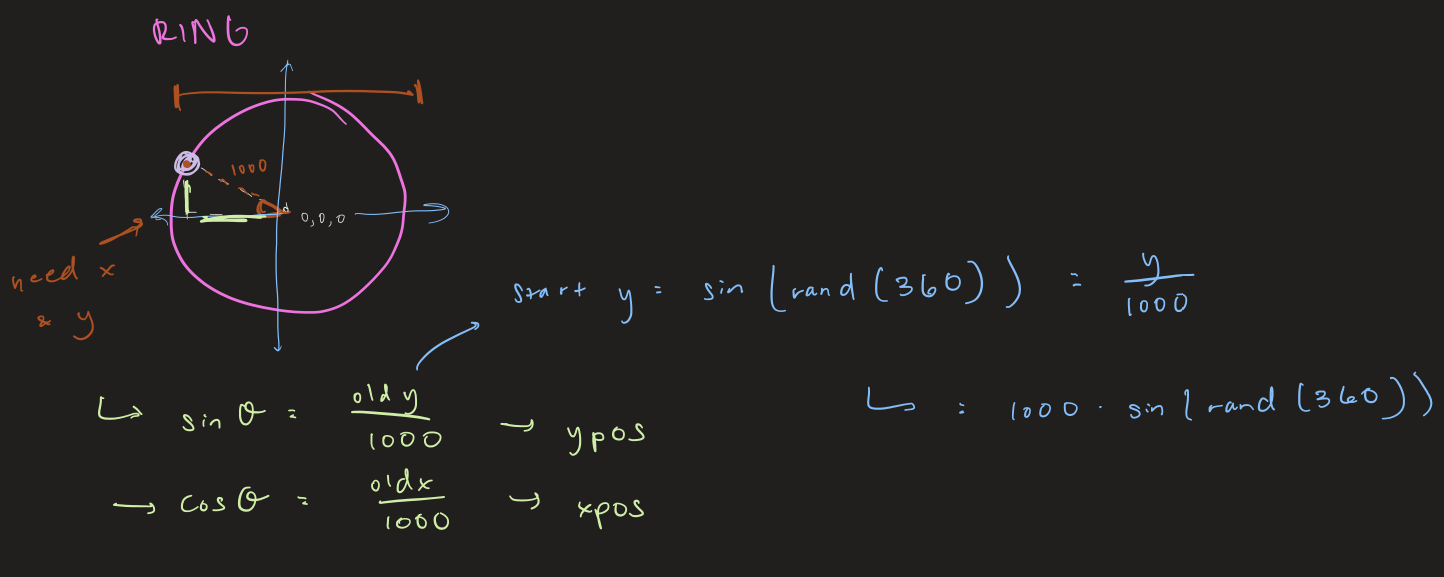
Process
One of the challenges in this project was programming the movement and position of each point's orbit. The speed of each point correlates with that title's checkout count for that specified month. The calculations below were used to determine the point's x and y position given the point's speed.
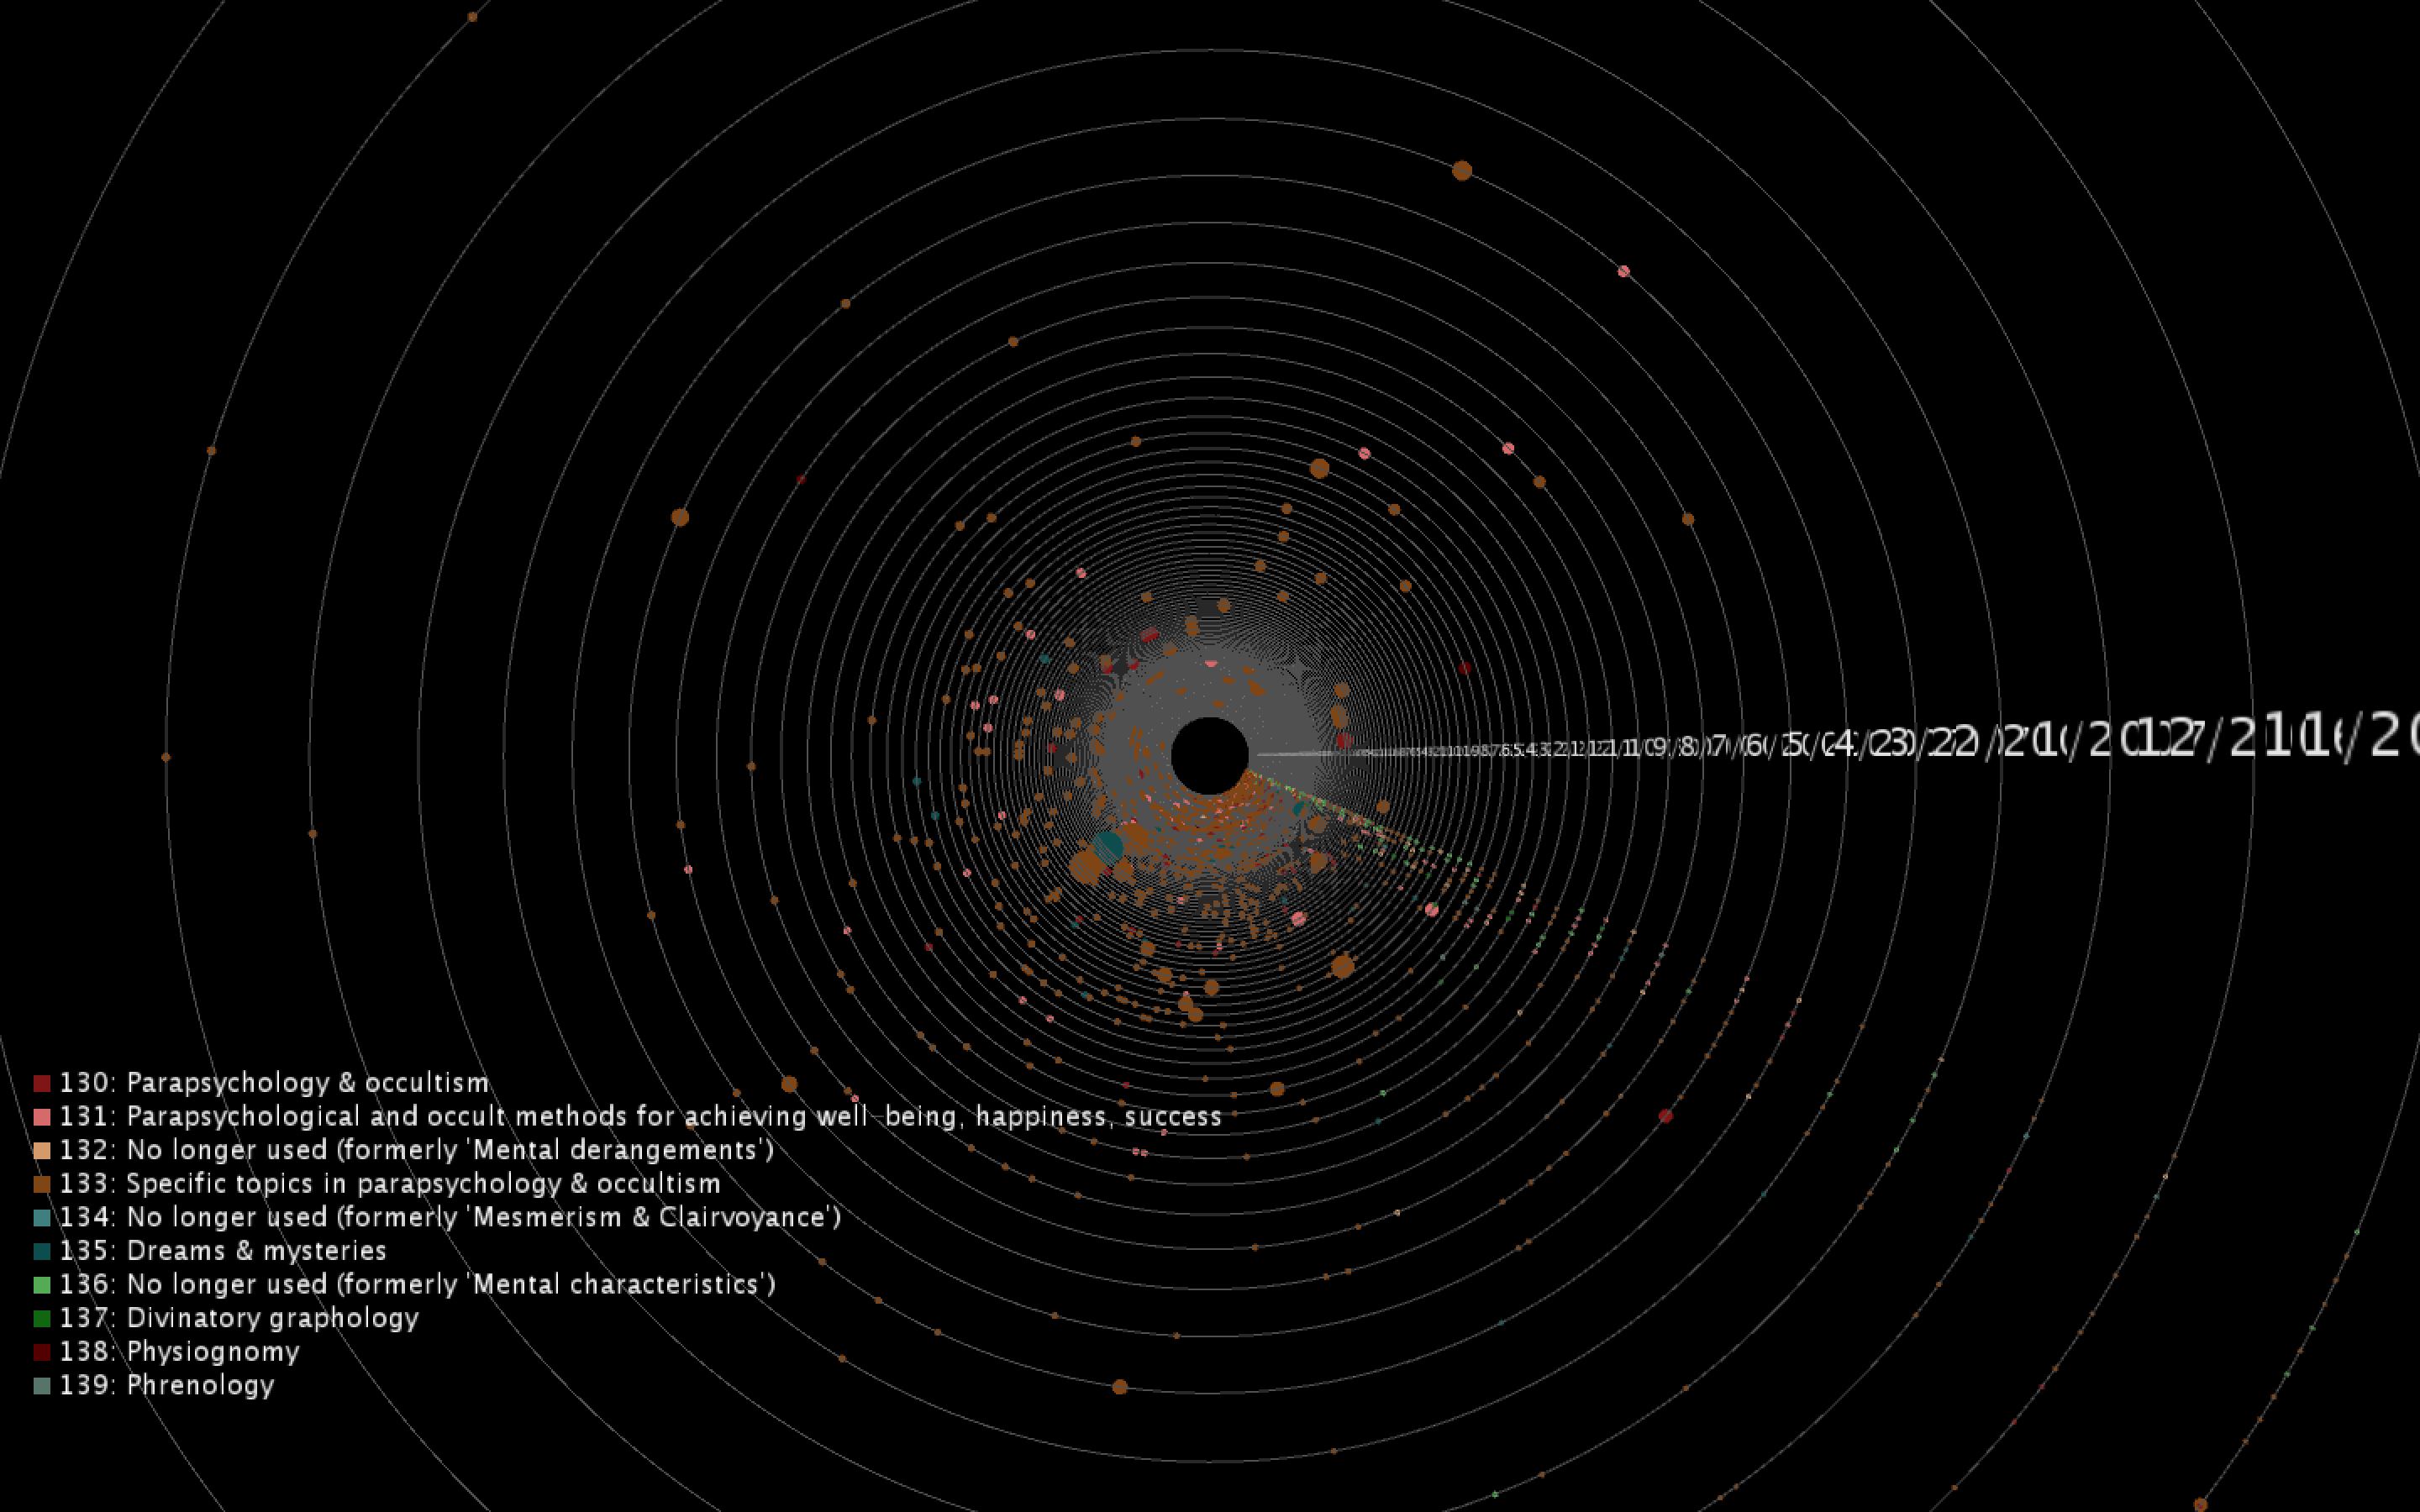
Final result
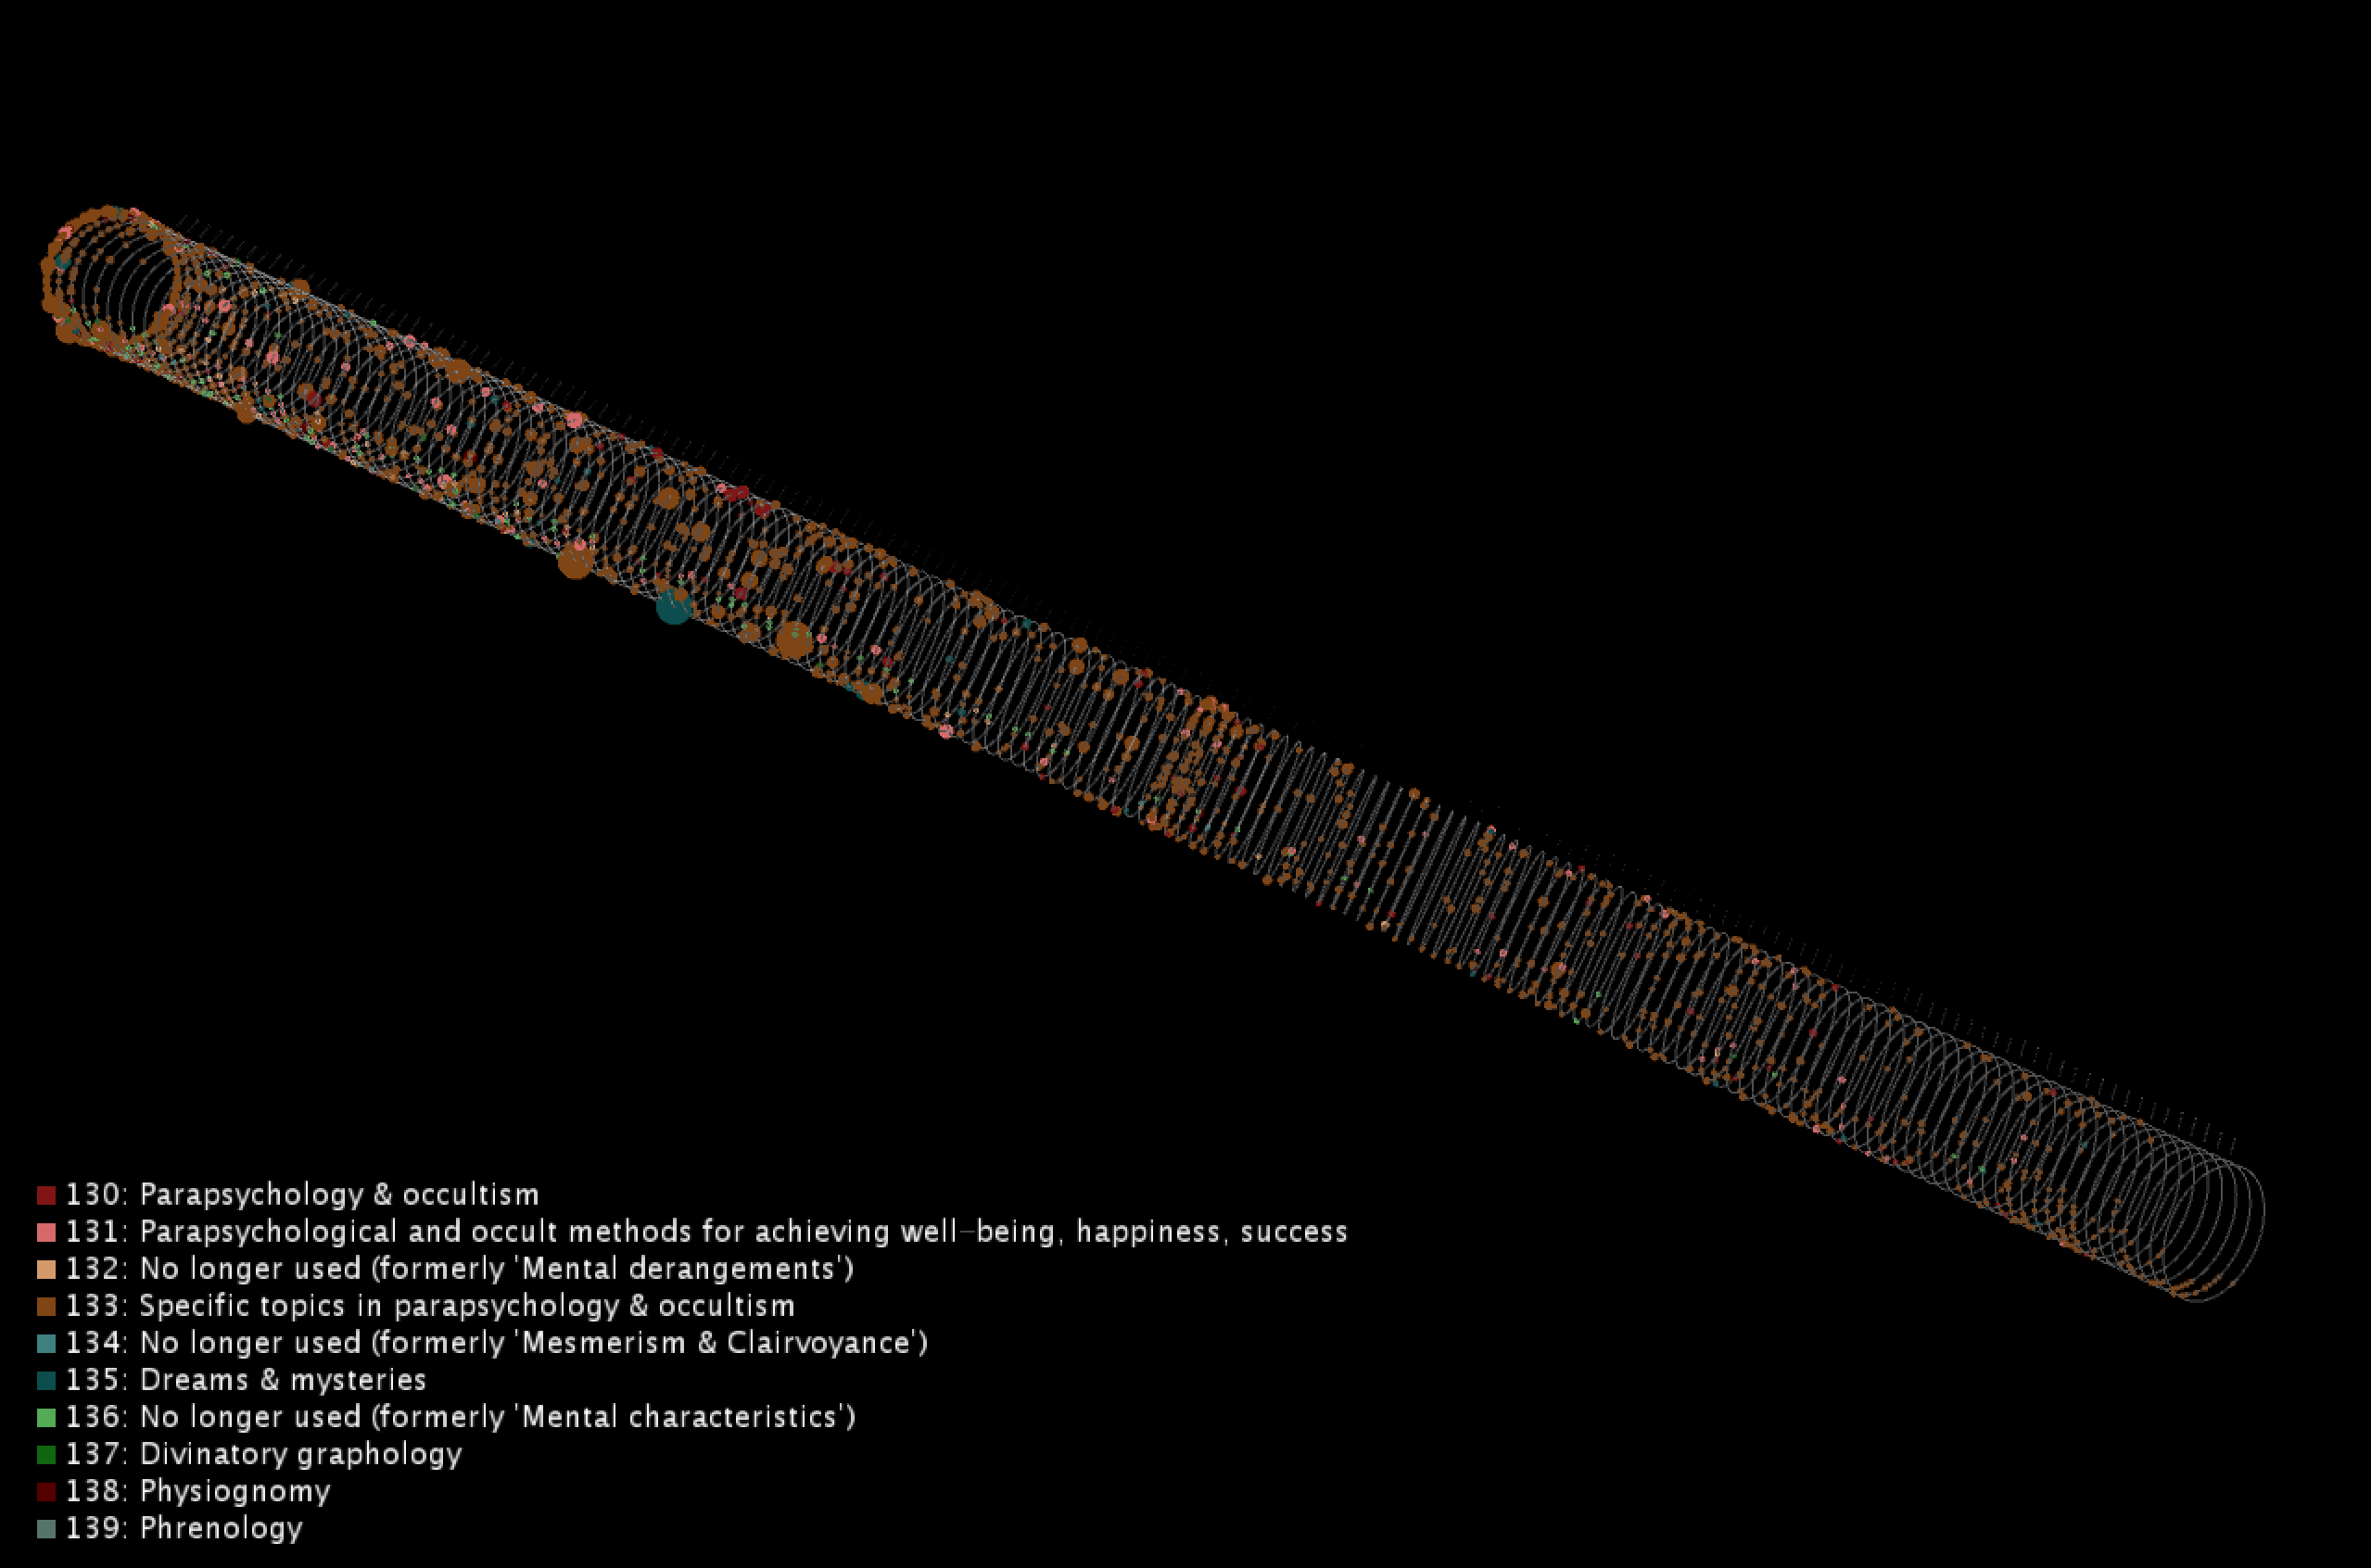
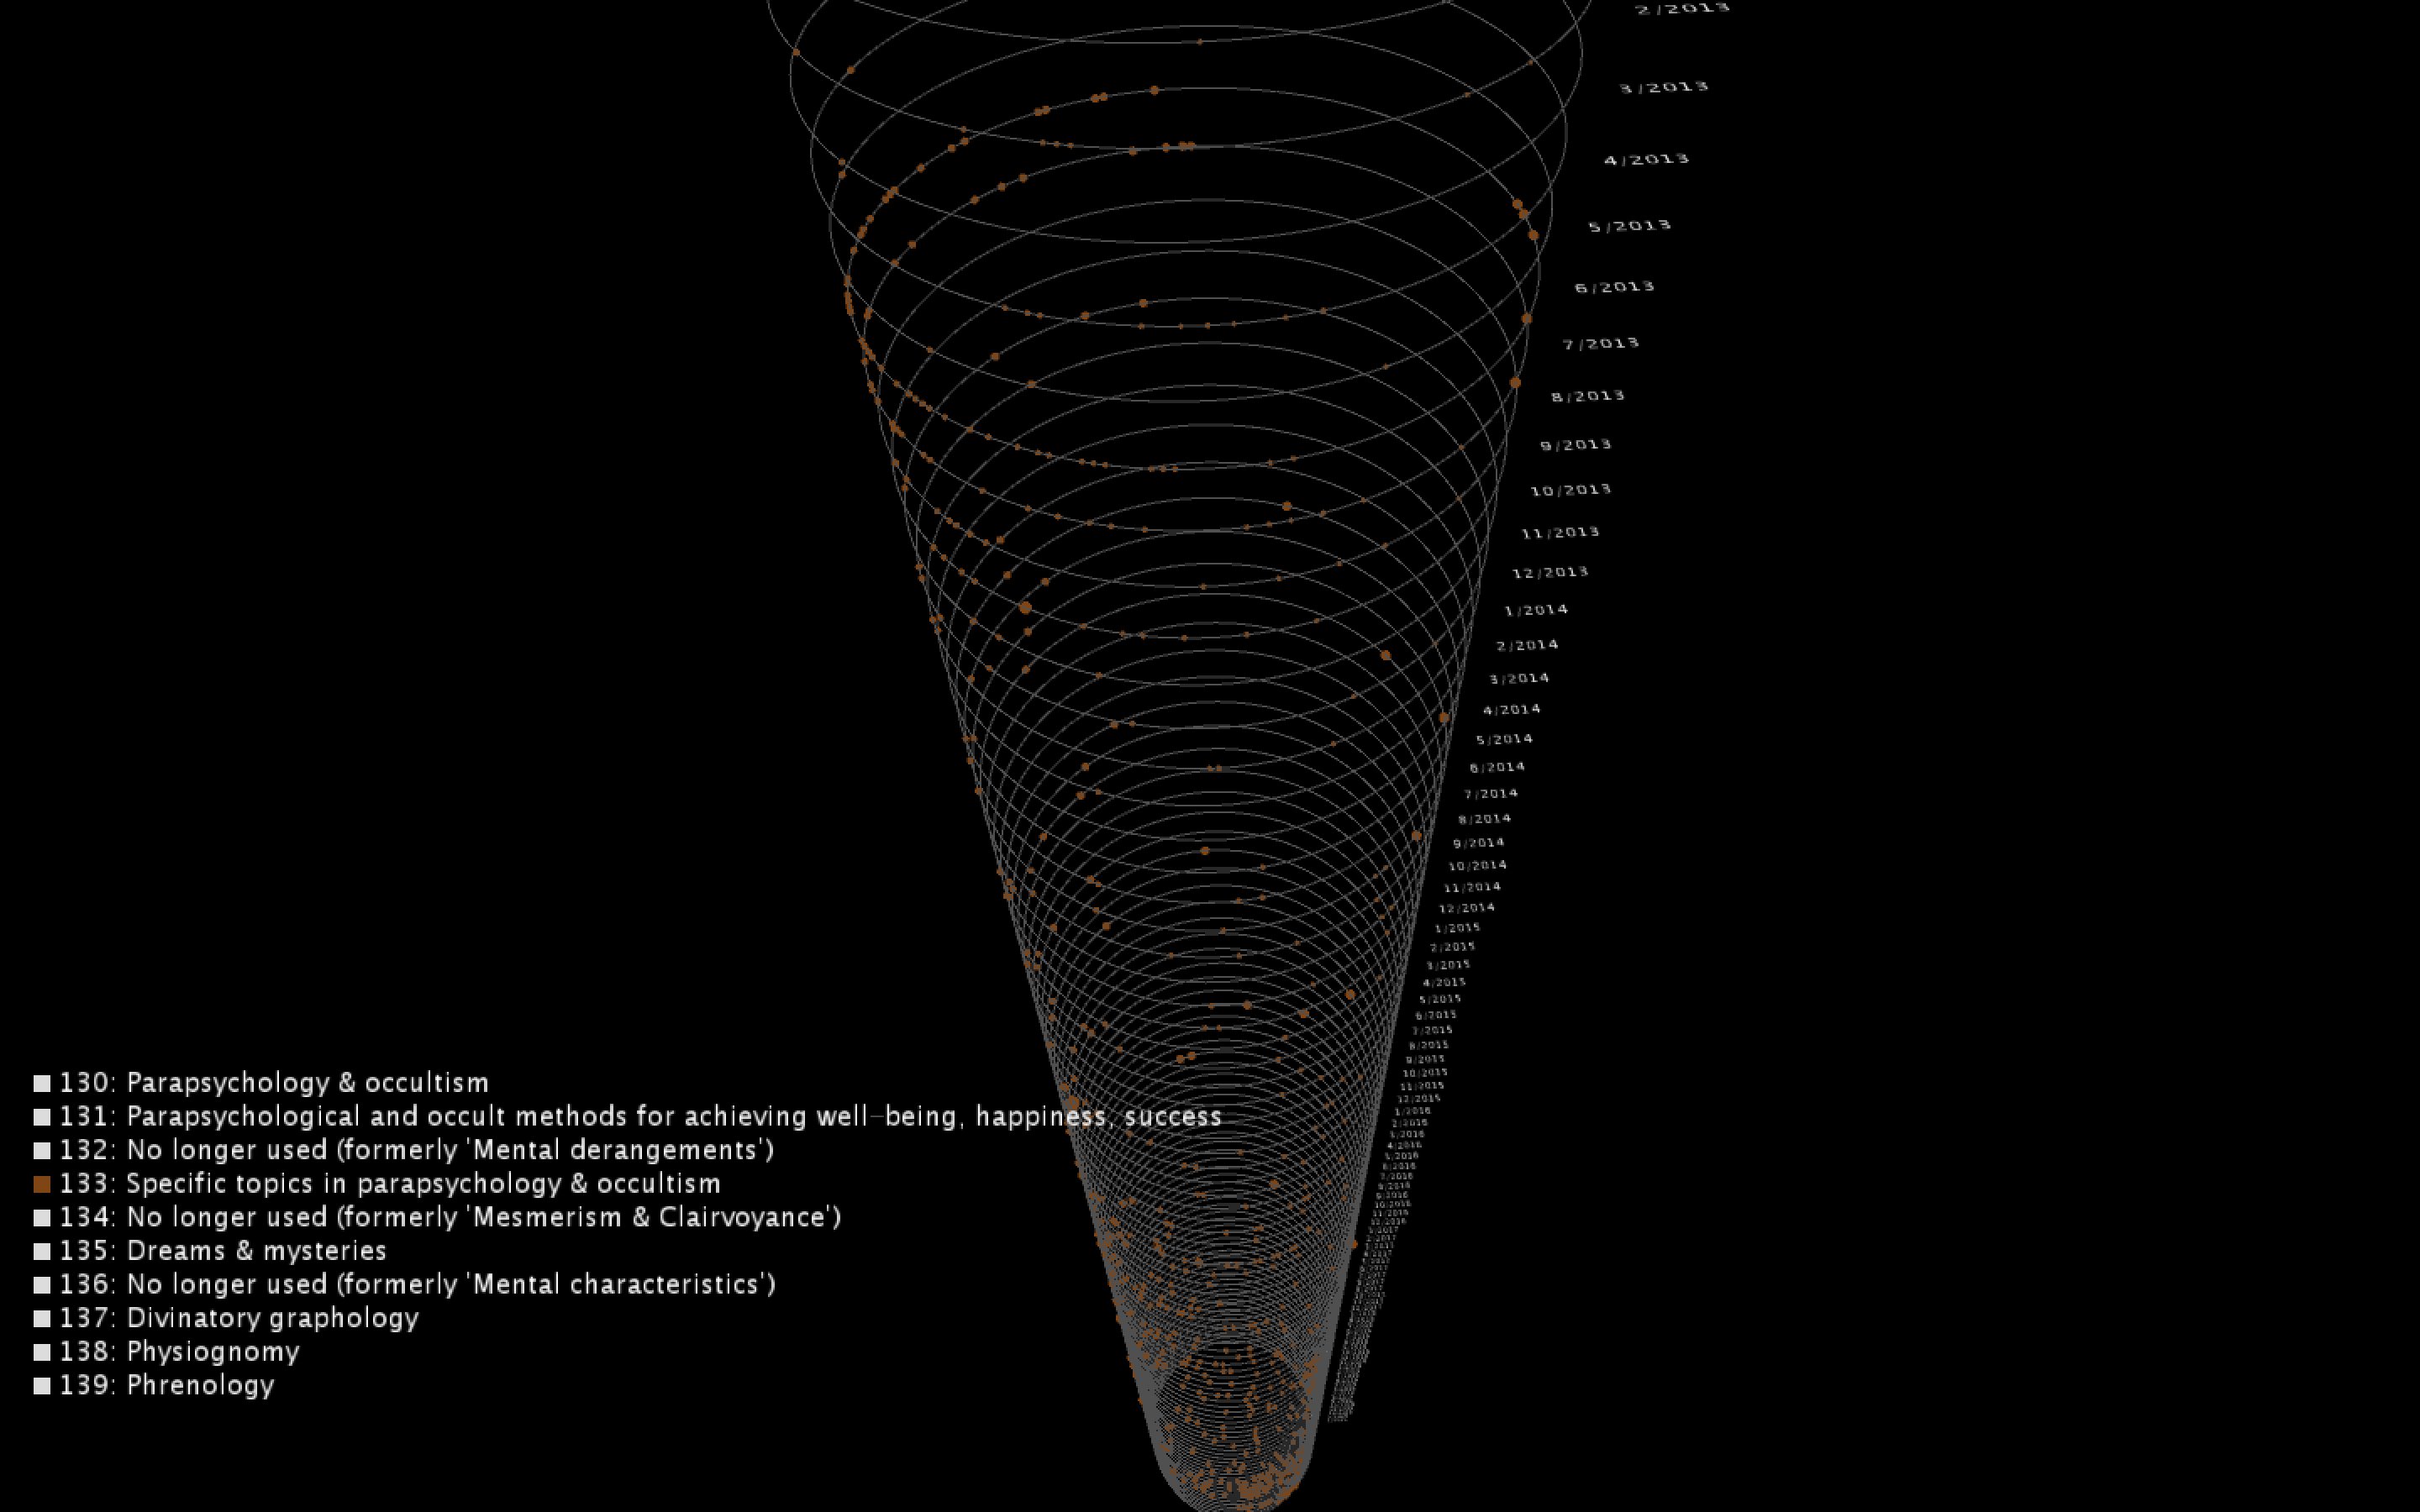
The project visualizes checkout data from Dewey classes 130-139, which are topics on parapsychology and the occult. Each moving point represents a single title and each ring represents a single month. The speed and size of the point correlates with the checkout count for that month, while the volume of points on a single ring represents the total volume of checkouts in these Dewey classes for that given month. The rings are organized in chronological order, as the user should be able to scroll through time to see trends in this topic over the course of the dataset’s lifetime. They can also pause the sketch to mouse over individual points and see the title's details.
To view details for a single title, you can pause the sketch by holding down the spacebar and mousing over the point to reveal the popup box with the title name and the checkout count. To turn off a category in the sketch, you can click on the colored box for that category. Click on the box again to make it appear back in the sketch.
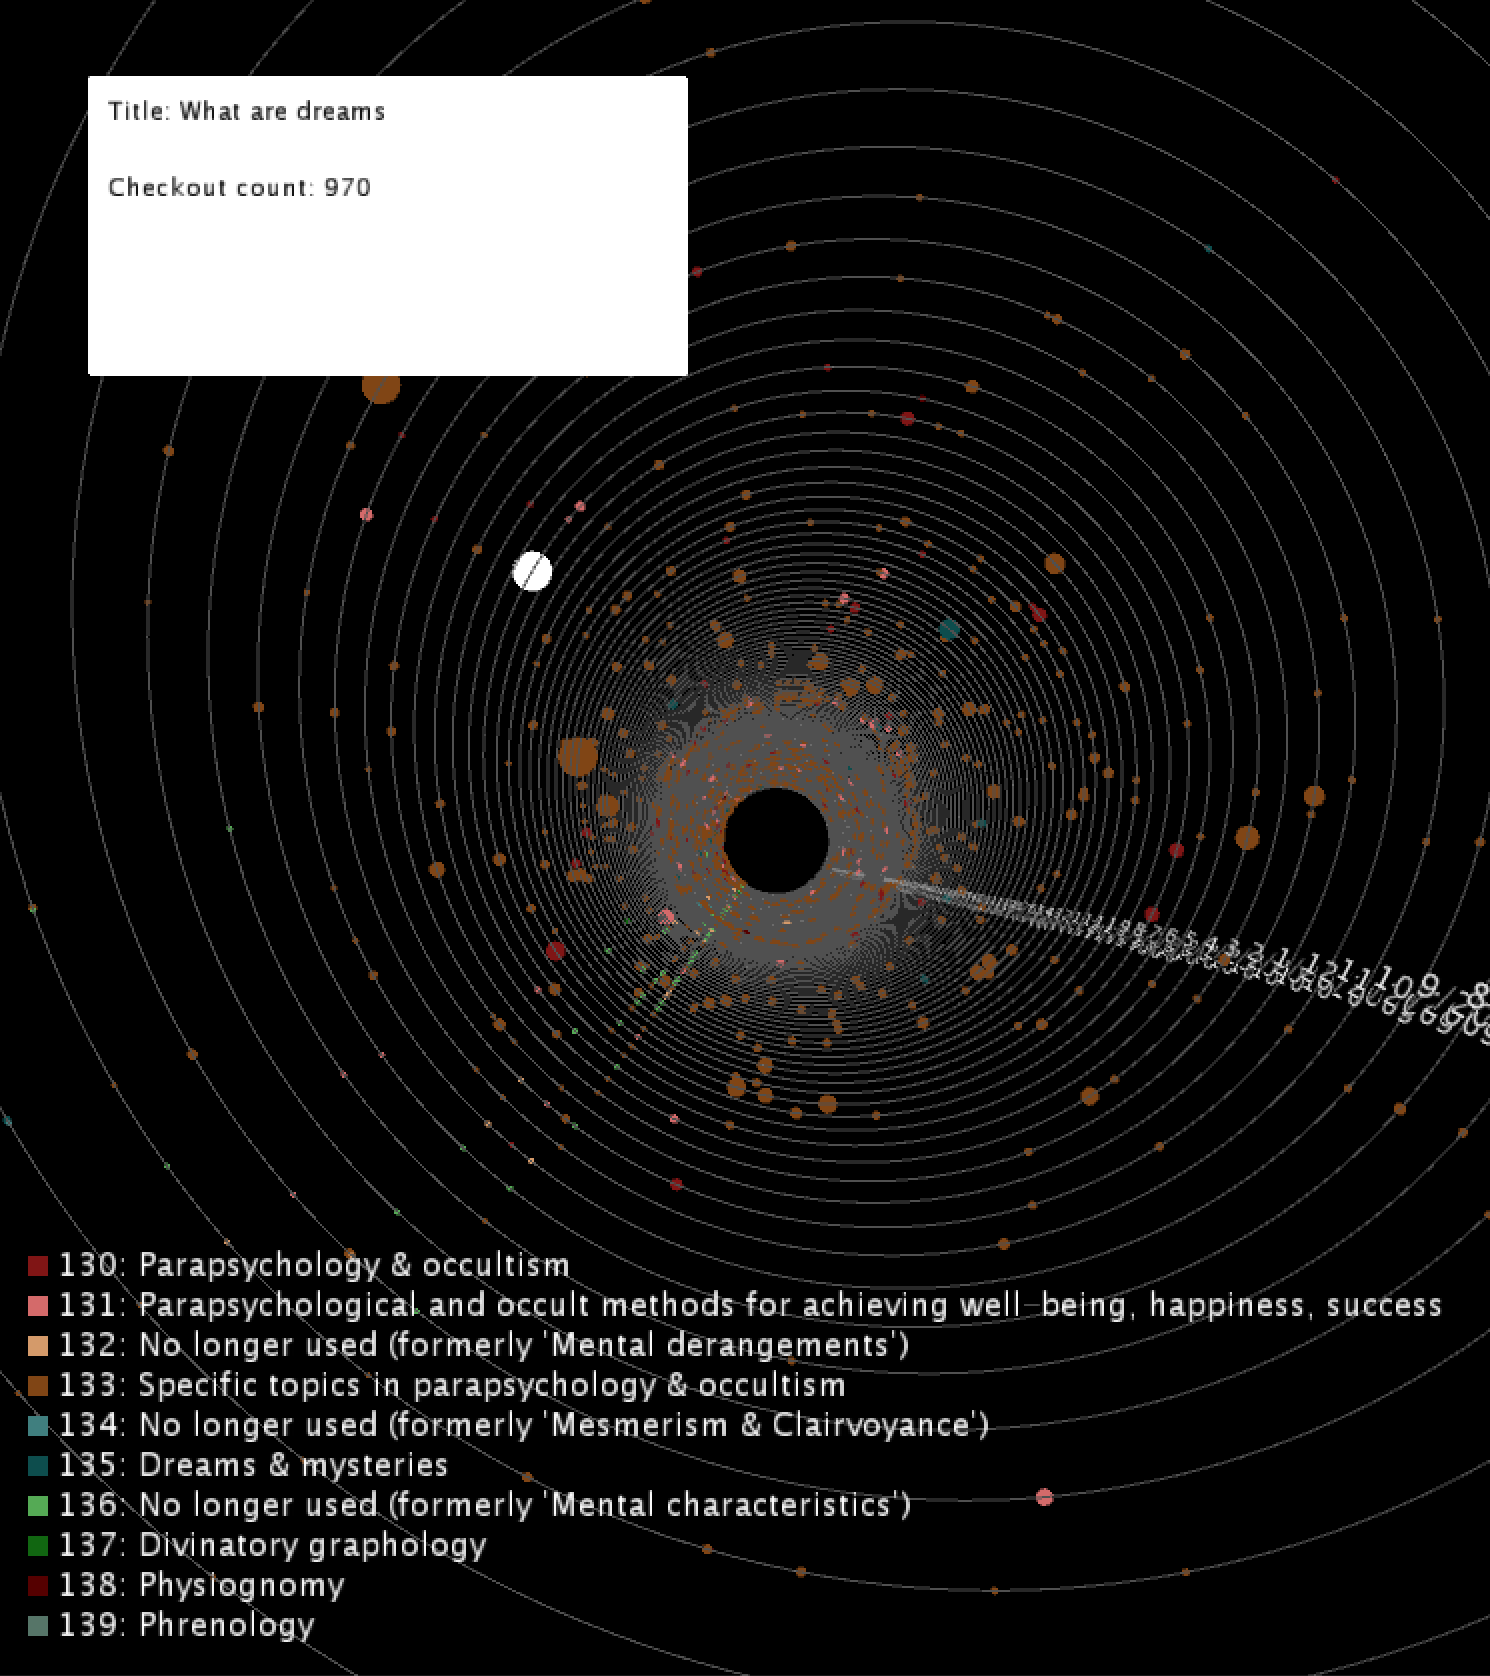
To view details for a single title, you can pause the sketch by holding down the spacebar and mousing over the point to reveal the popup box with the title name and the checkout count. To turn off a category in the sketch, you can click on the colored box for that category. Click on the box again to make it appear back in the sketch.
Code