Data Mining of Trending Jobs
MAT 259, 2020
Jingxuan Cao
Concept
I am interested in discovering the trending jobs in the last few years. My plan is to search online to get the list of popular jobs in the past few years and then I will collect the checkout data of these jobs to see the result. Additionally, considering the financial crisis happened in 2008, I will also try to find out whether the financial crisis influenced these jobs. When I search online, one website give me a long list of jobs and I summarize them to: law related(340-349), finance and economy related(330-339), computer related(000-009), engineering(620-629), medical scientist & dentist(610-619). I will collect data by Dewey Decimal Classification in the database.When I am collecting data, I find out that I am not able to collect data from computer category that it always shows server disconnection. I cannot search for a big range of deweyClass, so I have to separate the searching for Econ, Law, Medical, Engineering.
Query
SELECT
YEAR(cout) AS years,
sum(if(deweyClass >= 330 and deweyClass < 340 , 1, NULL)) AS 'Econ',
sum(if(deweyClass >= 340 and deweyClass < 350 , 1, NULL)) AS 'Law' from spl_2016.outraw
where (deweyClass >= 330 and deweyClass < 350) and YEAR(cout) BETWEEN 2006 and 2019
group by year(cout) order by year(cout)
SELECT
YEAR(cout) AS years,
sum(if(deweyClass >= 610 and deweyClass < 620 , 1, NULL)) AS 'Medical',
sum(if(deweyClass >= 620 and deweyClass < 630 , 1, NULL)) AS 'Engineering' from spl_2016.outraw
where (deweyClass >= 610 and deweyClass < 630) and YEAR(cout) BETWEEN 2006 and 2019
group by year(cout) order by year(cout)
Preliminary sketches
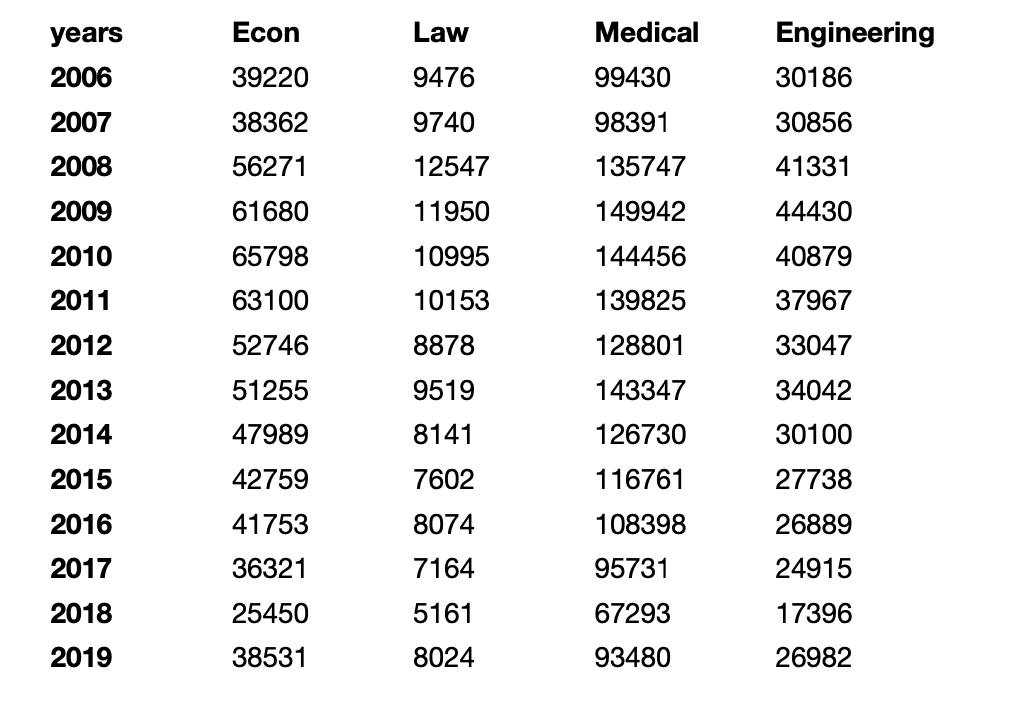
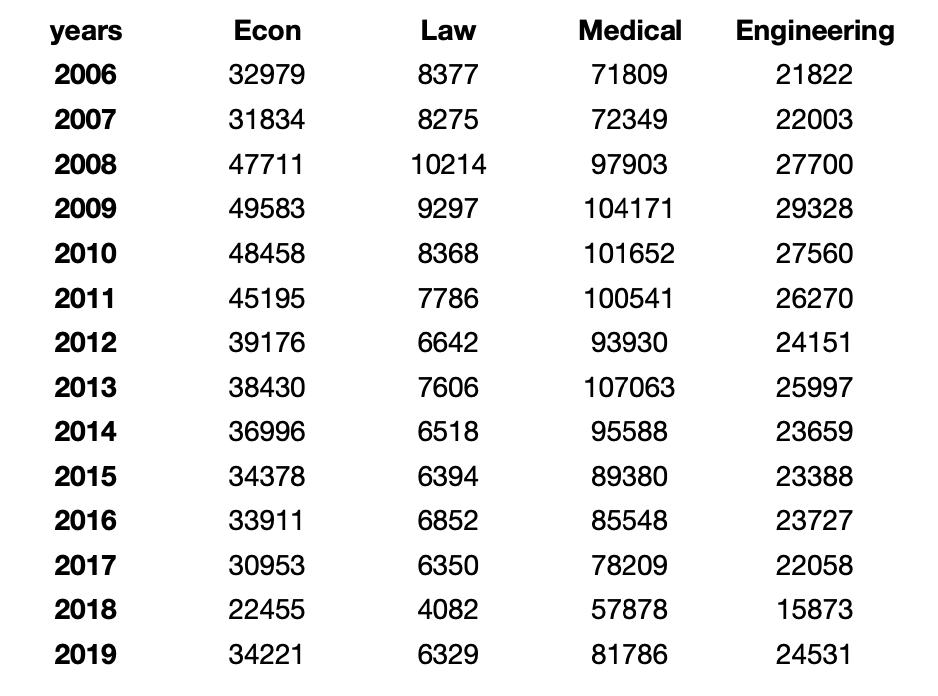
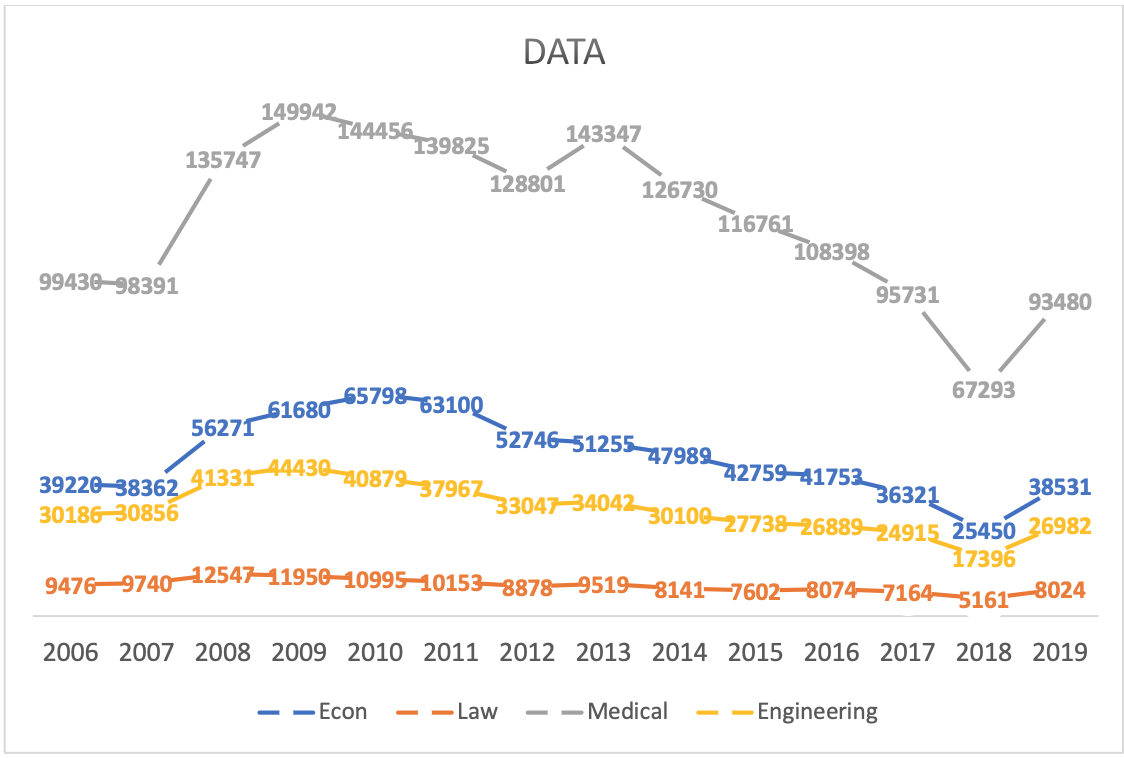
The first graph shows the data that is collected by using DeweyClass. For the second graph, I am wondering if there are some elements influence the data of each area, because I suspect that there are a lot of other media products in medical for instance DVD. Therefore, I decide to limit the counting of each area to book.
Process
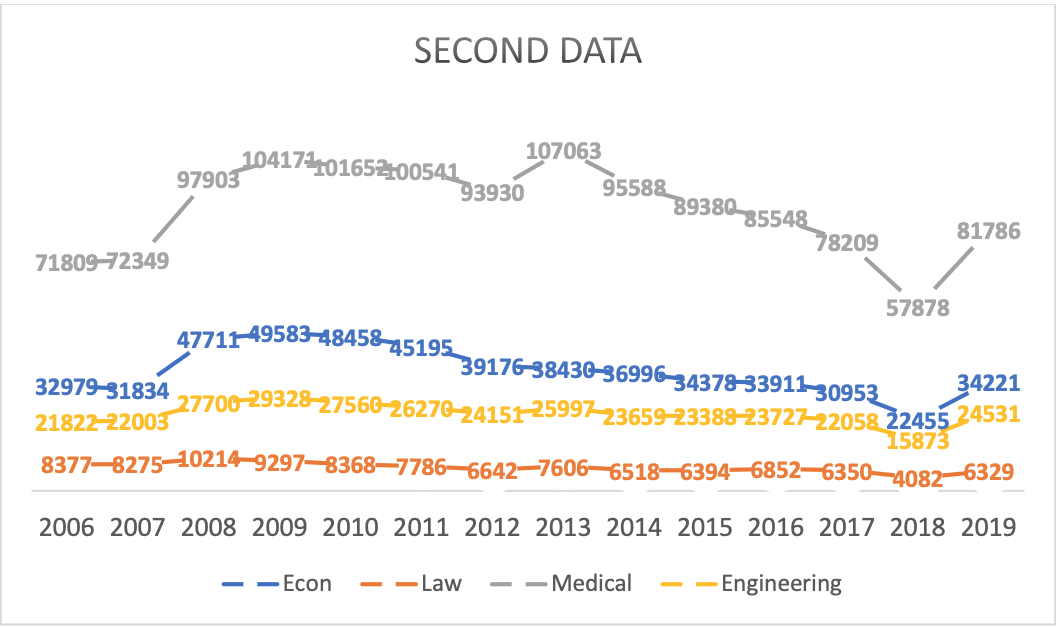
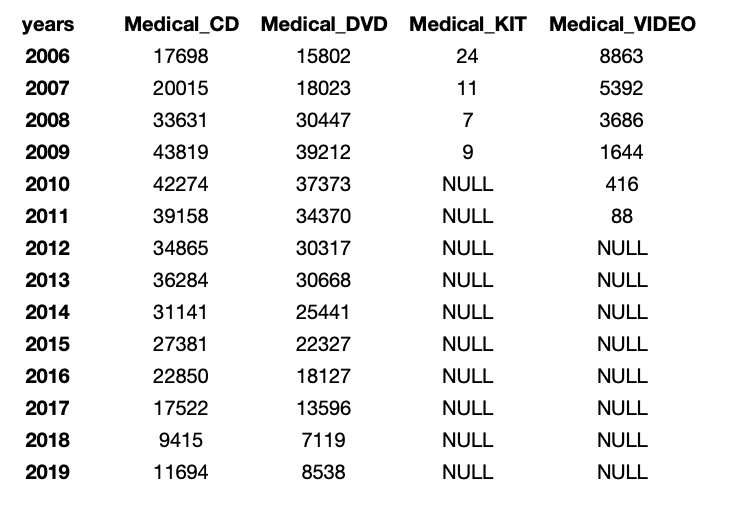
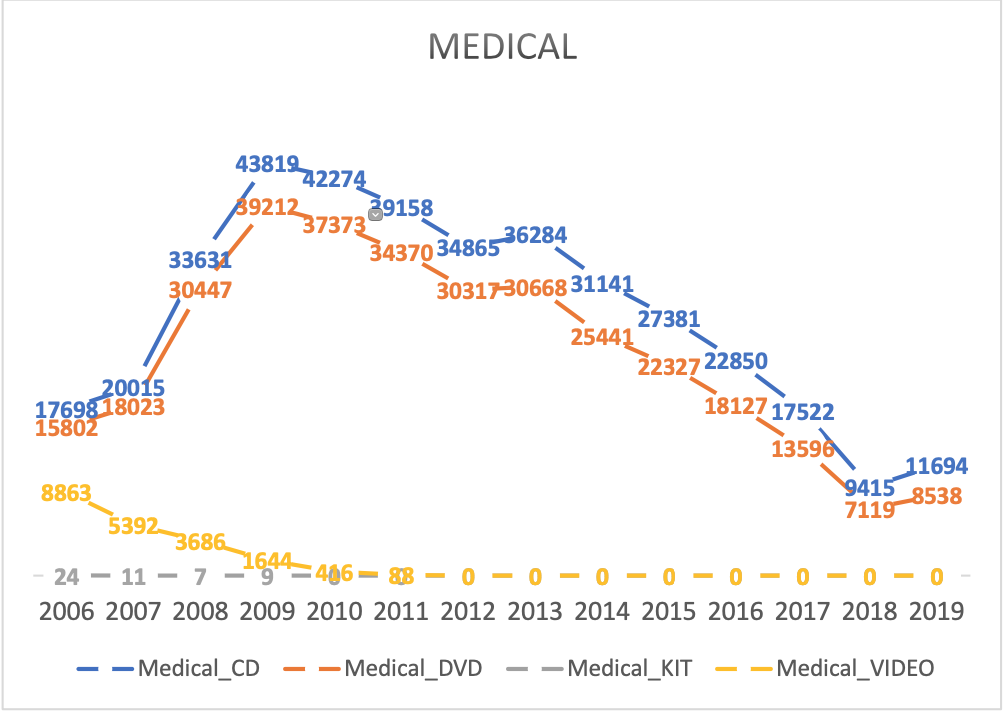
I have observed that the number of medical area decreases the most from these two charts after I limit the type to book. Therefore, I will try to find the number of other media products of medical area.
Final result
Apparently, the data of each area are decreased by eliminating other media products except books, however, the medical area is decreased the most and also the data I collected at the end prove my suspicion that medical area contains plenty of media products like DVD and CD.
The medical related books have the largest checkout number comparing with the other three categories. But considering that many people care about their health, a large number of these books may not aim for jobs. On the other side, looking at the data of engineering, economy, and law, we can tell that economy books are more popular than engineering and law. Especially from 2007 to 2008, there is a slope in the graph due to the 2007 to 2008 financial crisis that more people start to pay attention to economy and financial.
Overall, the data in library can indicate various information about local people’s life. Unfortunately, because of internet, the number of people who come to library is decreasing sharply.
Code