Behance's Creative Spread: A Visualization of the 12 Most Appreciated/Viewed Fields + Projects
MAT 259, 2019
Yoko R. Ebata
Concept
As a creative with a background of several interests and pursuits in various forms of crafts (including the digital arts), I wanted to explore the niche makeup of creative users populating the Behance interface. Behance is a visual portfolio platform under Adobe Creative Cloud for artists to publish, document, and evolve their online portfolio. Utilizing the Behance API, I visualized the most popular / viewed projects within the 12 most popular creative fields. The pursuit of this project was to see any visual relationship between all the creative fields and see how certain creative fields have evolved or decayed over time.
Query
There are four javascript files attached to run the data grabbing process (attached inside the data file of my source). Because Behance's API lacks the ability to grab more than 48 pieces of data each time, I utilized their "page" attribute in the url by creating a request loop in the index file by creating a variable within the page number to gather multiple pages of data in a smaller amount of time.
behanceRequest.js calls the JSON, then calls on behanceMapper.js to map into my format, and places what the mapper gives back into my csv file. Because this code runs very fast, I had it sleep for 5000ms after each request.
Conveniently, one of my Behance JSON search results for the currently listed creative fields segmented off a section where they listed the most popular creative fields. This helped to narrow down where the denser parts of data, although I wanted to see the entire pool of data (it was already too slow to run the visualization with the 12 categories alone).
const {csvAppend} = require('csv-append')
const fs = require('fs')
const { behanceRequest } = require('./request/behanceRequest')
const { behanceMapper } = require('./mapper/behanceMapper')
const client_ids = ['DVMJWC25Er3vmesJOX8ML2HCe6d7fyiH', 'dH5q3lmJcsFcIKtluXiPDgDaDOxVwYkN']
const mode = 'yoko'
const RELATIVE_PATH_TO_CSV = `./data/output.csv`;
const start_page = 120
const sleep = async(ms) => { return new Promise(resolve => setTimeout(resolve, ms)); };
const main = async() => { let client_id = mode === 'yoko' ? client_ids[0] : client_ids[1] console.log('\nREQUESTING projects...') let i = 0 for(i; (i + start_page)< 126; i++){ let pg = start_page+i const { append, end } = csvAppend(RELATIVE_PATH_TO_CSV, true); console.log('STARTING PAGE', pg) let projects try { projects = await behanceRequest(pg, client_id) } catch (error) { console.log(error) throw error } projects = projects.projects projects = behanceMapper(projects) console.log('GOT', projects.length, 'projects on page #'+pg) append(projects) await end(); await sleep(5000) } }
main()
const axios = require('axios');
const { data } = require('./data')
const behanceRequest = async(page, client_id) => {
const url = 'https://api.behance.net/v2/projects'
let qs = `?sort=appreciations&country=US&page=${page}&client_id=${client_id}`
const behance_endpoint = url + qs;
let response
try { response = await axios.get(behance_endpoint)
} catch (error) {
throw error }
return response.data }
module.exports = { behanceRequest }
const behanceMapper = (projects) => {
return projects.map(project =>{ return { name: project.name, published_on: project.published_on, location: project.owners[0].location, country: project.owners[0].country, project_field_1: project.fields[0], project_field_2: project.fields[1], project_field_3: project.fields[2], user_field_1: project.owners[0].fields[0], user_field_2: project.owners[0].fields[1], user_field_3: project.owners[0].fields[2], appreciations: project.stats.appreciations, views: project.stats.views, } }) }
module.exports = {
behanceMapper
}
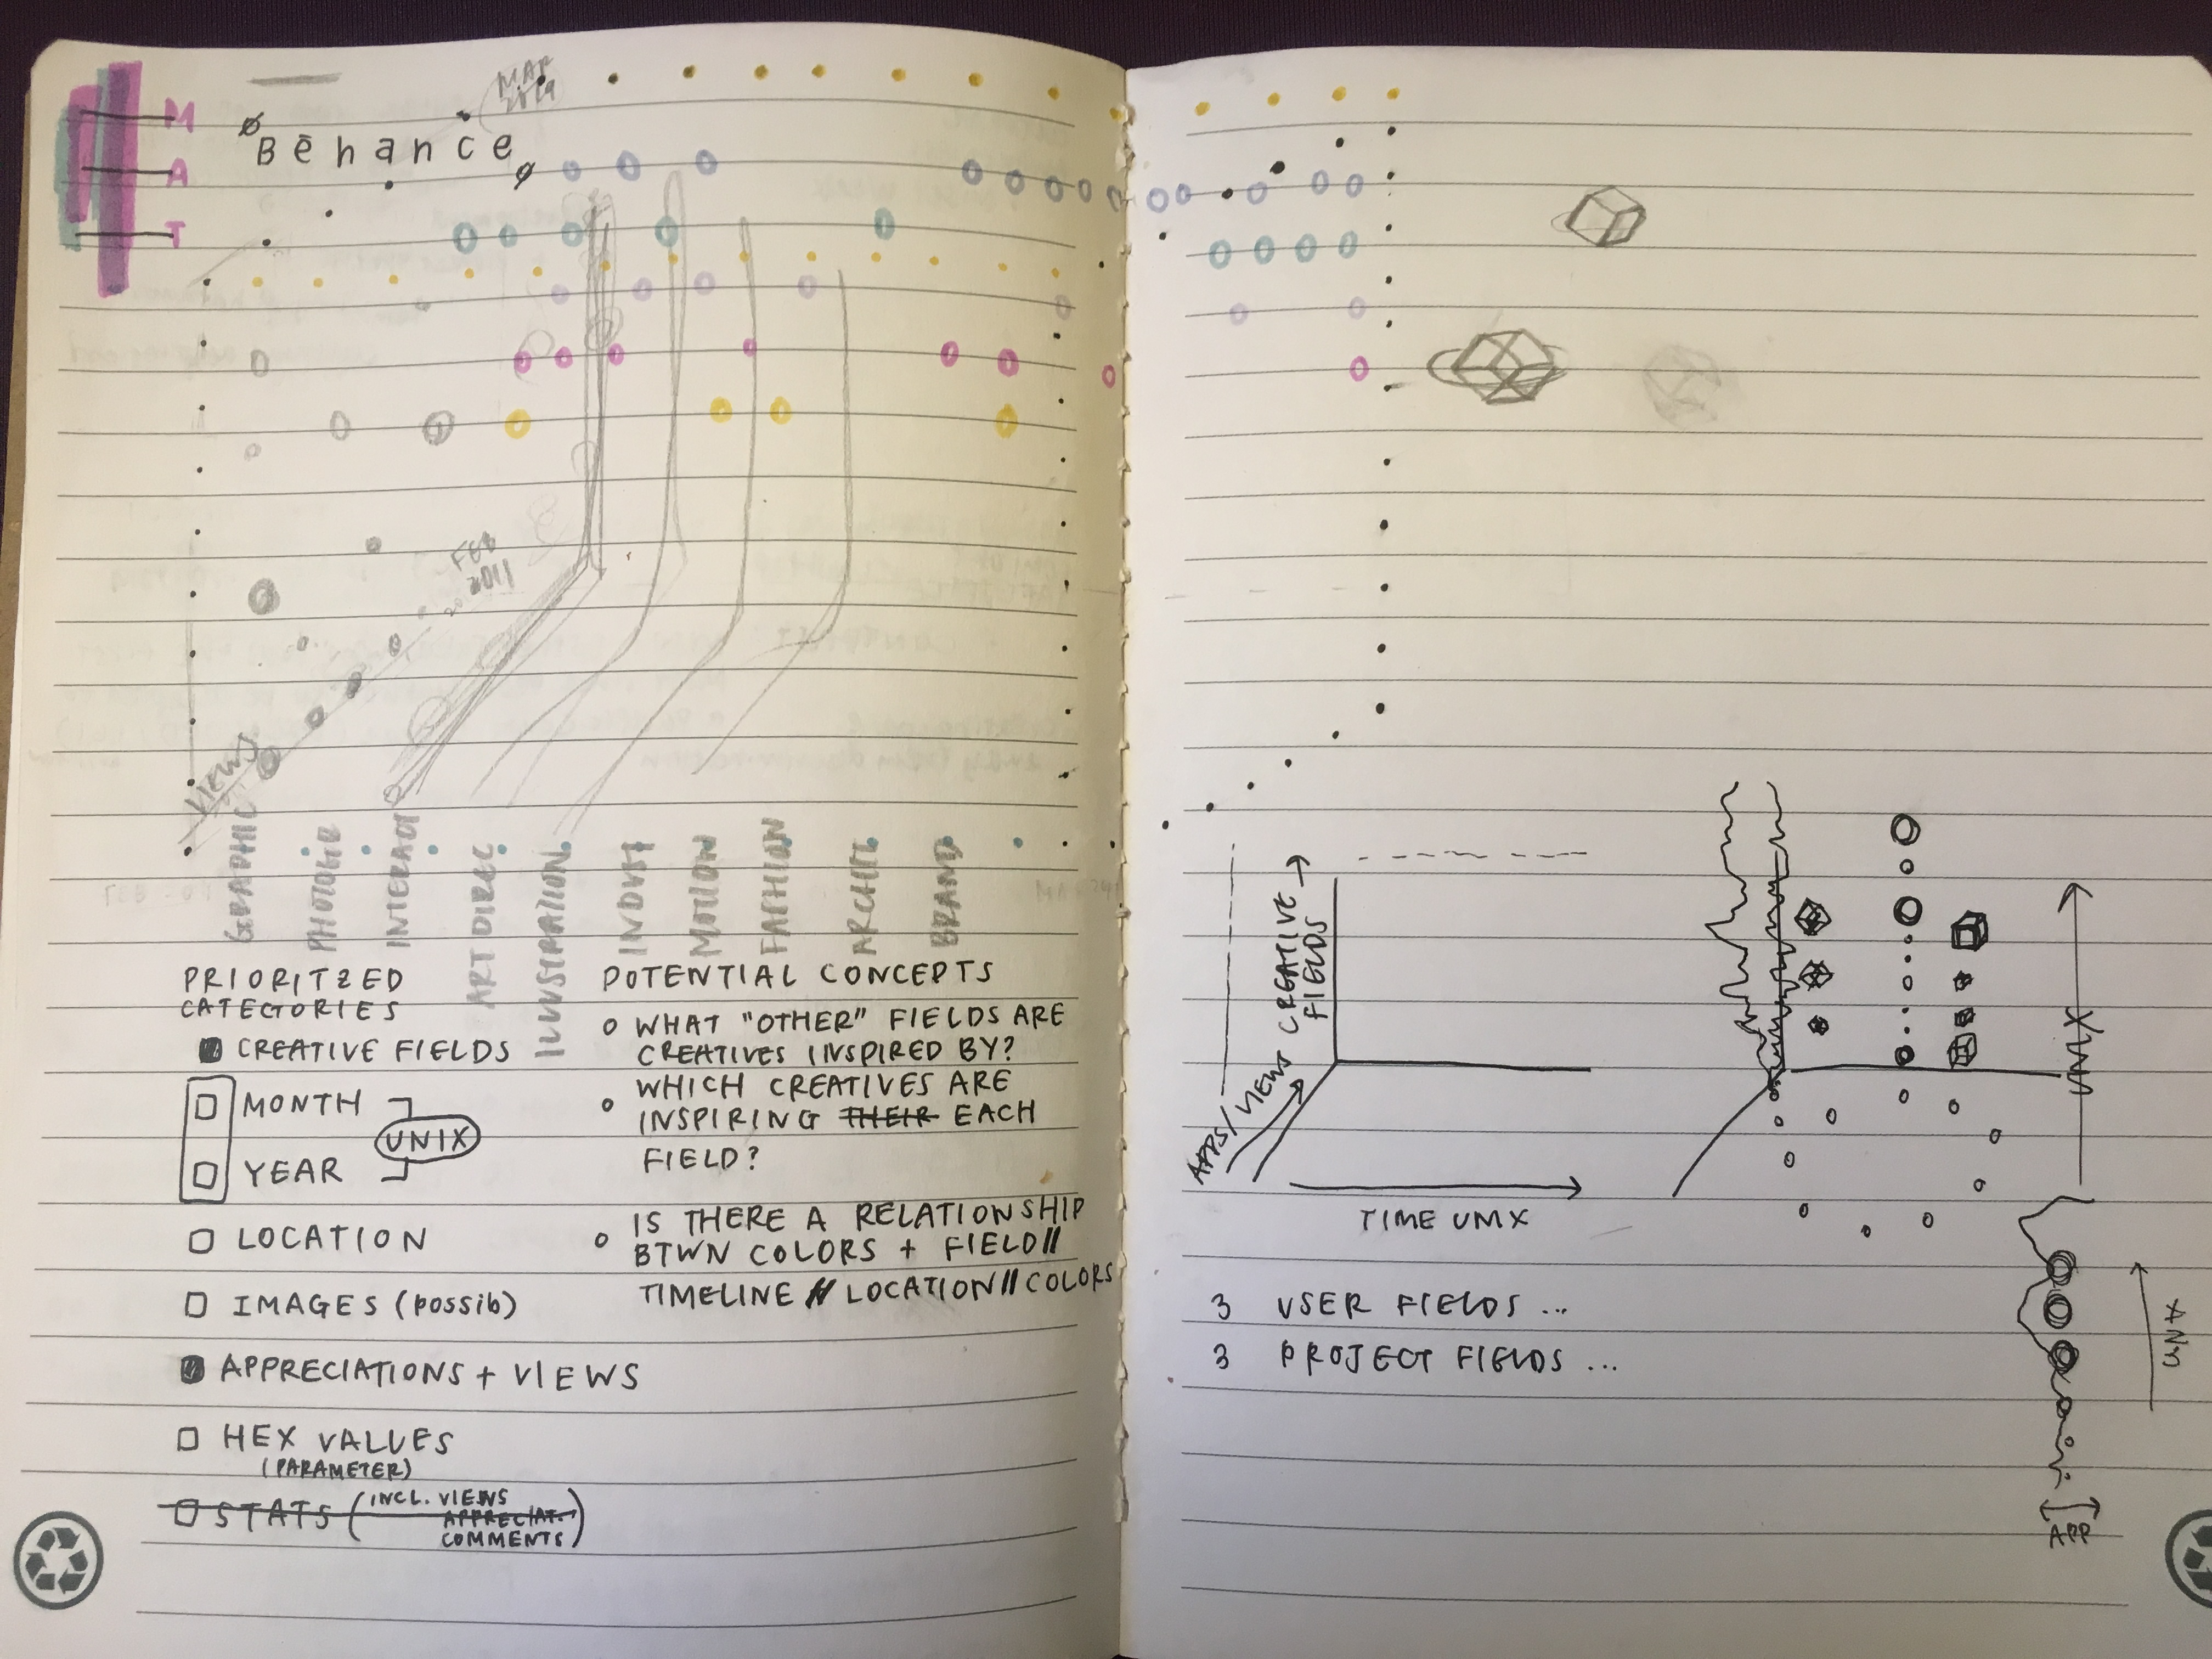
Preliminary sketches
My initial sketches ended up not really reflecting my results (I find that it ended up looking better). This was just part of the initial drawing board.
Process
I started off with the challenge assigning multiple datapoints for each user to a field label (as each project/user classified themselves with three creative fields); splitting one piece of data into three was a logical syntax confusion. This initial progress illustrated across beyond the canvas, but illustrated quite interesting patterns. Prior to the development of the project I asked myself a few questions to narrow down how I wanted the data to behave.

Final result
After some polishing up, I finally got to achieve the results I sought for with successful assignments of categorizations of creative fields. I wish that I had more processing power to visualize the entire assortment of fields (there were 70+ of them) since it visually looks like there was not enough data. It was surprisingly still quite slow even after slimming it down to the 12 most popular creative fields.
The X axis represents time in both DATE/MONTH + UNIX format, the Y axis corresponds to the Creative Fields, and the Z respresents the view count of a project. The sizing of the data reflected the percentage of appreciation values over view counts to exemplify how well-liked the particular project was.
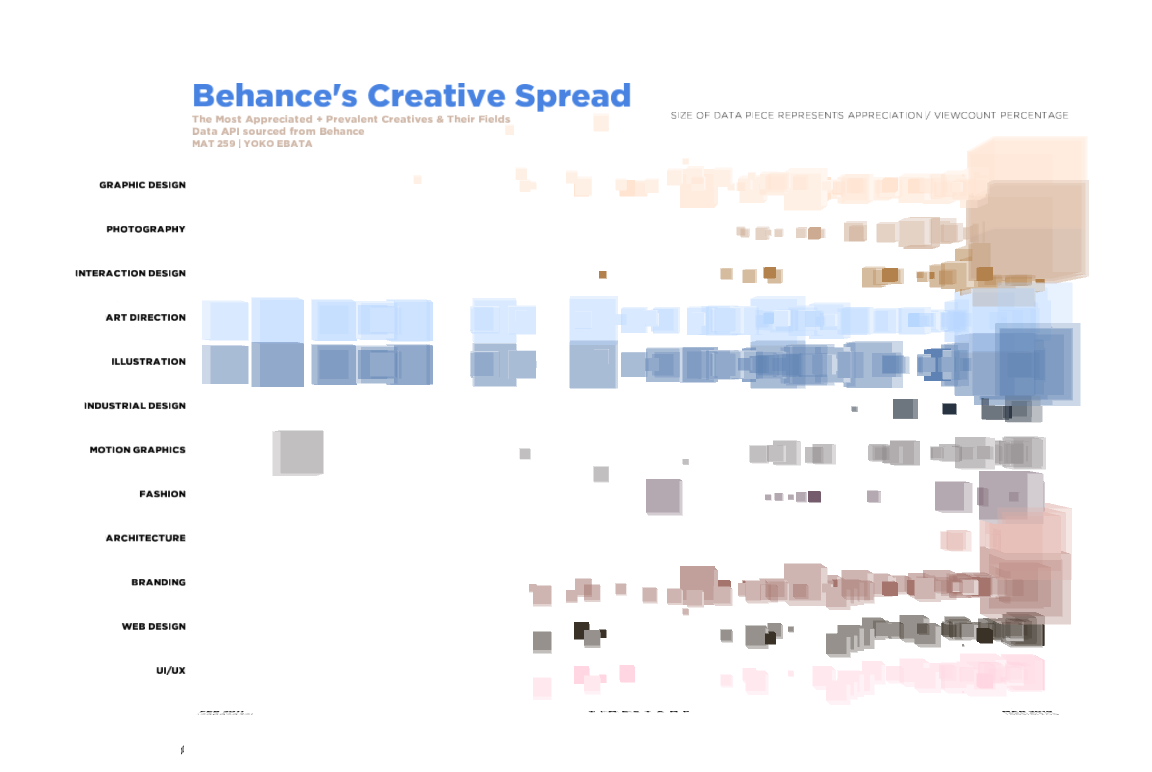
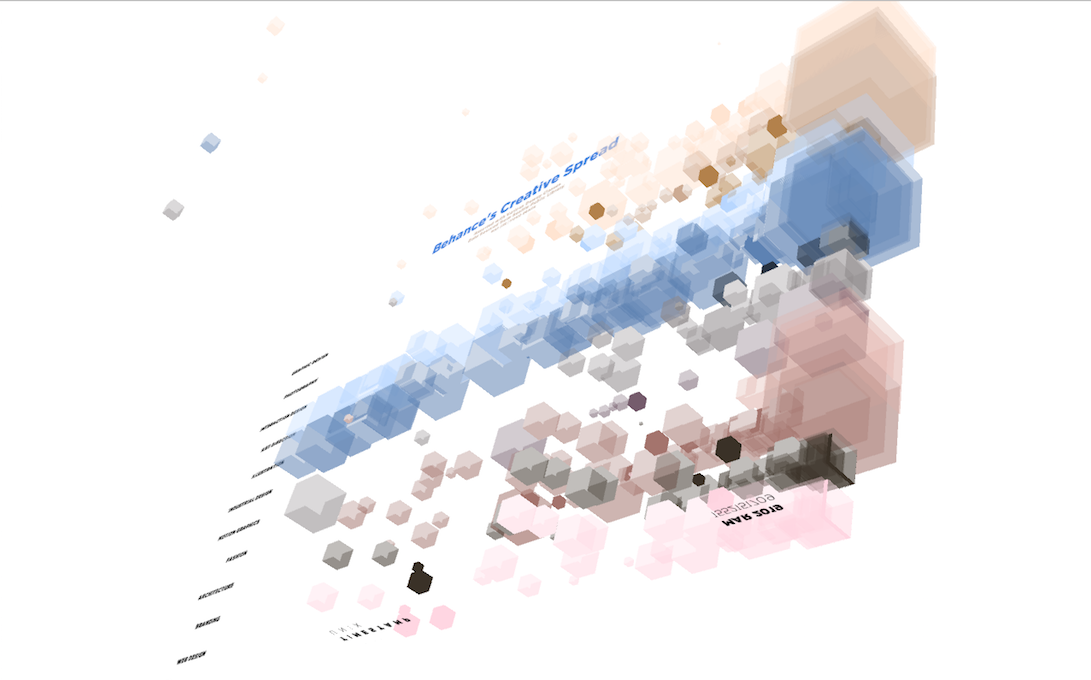
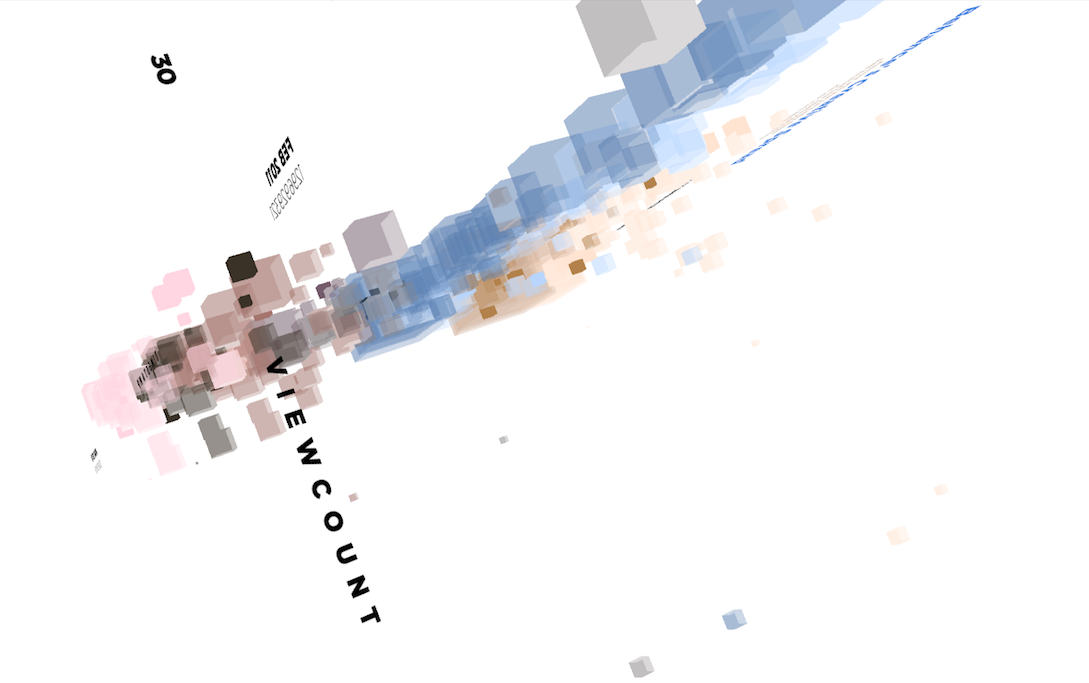
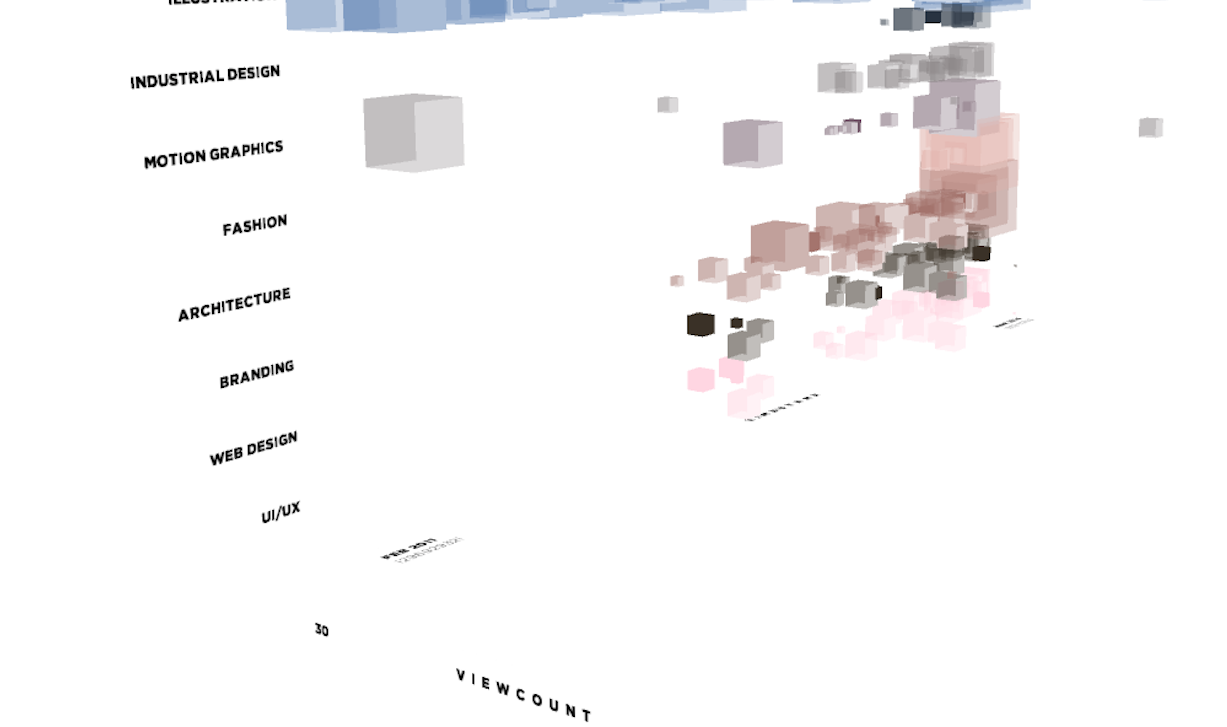
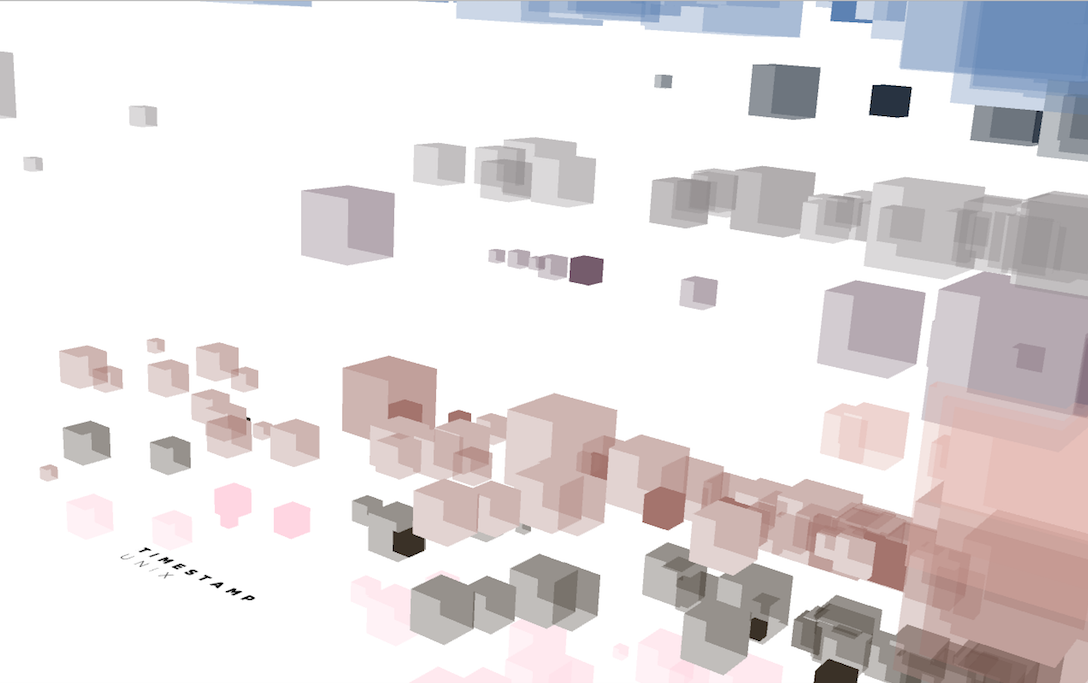
As assumed, it can be observed that the most activity + appreciation takes place in recent years, as Behance's relevance and exposure had caught on throughout time. It can be seen that Art Direction and Illustration are the most veteran fields existing on this platform, going all the way back to the years of 2011-2013. In my decision to lower the opacity of each data point, it catered to the additional understanding of the quantity of appreciated projects produced in that timestamp. Although the data distribution may appear sparse, this data set offers a helpful perspective on the understanding of Behance's visual platform.
The X axis represents time in both DATE/MONTH + UNIX format, the Y axis corresponds to the Creative Fields, and the Z respresents the view count of a project. The sizing of the data reflected the percentage of appreciation values over view counts to exemplify how well-liked the particular project was.
As assumed, it can be observed that the most activity + appreciation takes place in recent years, as Behance's relevance and exposure had caught on throughout time. It can be seen that Art Direction and Illustration are the most veteran fields existing on this platform, going all the way back to the years of 2011-2013. In my decision to lower the opacity of each data point, it catered to the additional understanding of the quantity of appreciated projects produced in that timestamp. Although the data distribution may appear sparse, this data set offers a helpful perspective on the understanding of Behance's visual platform.
Code