News From Home - Visualizing Browsing Activity of Foreign News Articles at the Bpi
MAT 259, 2019
Yichen Li
Concept
The Bpi at the Pompidou Center collects data on news browsing, translation, and video watching activities on its public computers. It is located near several other museums in the 3rd quarter of Paris. According to its 2018 visitor report, 47% of its visitors came from the suburb, 48% came from Paris, and 14% came from Seine-Saint-Denis. Out of all visitors, 24% are of foreign nationality, 12% have dual nationality, and 64% have French nationality. 55% of its visitors only spoke French at home.
Looking at its visitor report, I assumed that many of the visitors must be immigrants, or spoke another language. Therefore, I chose to visualize news browsing activities around foreign news during the week of 8/14 to 8/21 in 2018.
Looking at its visitor report, I assumed that many of the visitors must be immigrants, or spoke another language. Therefore, I chose to visualize news browsing activities around foreign news during the week of 8/14 to 8/21 in 2018.
Query
There was no query for this project.
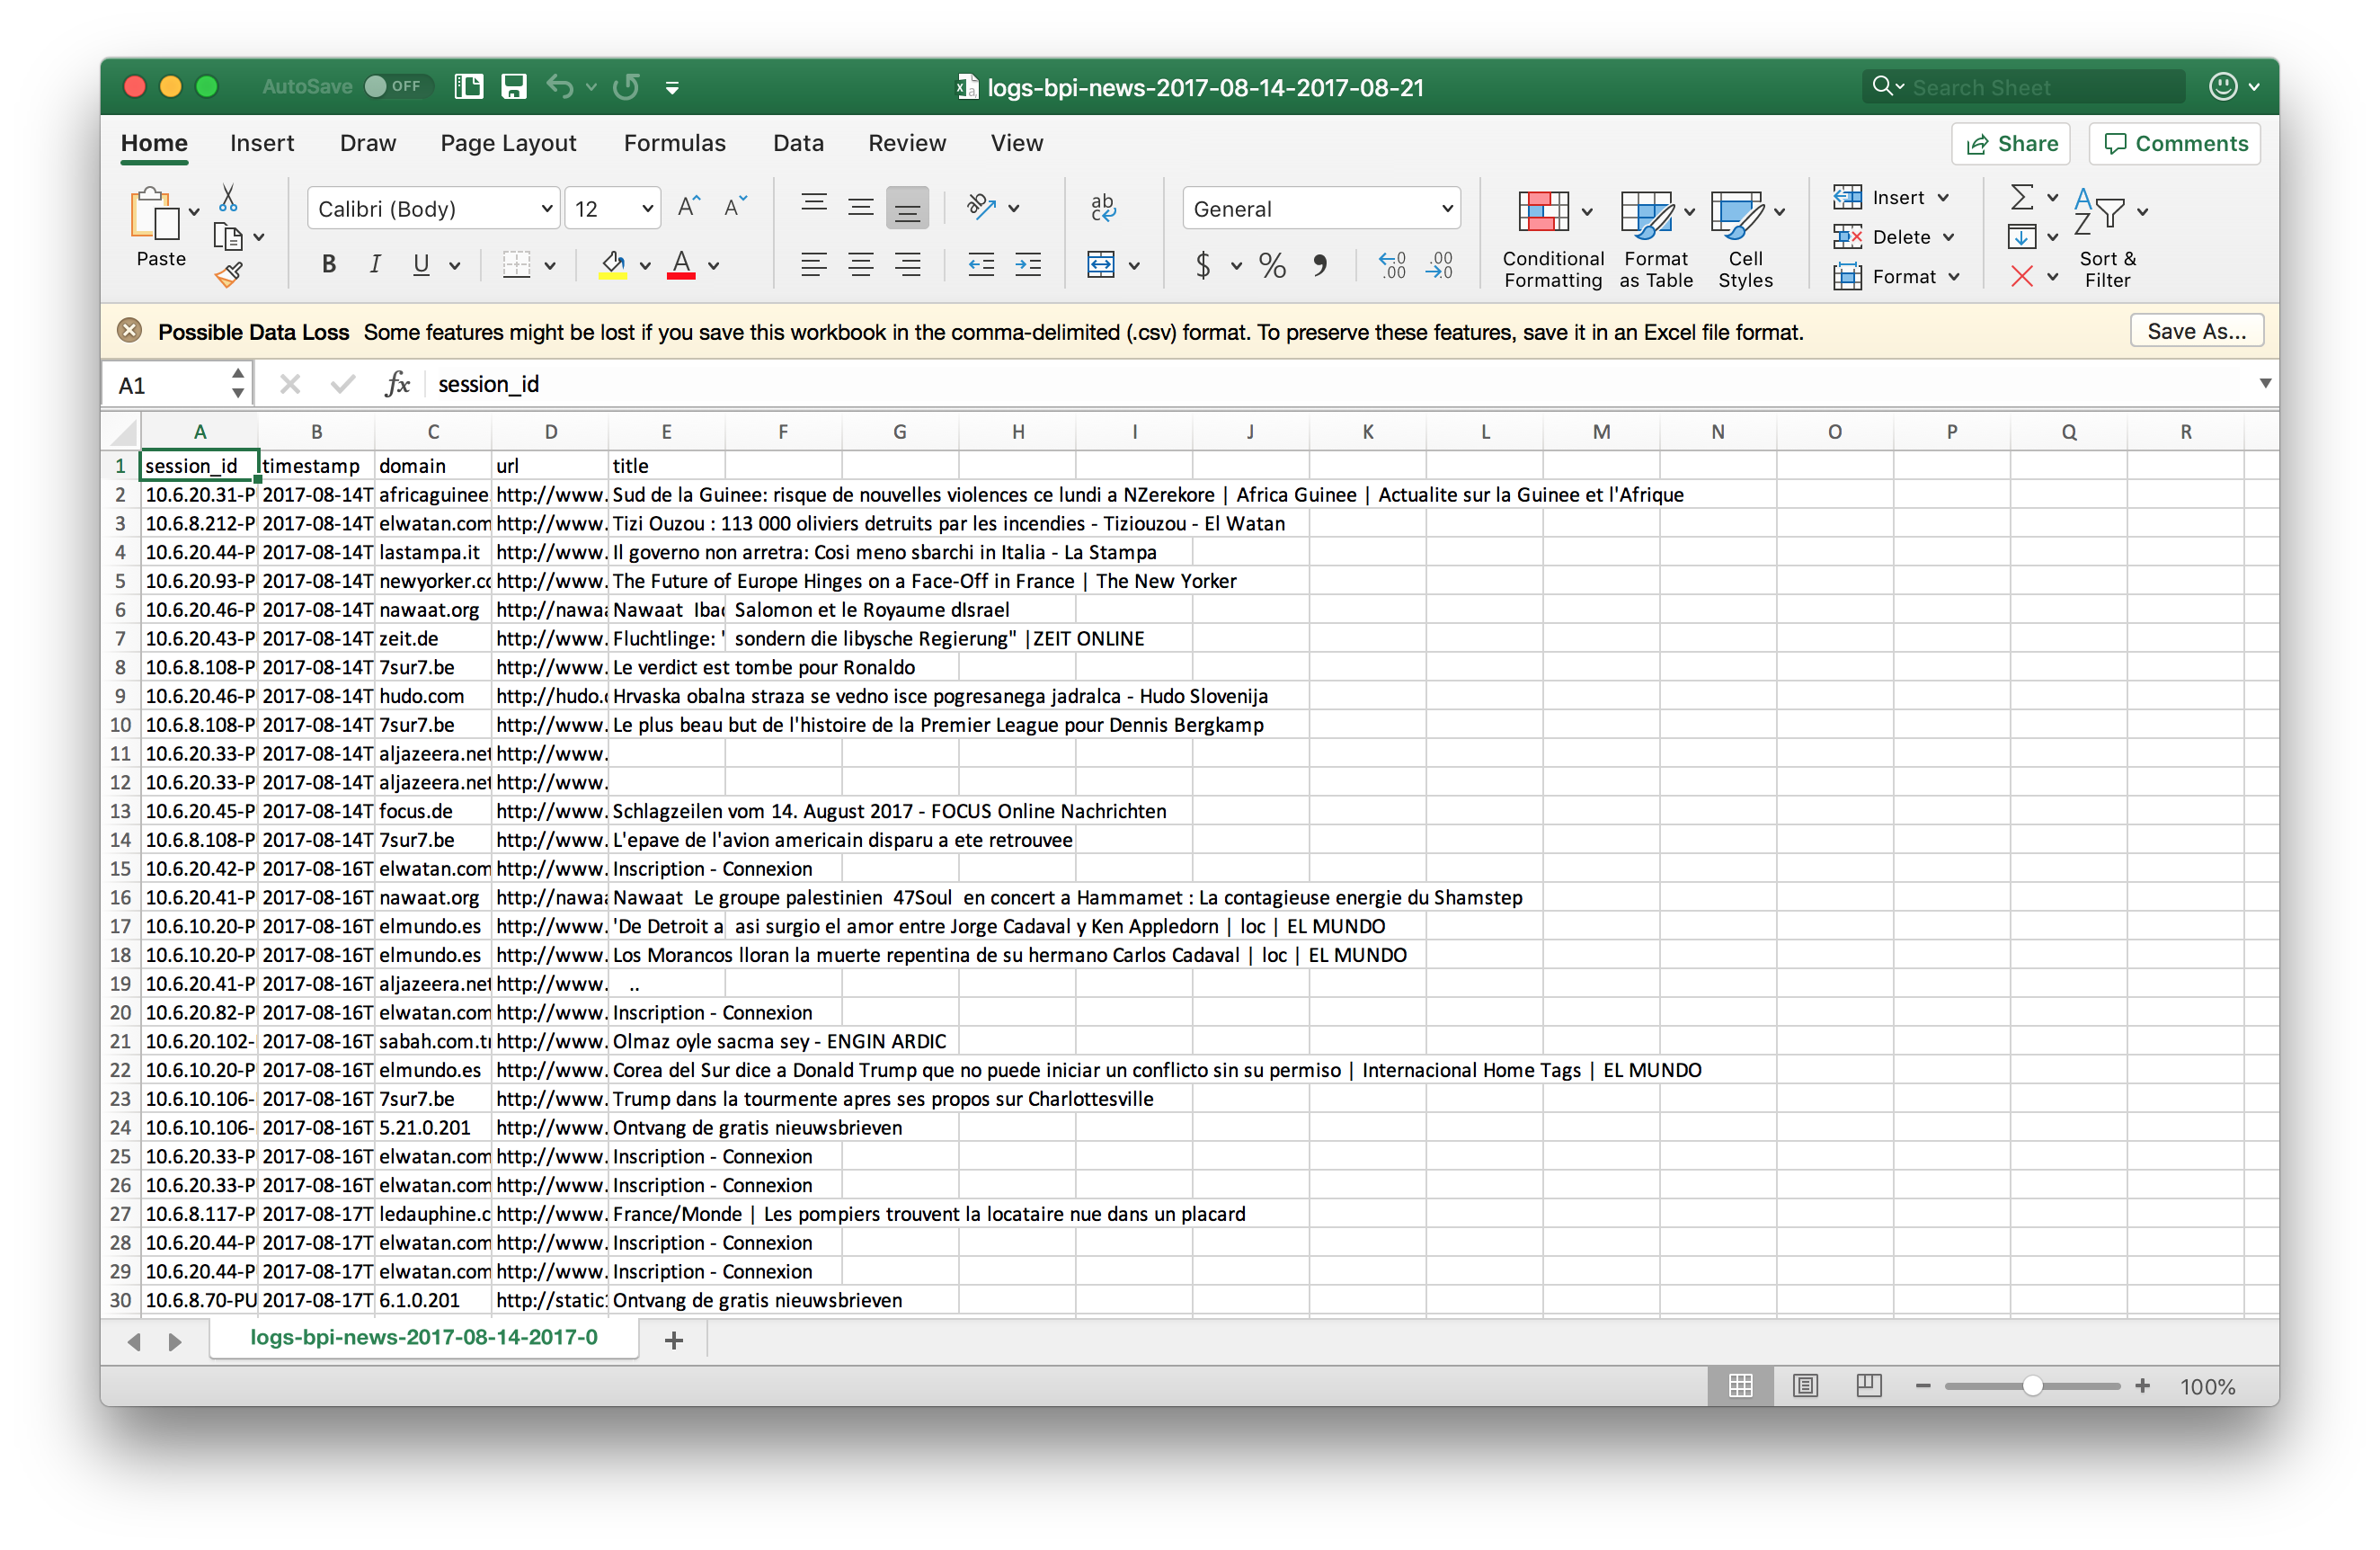
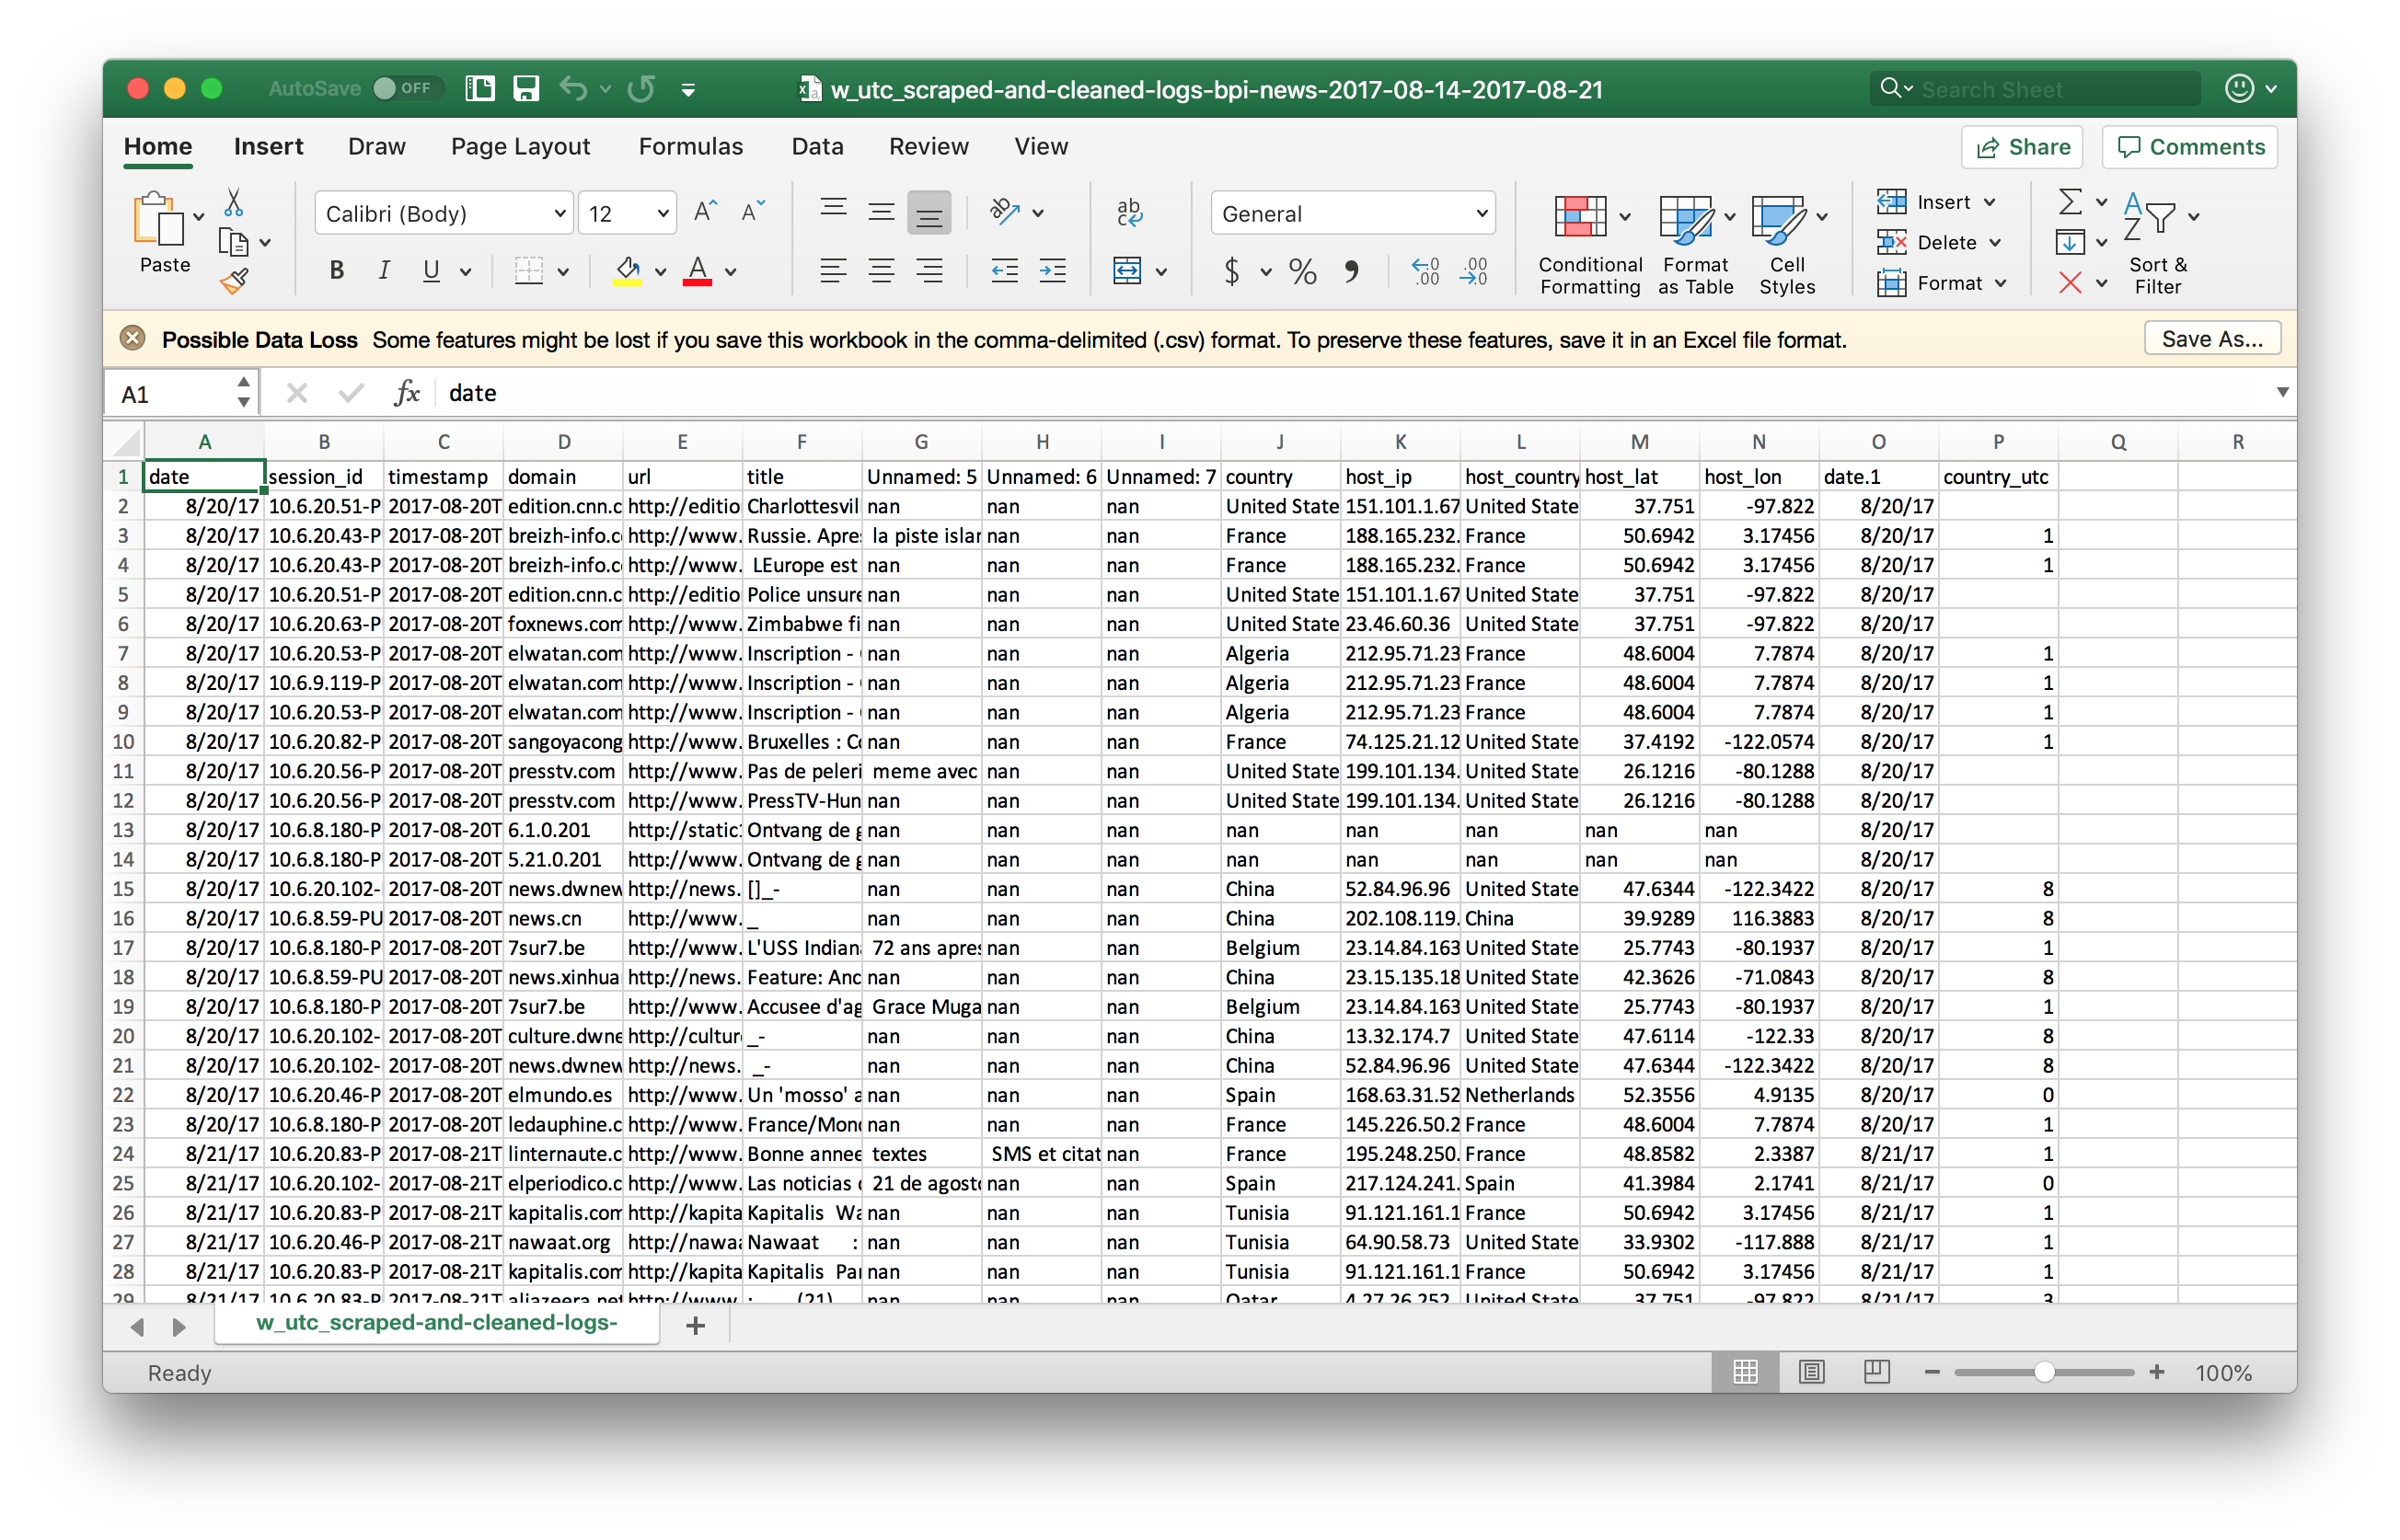
The first step was to delete records of domains such as "lefigaro" and "lemonde", which are based on France. However, since the data itself only provided timestamp, session_id, domain, url, title of each record, several web scrapers written in python were used to infer the country of where most users of the news website are based, the distance of that country from France, the utc offset (roughly responding to timezone) of that country, and the country in which the website is hosted. It is not encouraged to send such large quantities of requests from websites.
The utc offset and distance data were chosen because someone who is far from home internationally often encounter a distance from home not only spatially, but also temporally (an illusive one created by how sunlight travels across the globe). For example, an immigrant could be calling their loved ones at 3am, which would be day time for them.
Preliminary sketches
Initially, I wanted to make a foggy environment in which news articles' distance from the viewer correspond to their respective countries' distance from France. Due to lack of coding skills, a more clear-cut design was used.
Final result
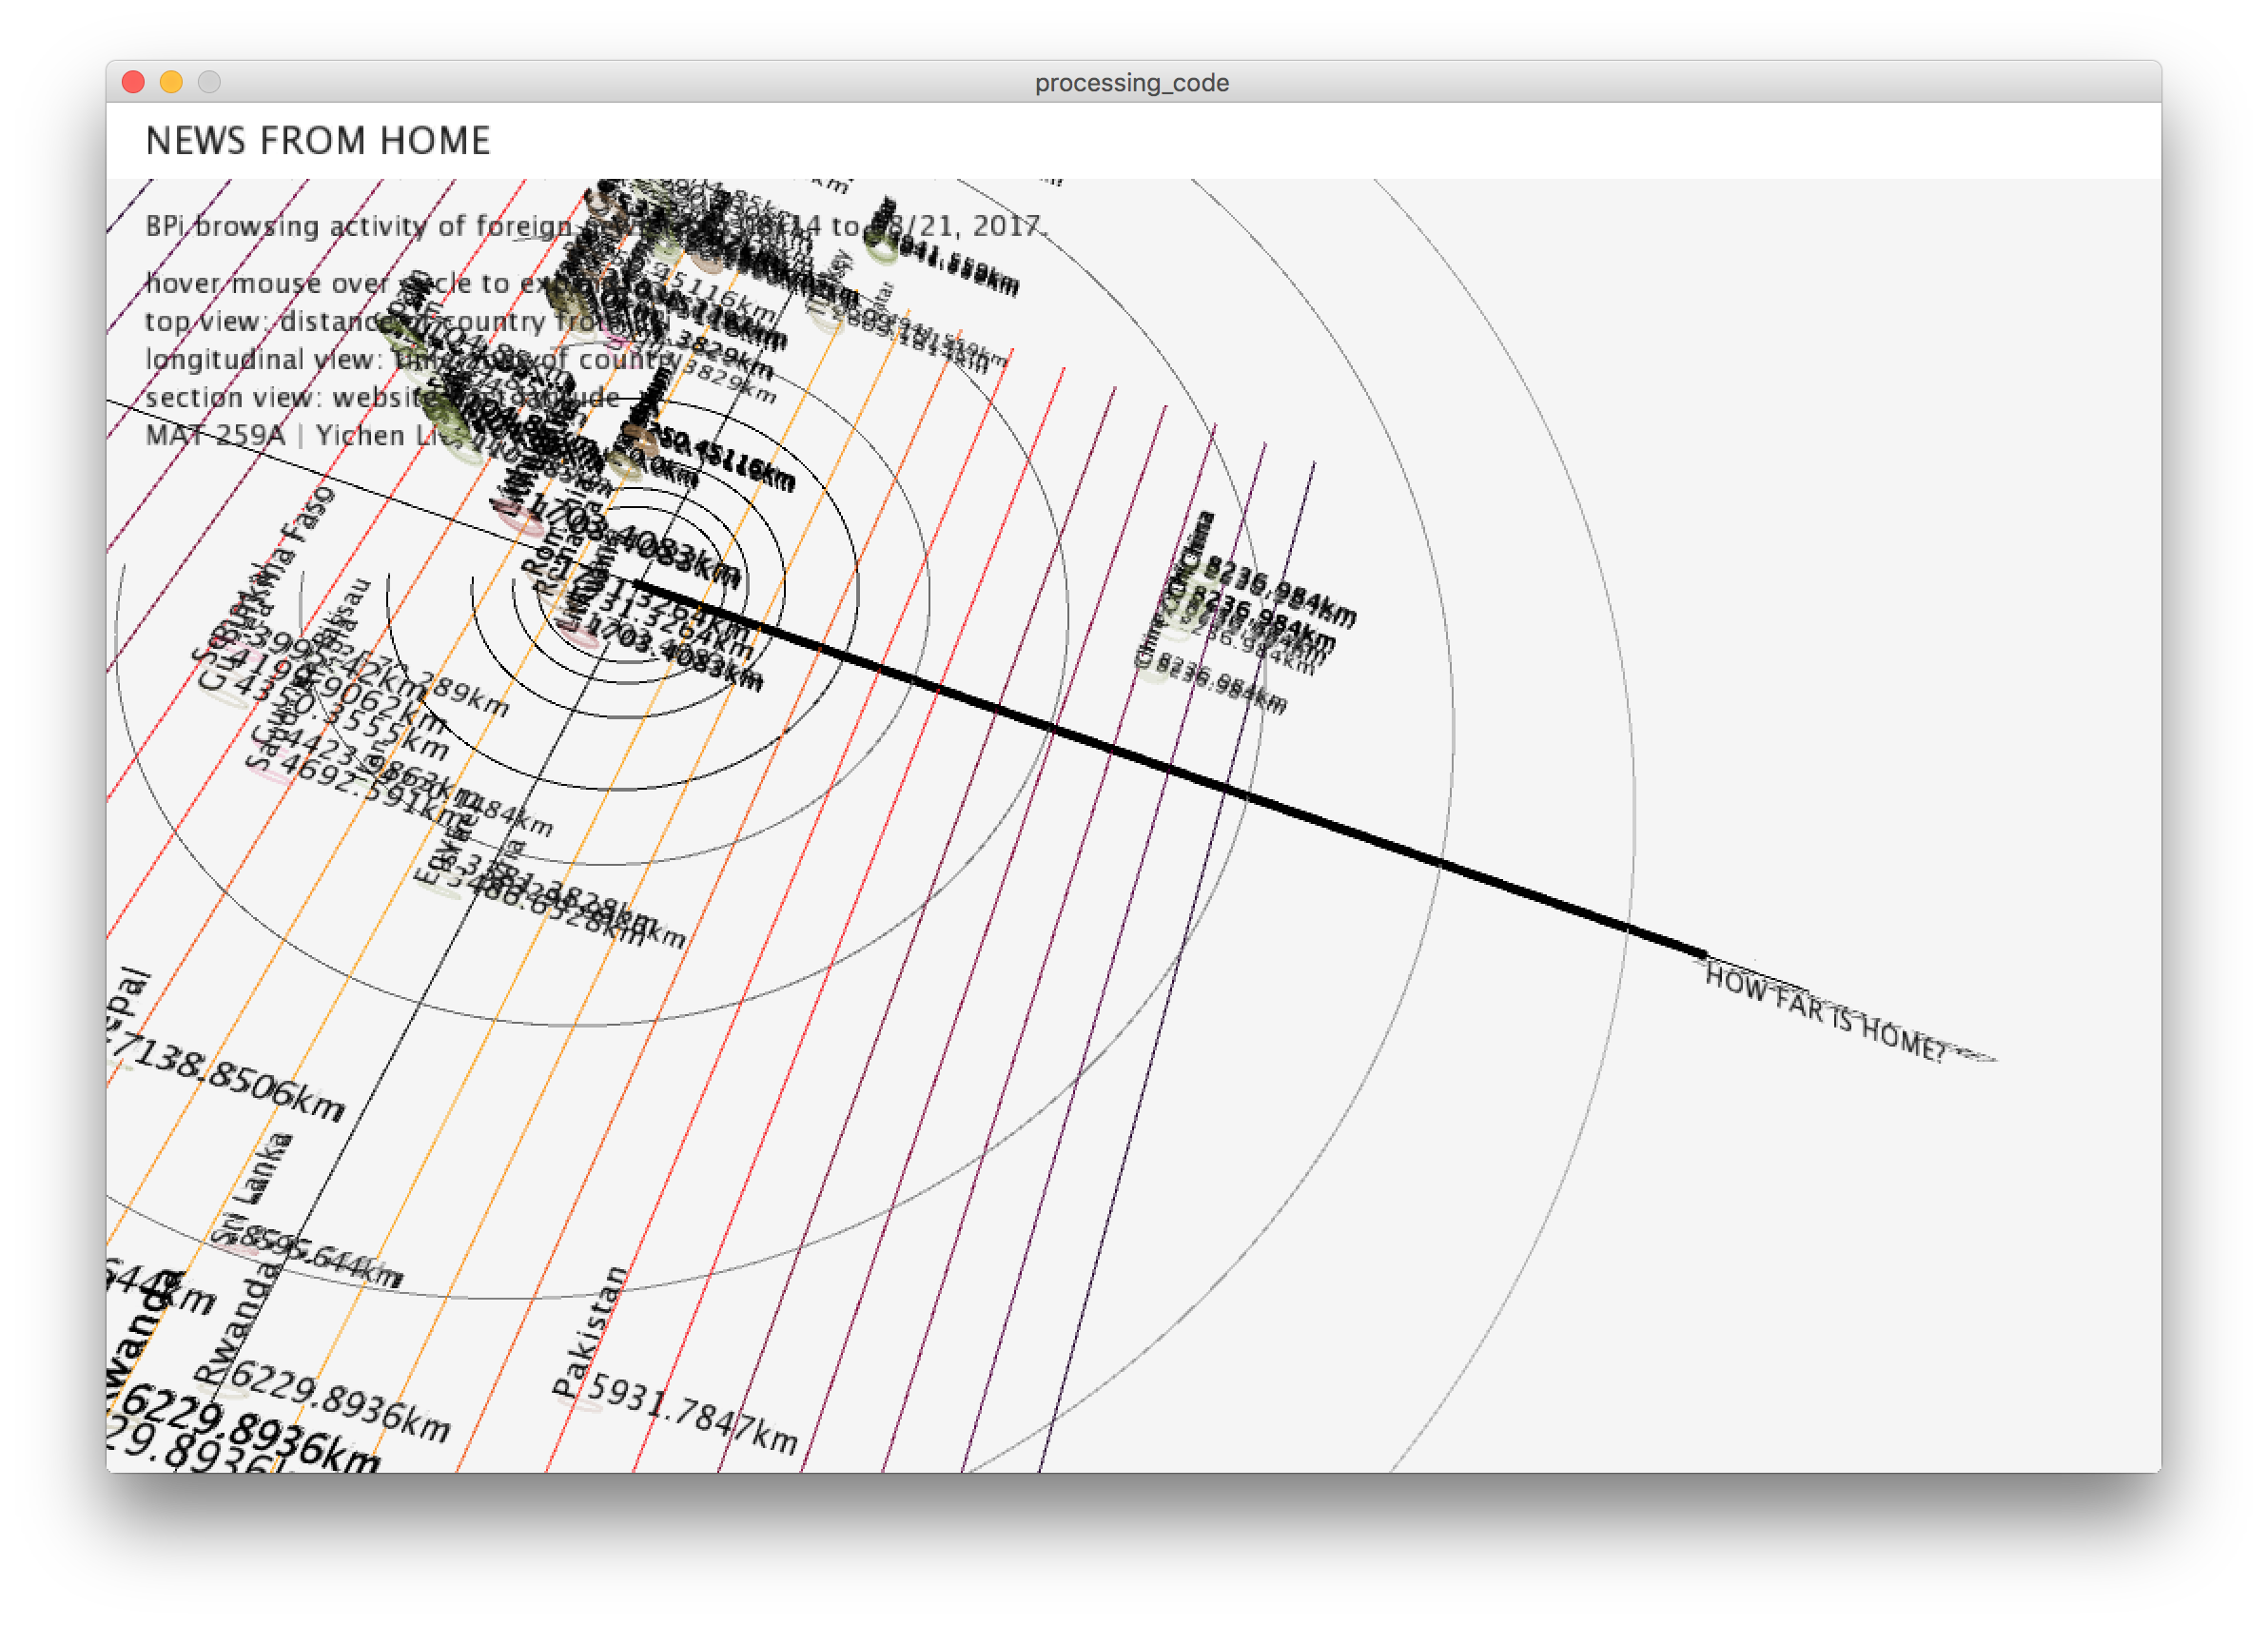
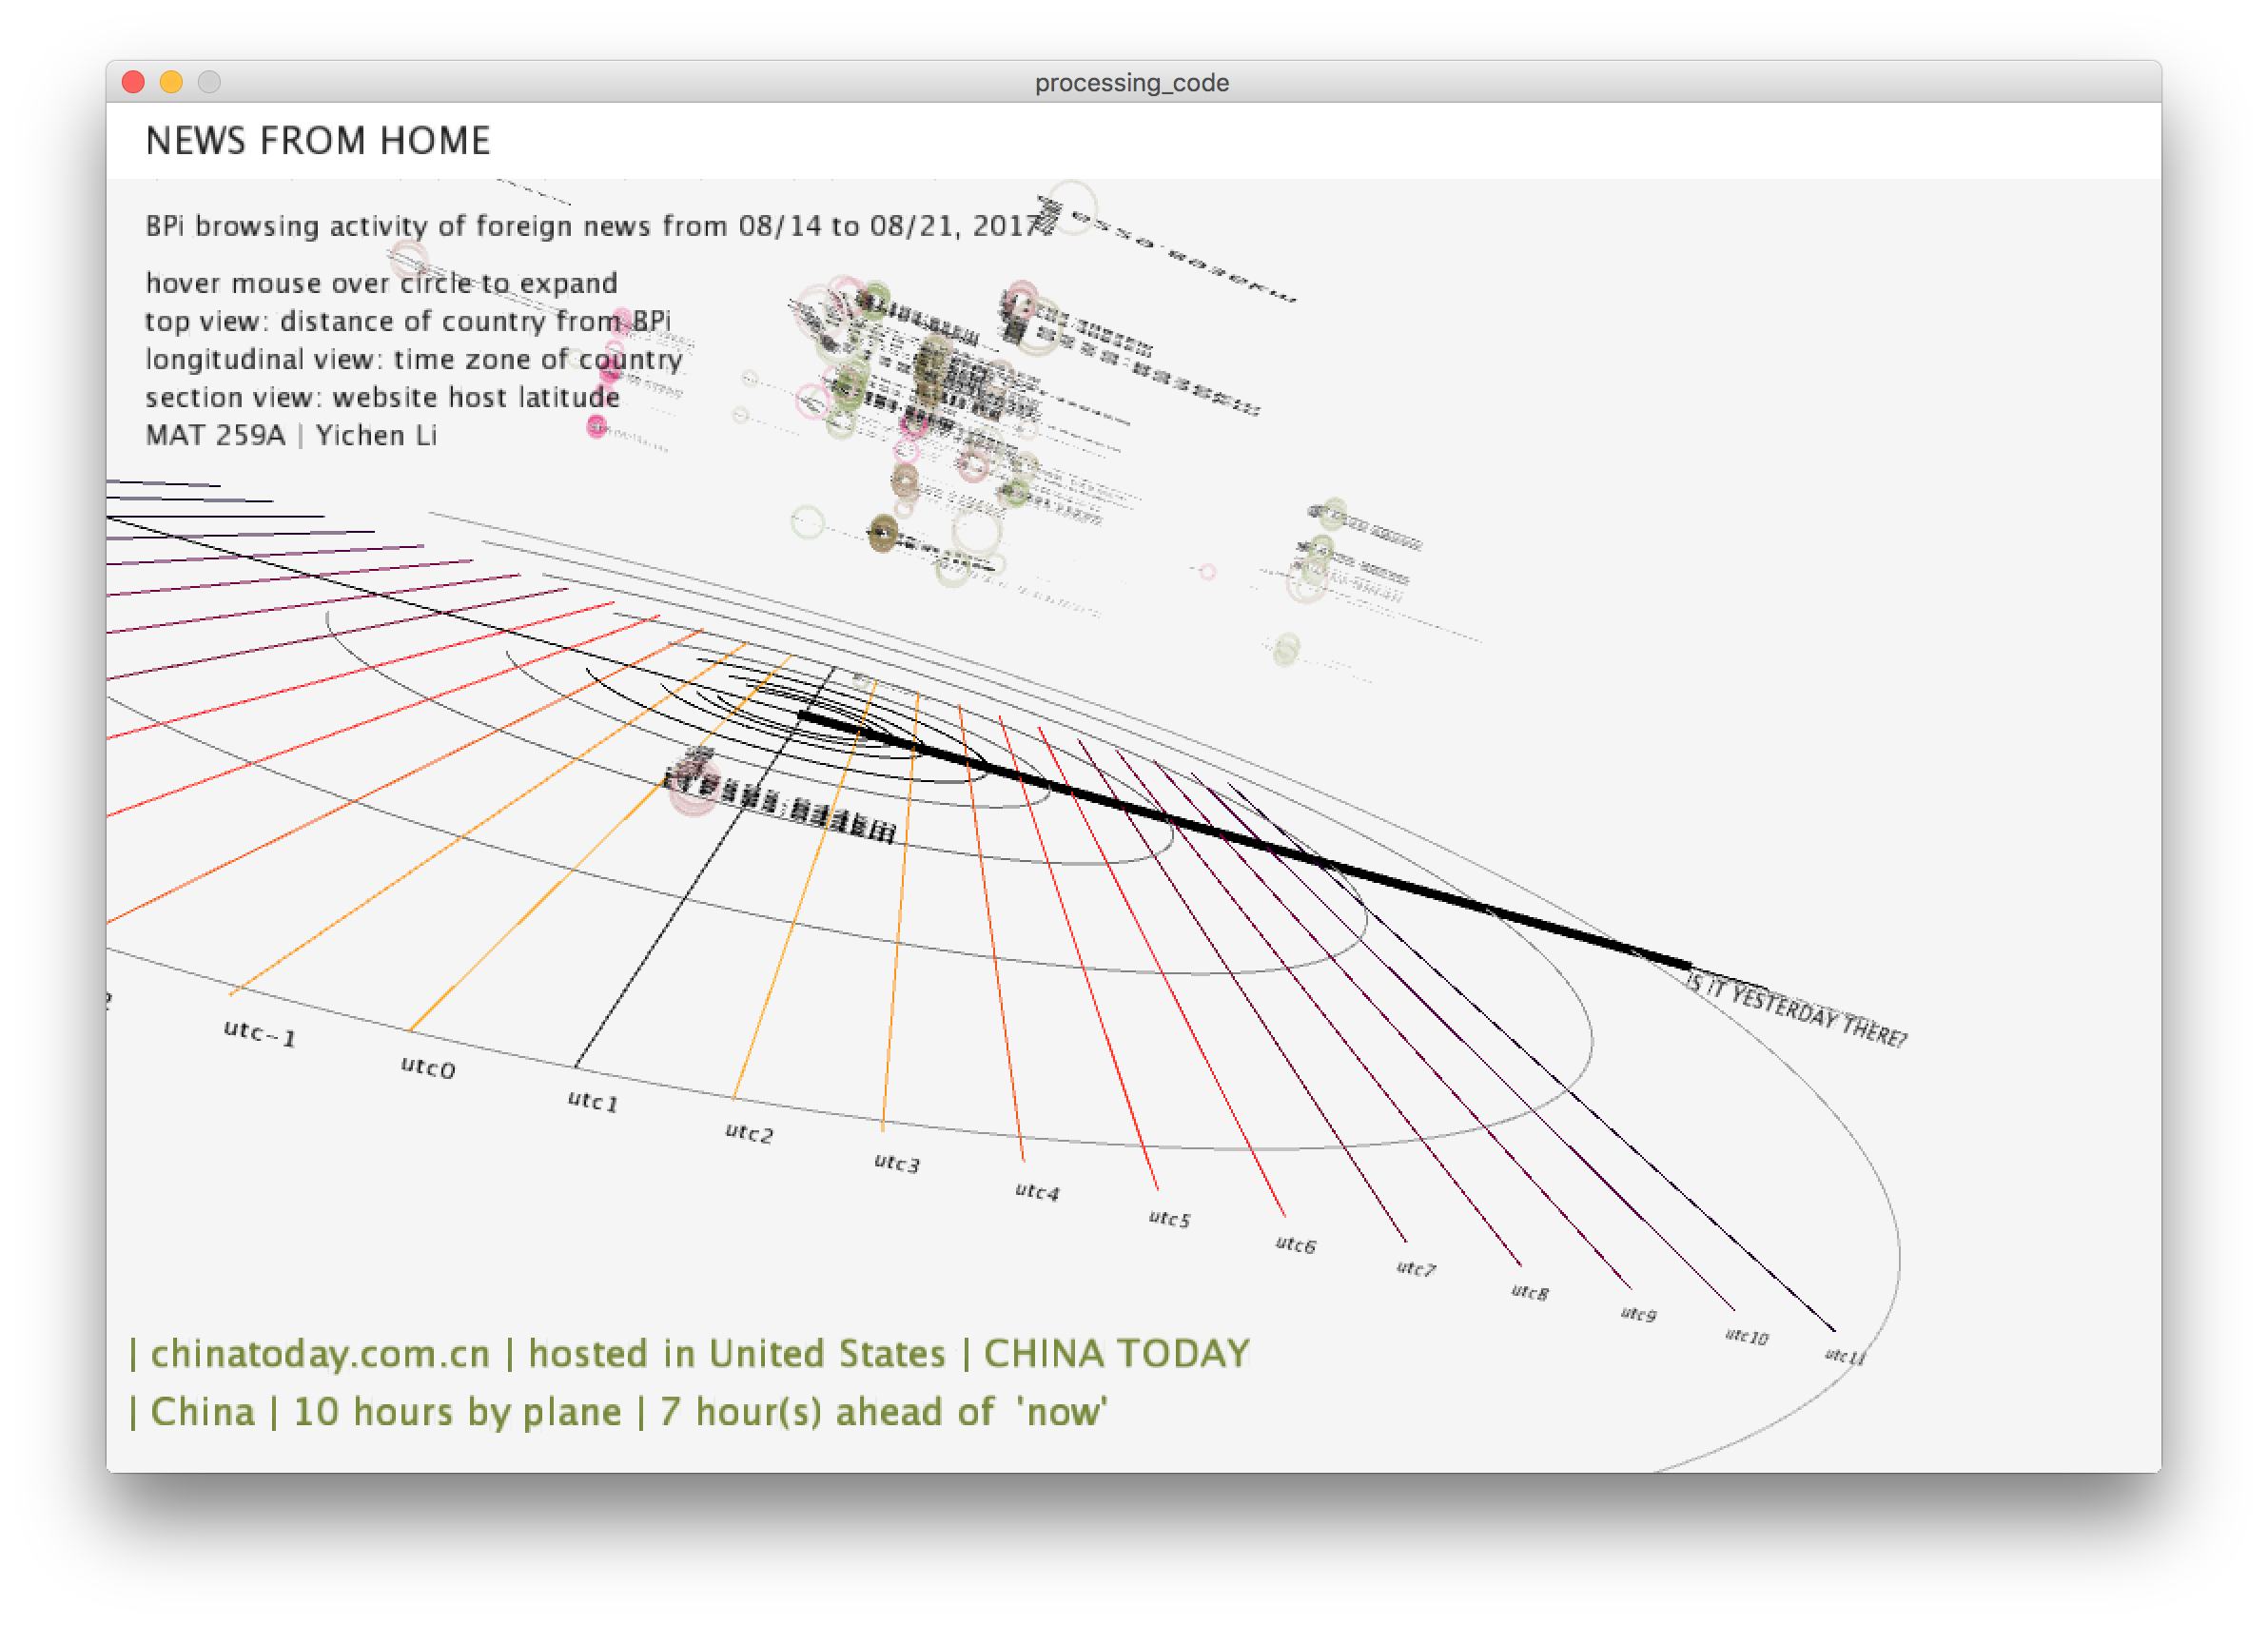
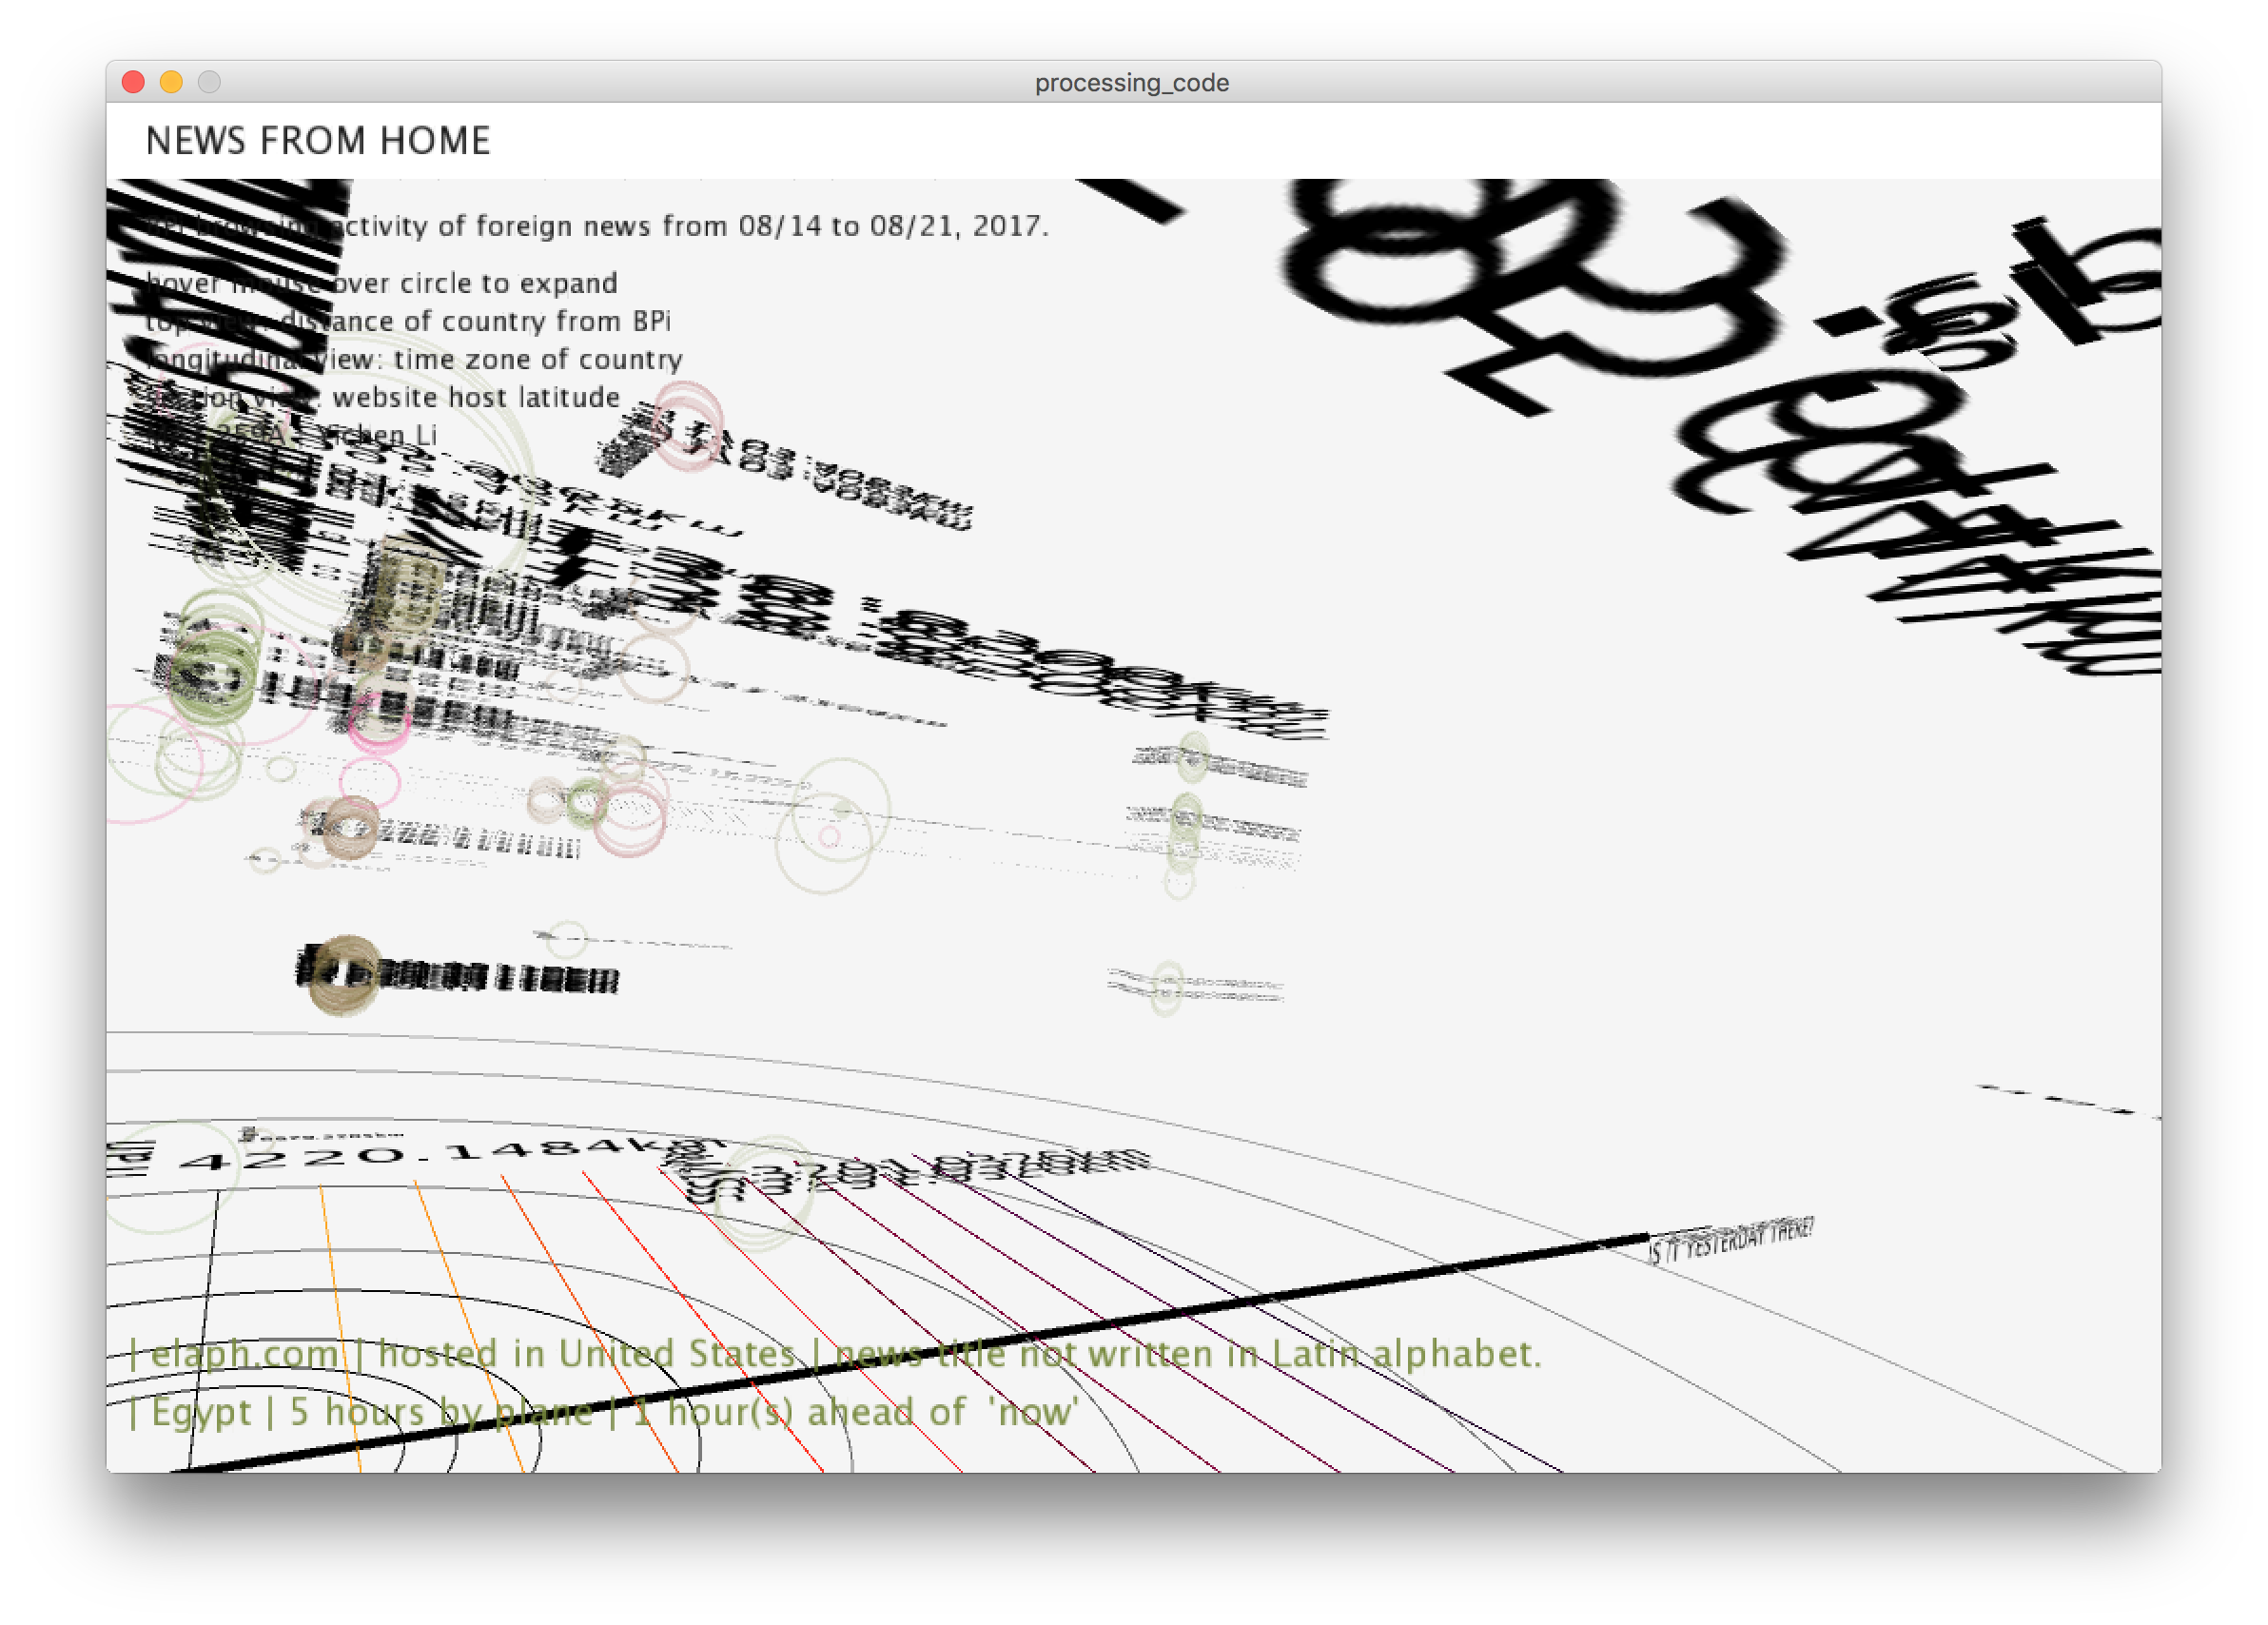
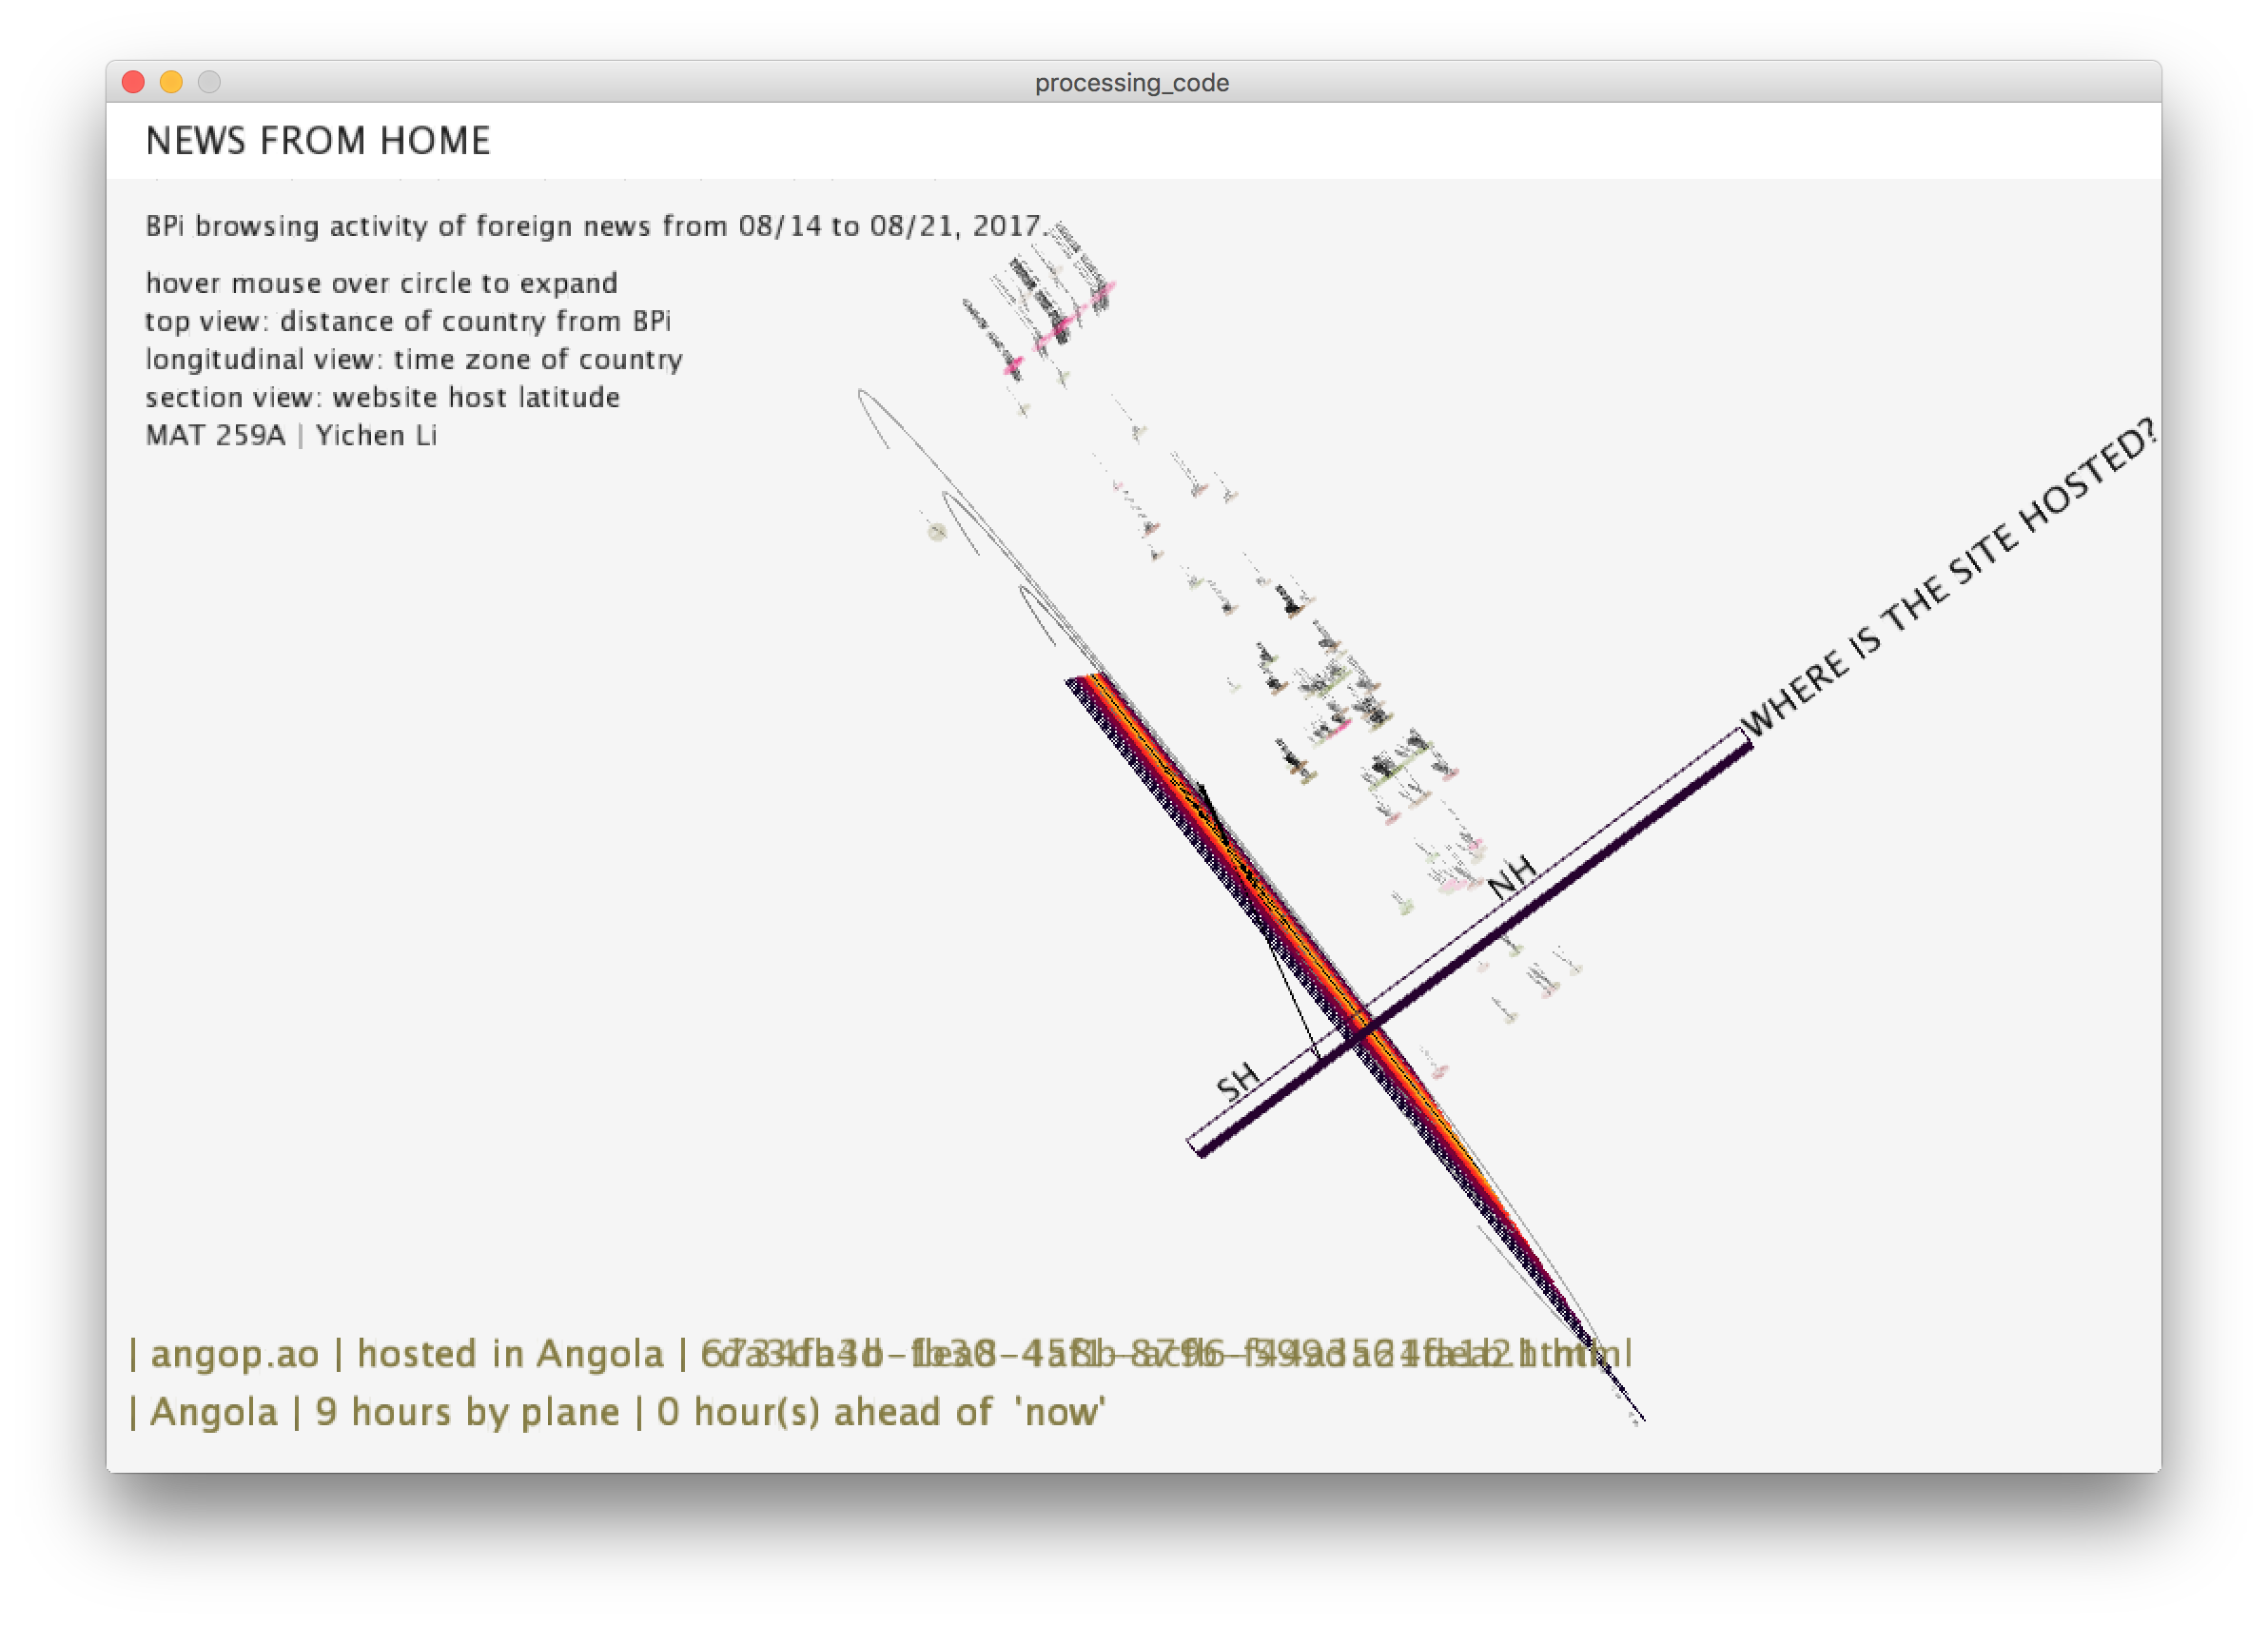
In the final version, news browsing records are represented by a circle, with their colors determined by the word length of their respective countries.
Mouse hovering over one circle shows their country, website host country, title, columns. Some titles are missing in the original data, several link-clicking shows that they are often not written in the Latin alphabet, therefore these titles are shown as "title not written in the latin alphabet".
Estimated travel time by plane (from France) was also added, with cruising speed of plane as 780km/h and take-off/landing time as 0.5h/flight, to make the distance seem more personal. It is a flawed way to visualize travel speed given that some of the countries are not connected to France by land, even though realistically, not everyone would have the privilege of taking the plane.
Another metric was added to represent latitude of the web server hosting the news website. Despite the fact that some of the countries those news articles talk about are in the Southern Hemisphere, all but two news articles visited were hosted by servers in the Northern Hemisphere.
Code