U.S. Lightning strikes in 2012
MAT 259, 2019
Sandy Schoettler

Concept
The purpose of this project is to visualize lightning strike data in the US. The lightning data is from a US government database and the geographic state data is from a shapefile from the US Census Bureau. The lightning strike data is stored in terms of latitude / longitude coordinates, together with a total number of lightning strikes for that approximate location in 2012. With this data, I used a Deluaney mesh triangulation algorithm to compute a 2D triangular mesh connecting these geographic locations in triangles. Then, I transformed the triangular height-map, and the map of the states itself, onto the surface of a sphere using a 3D spherical coordinate system, to mimic a globe.

Preliminary sketches

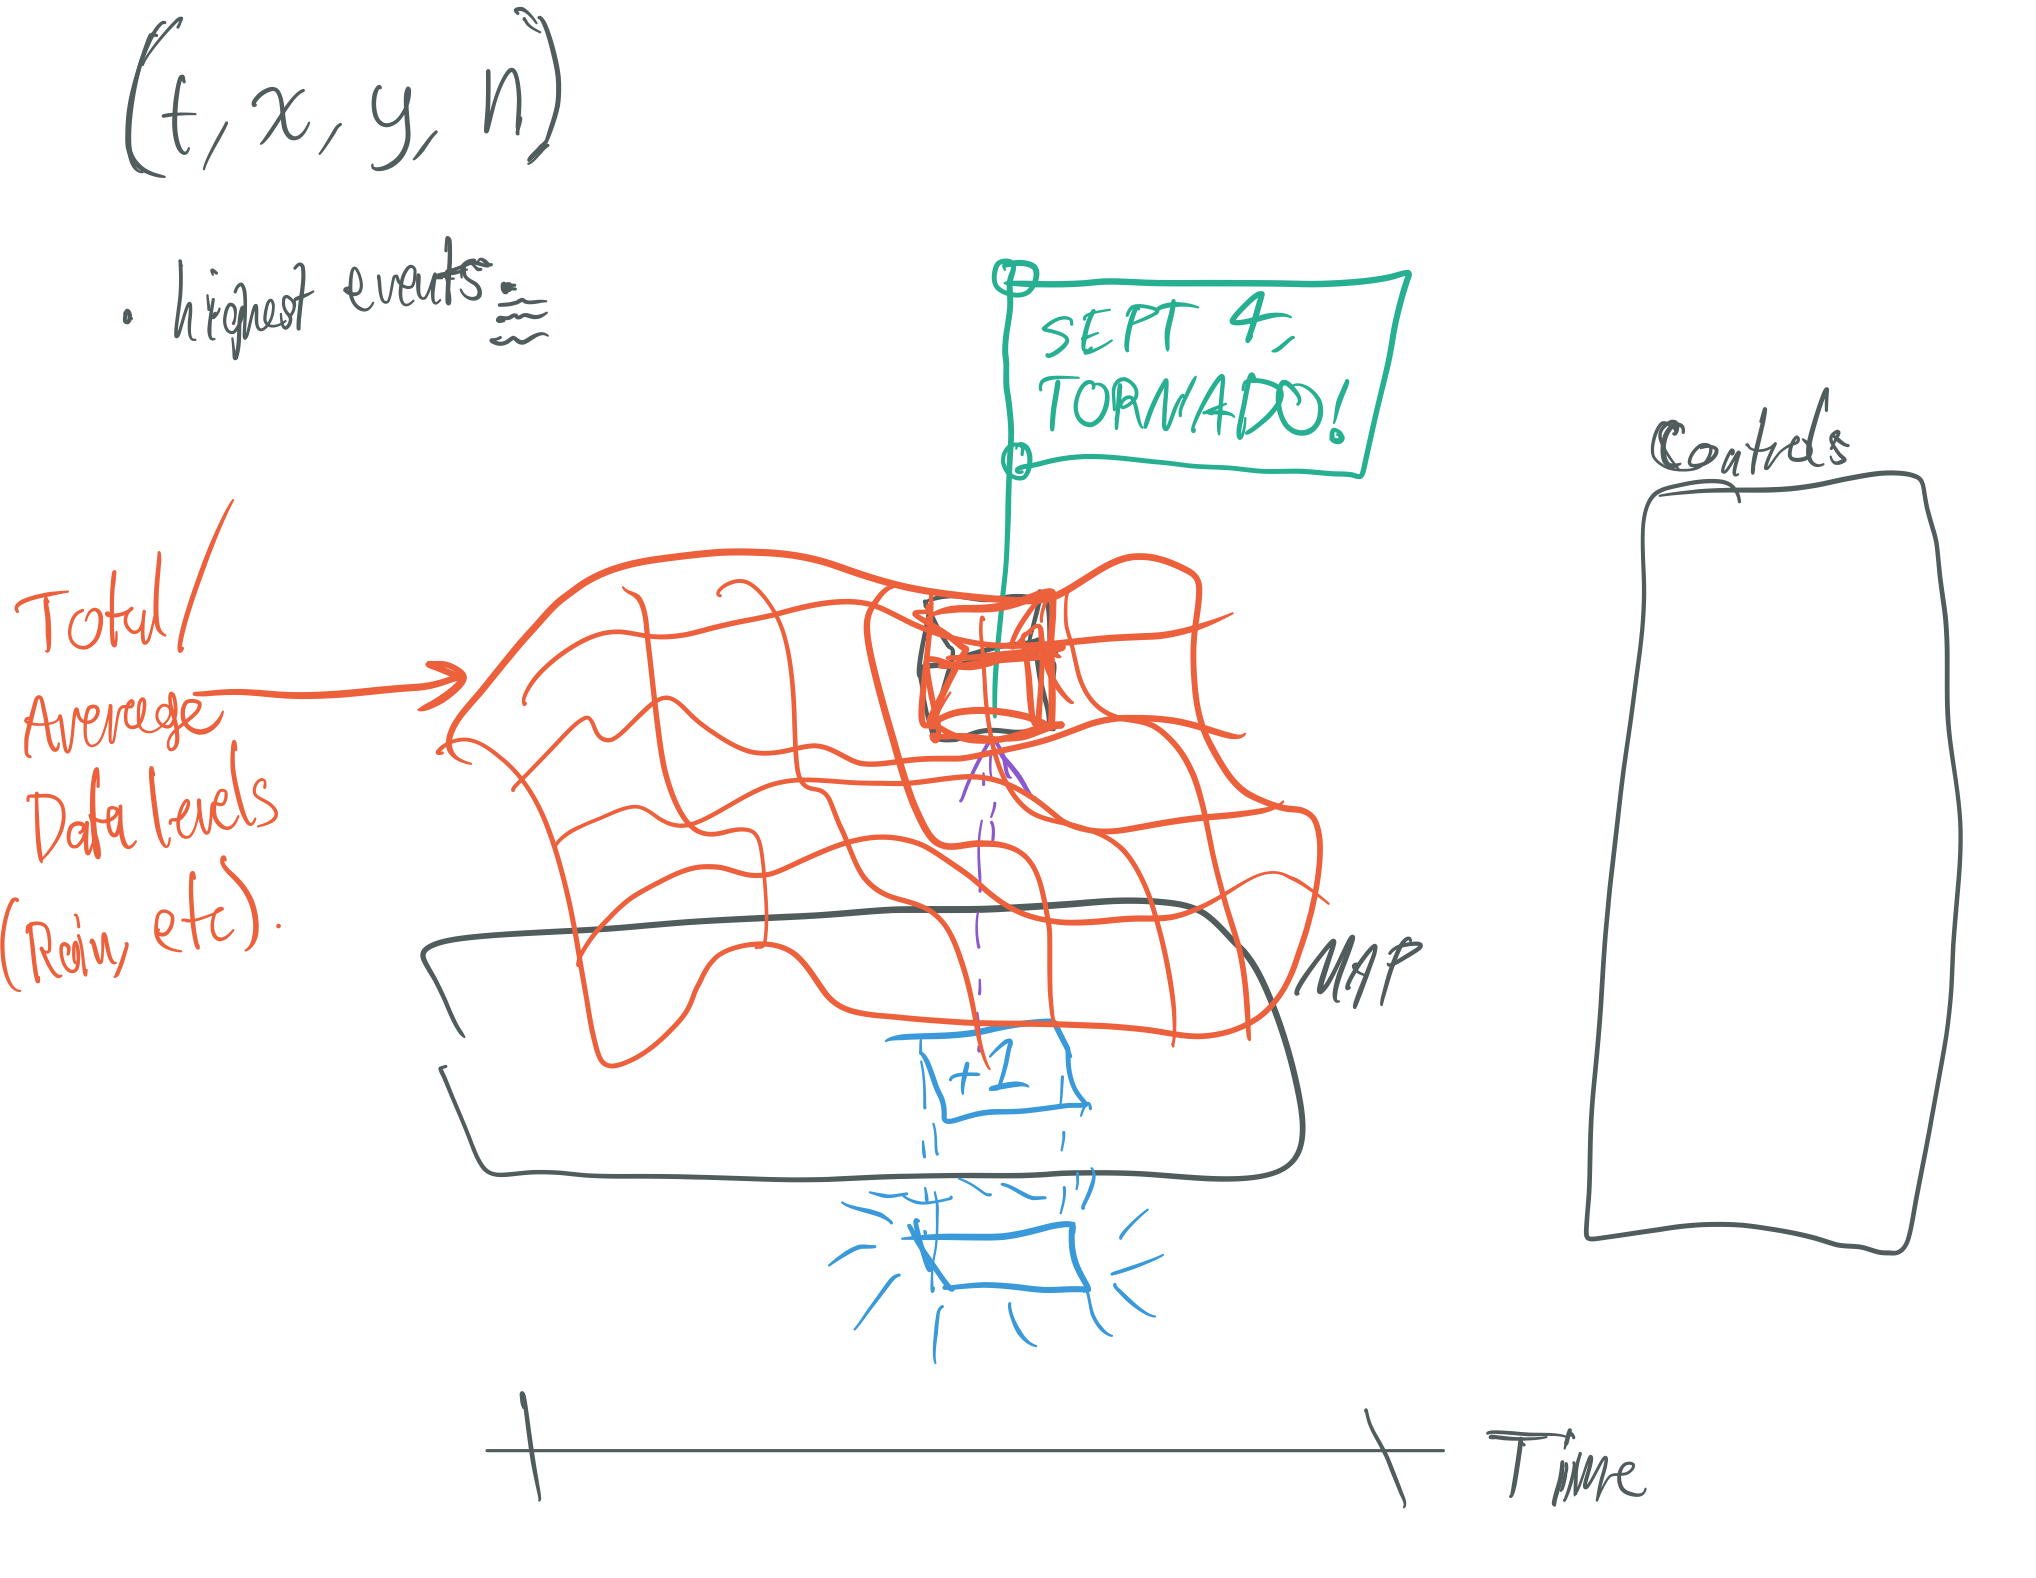
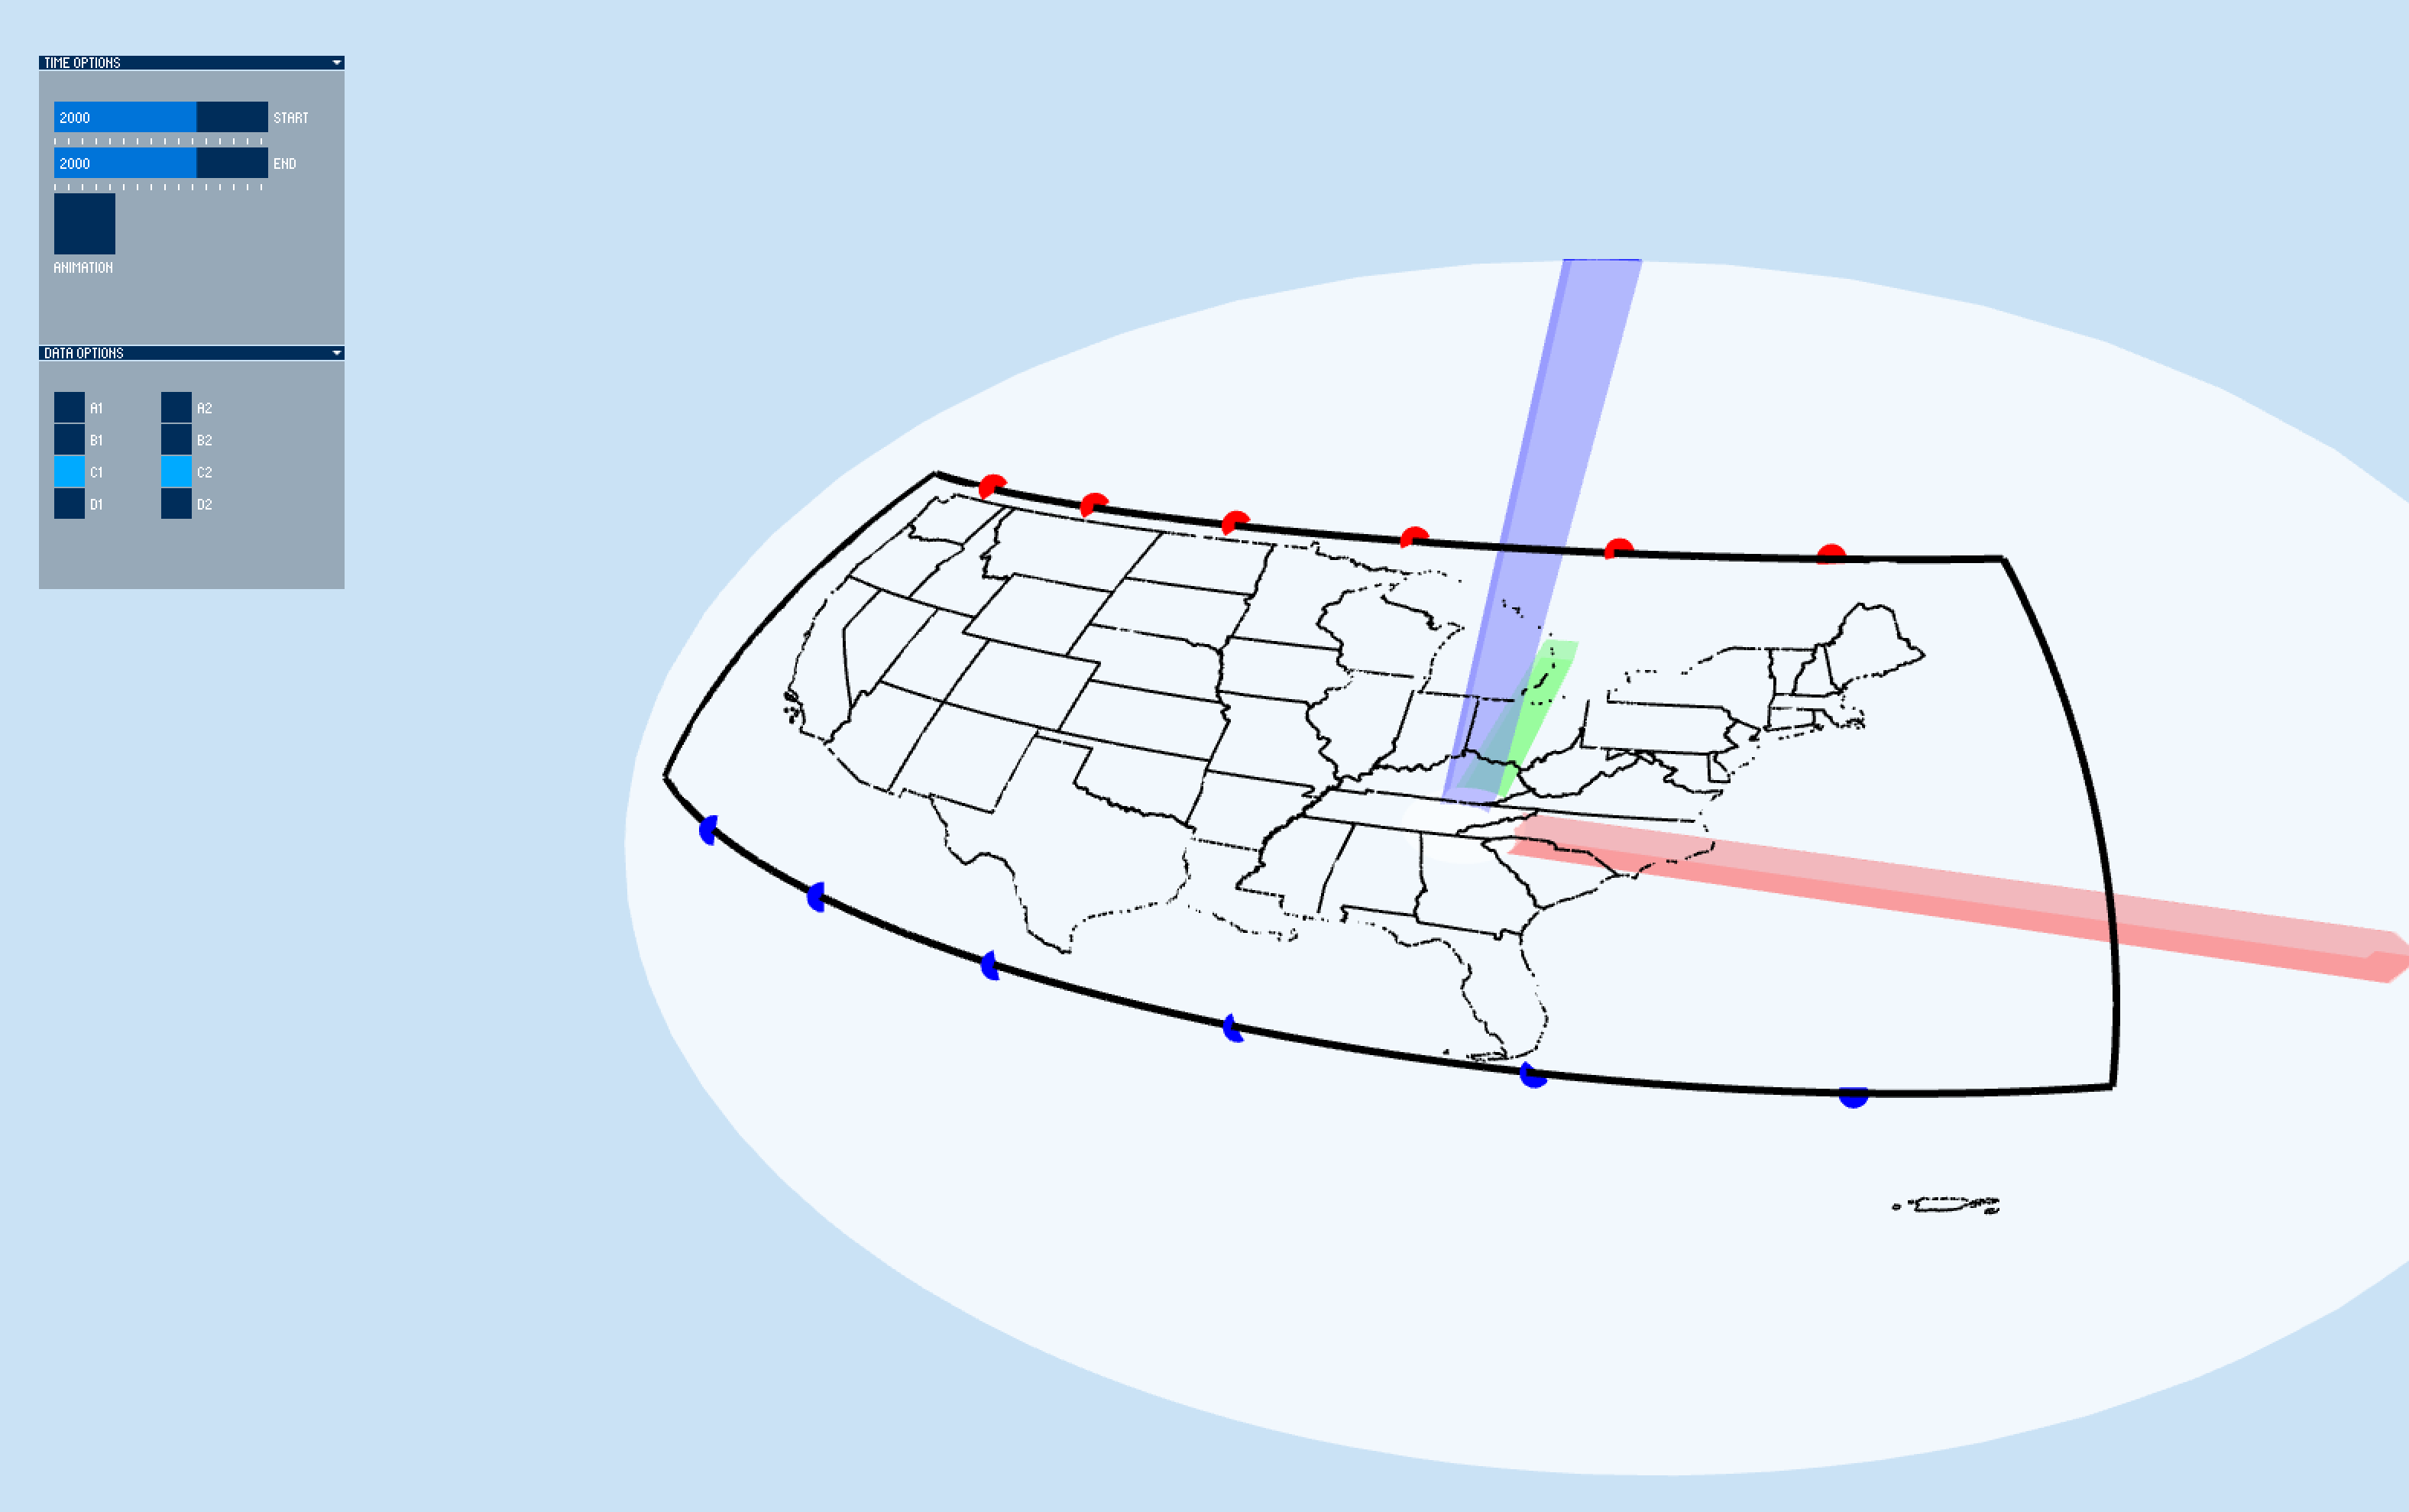
This is one sketch I made, originally including an idea for marking when other events occurred (in the sketch, a tornado).


Process

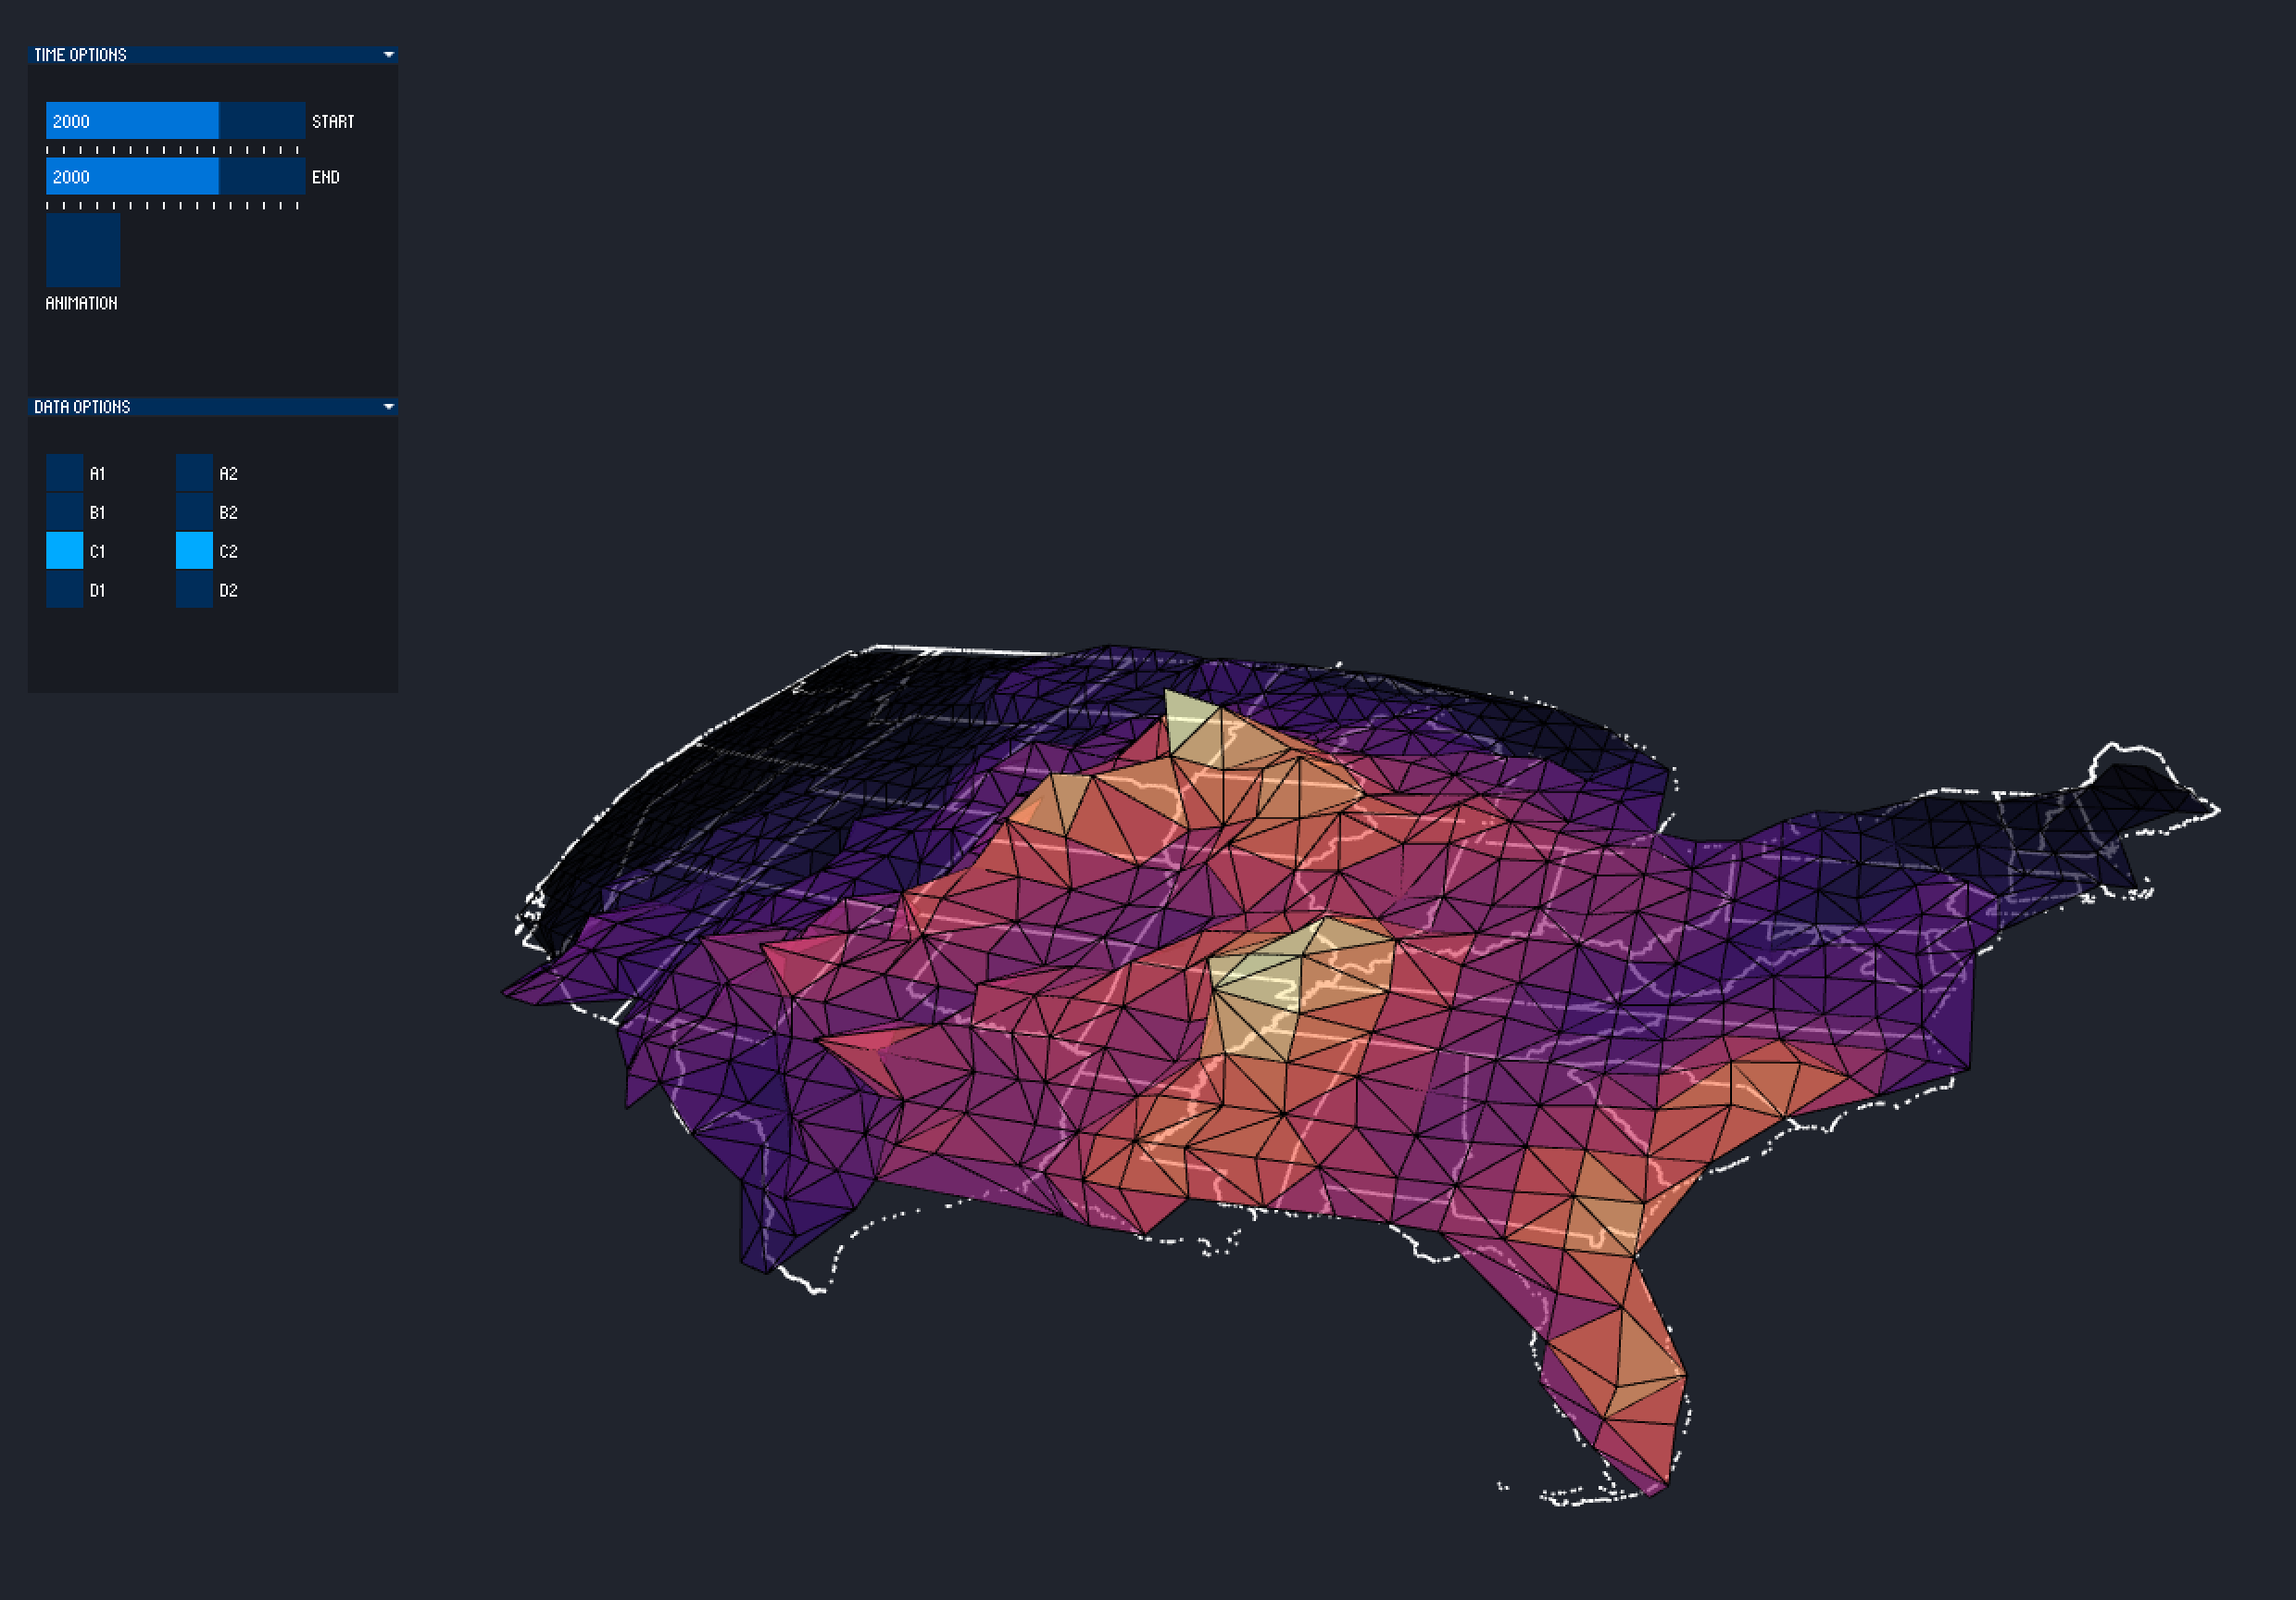
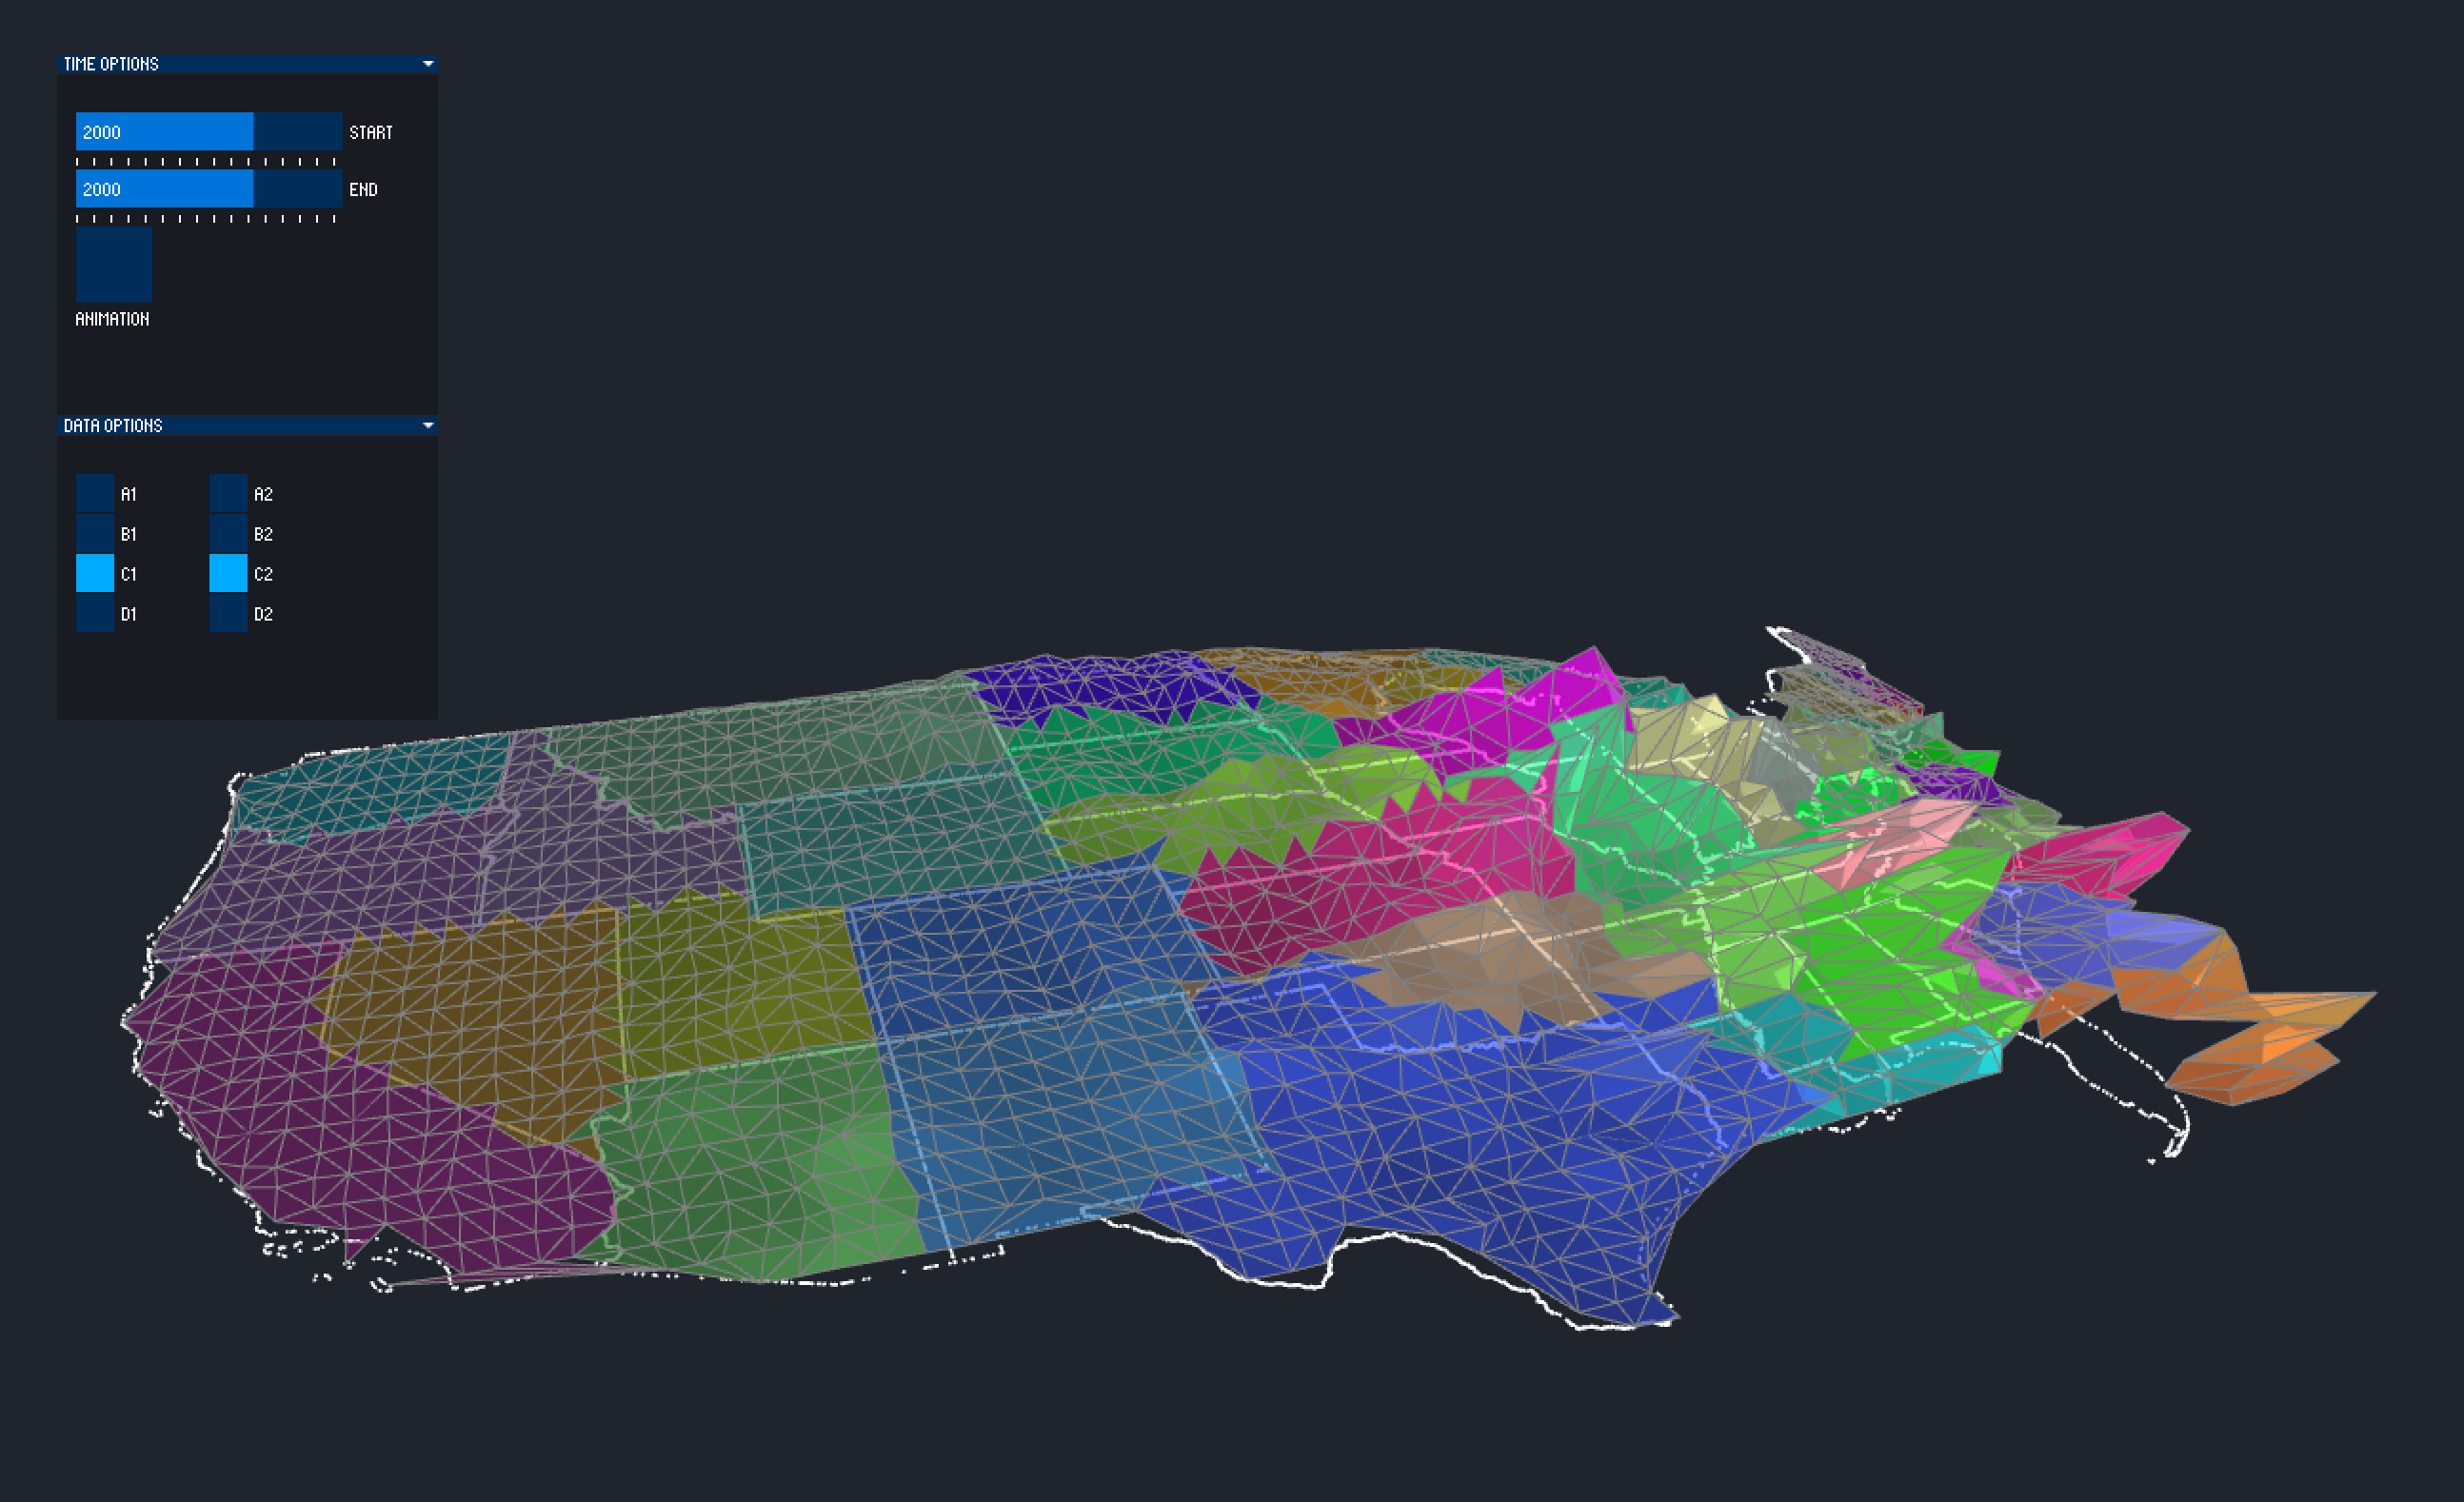
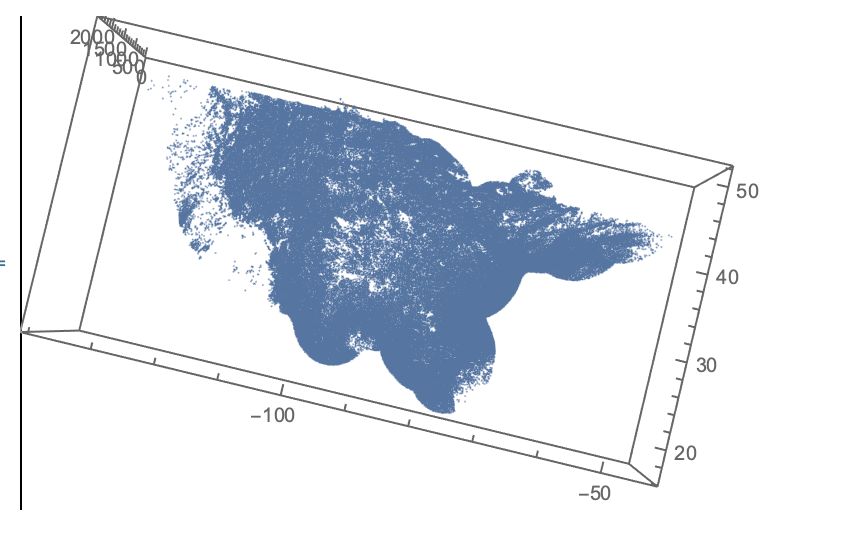
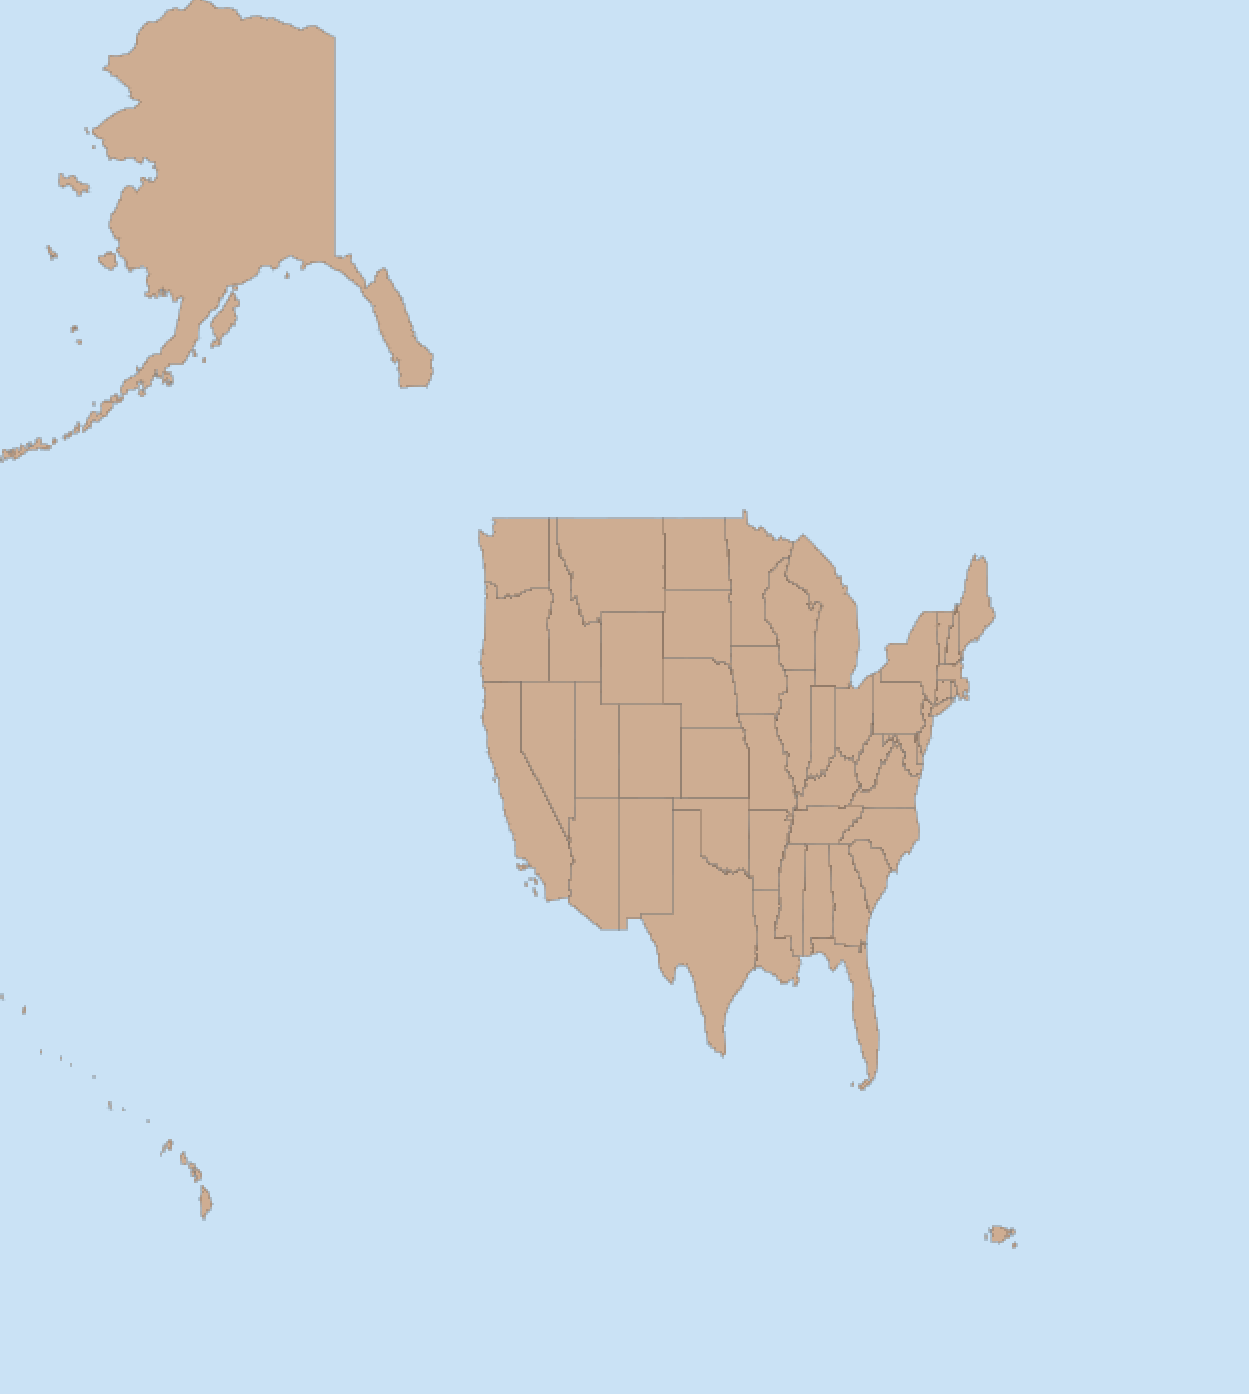
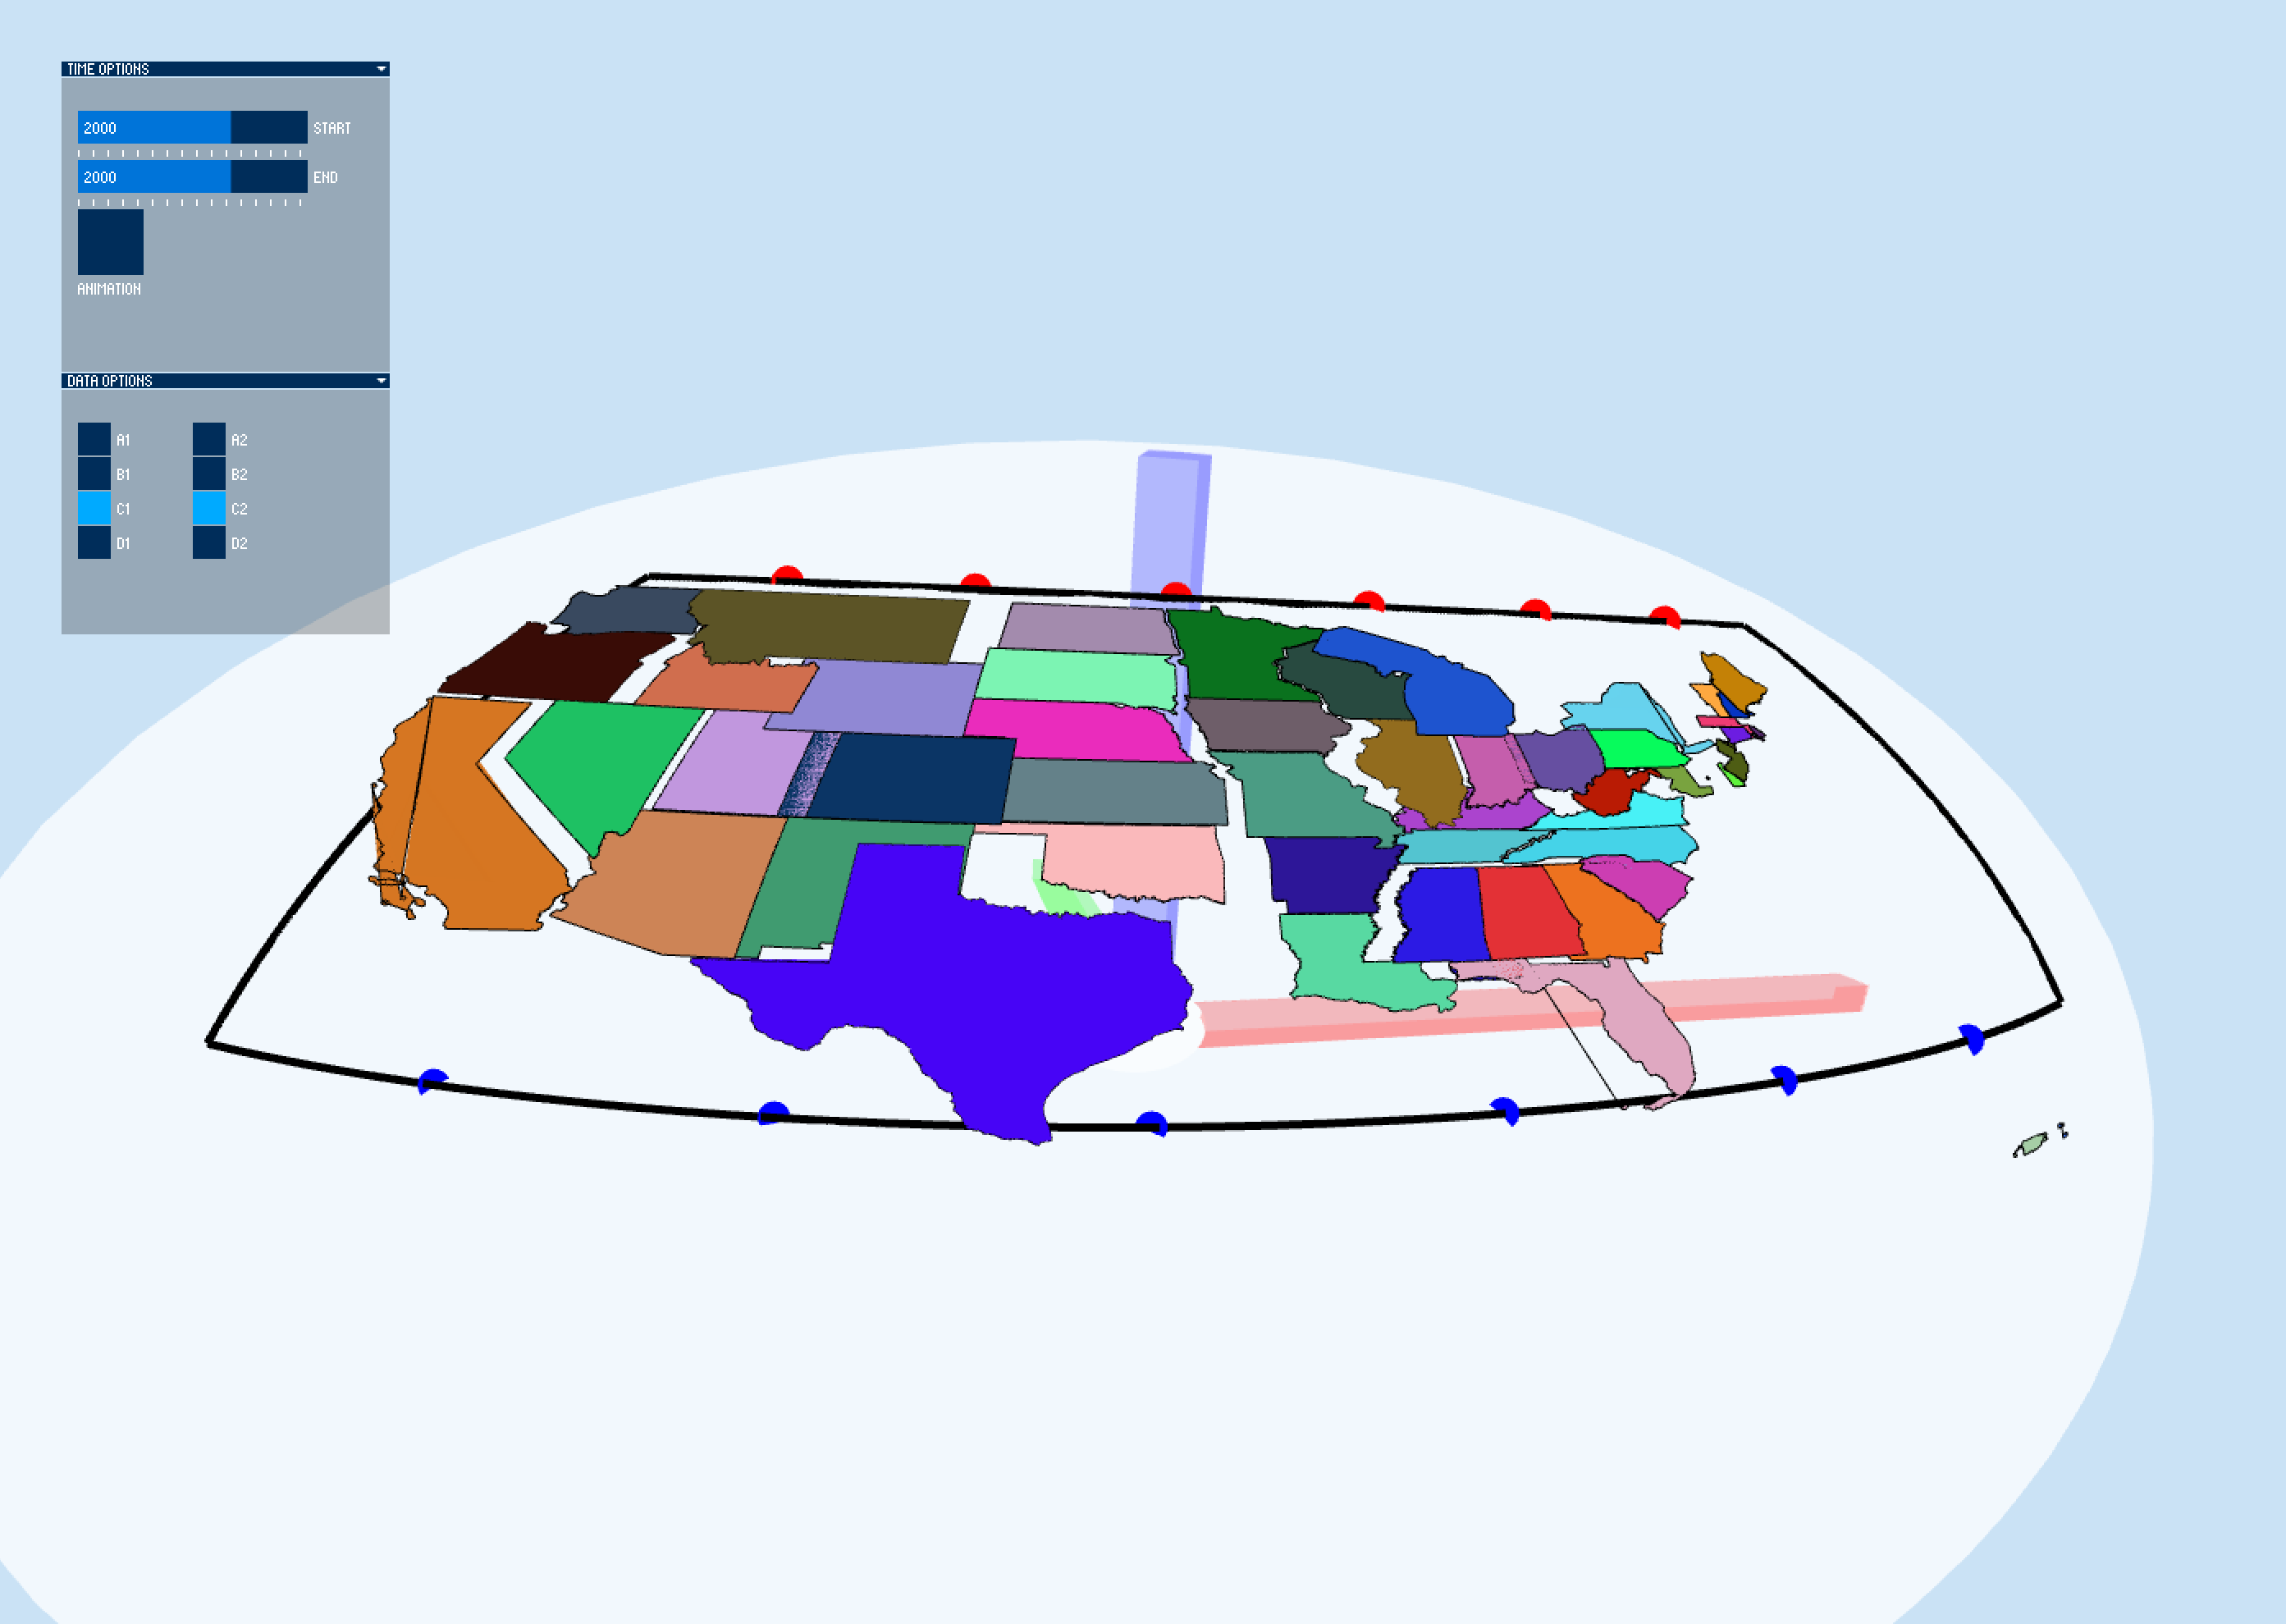
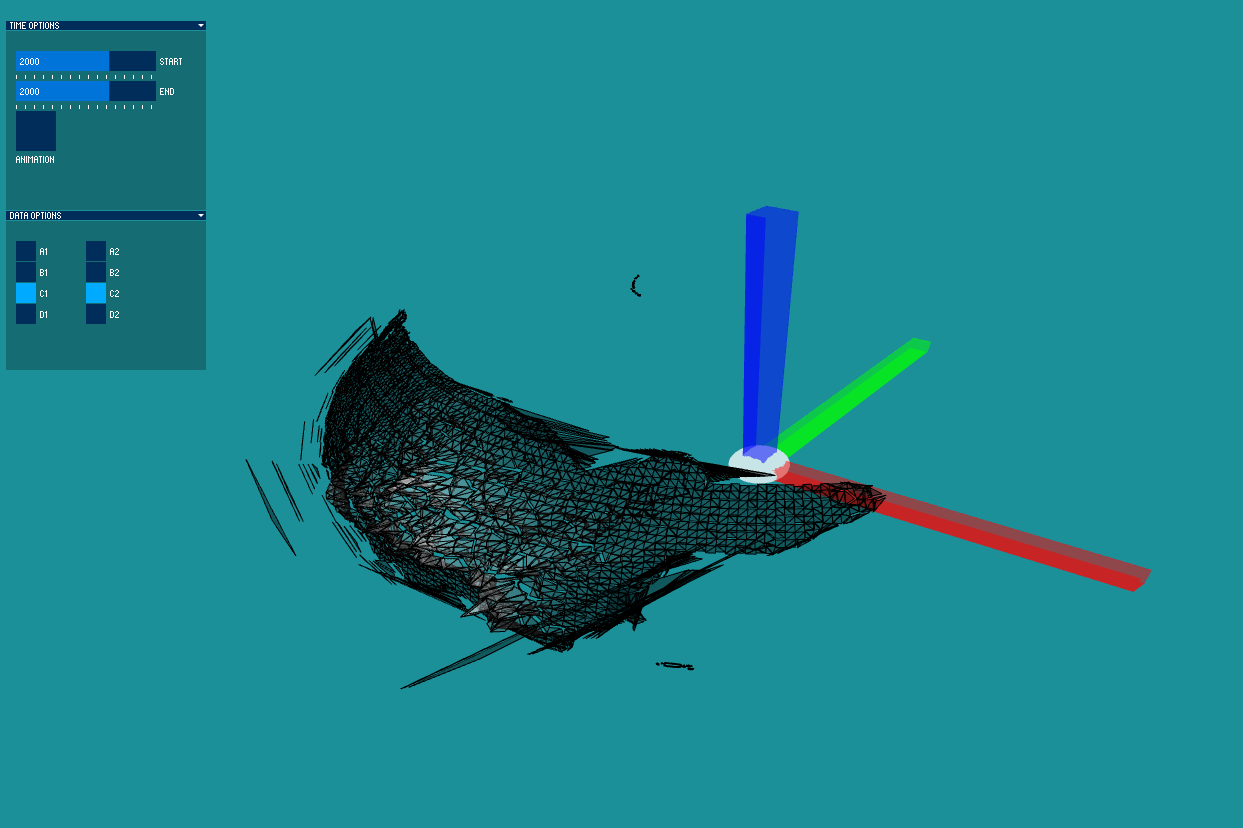
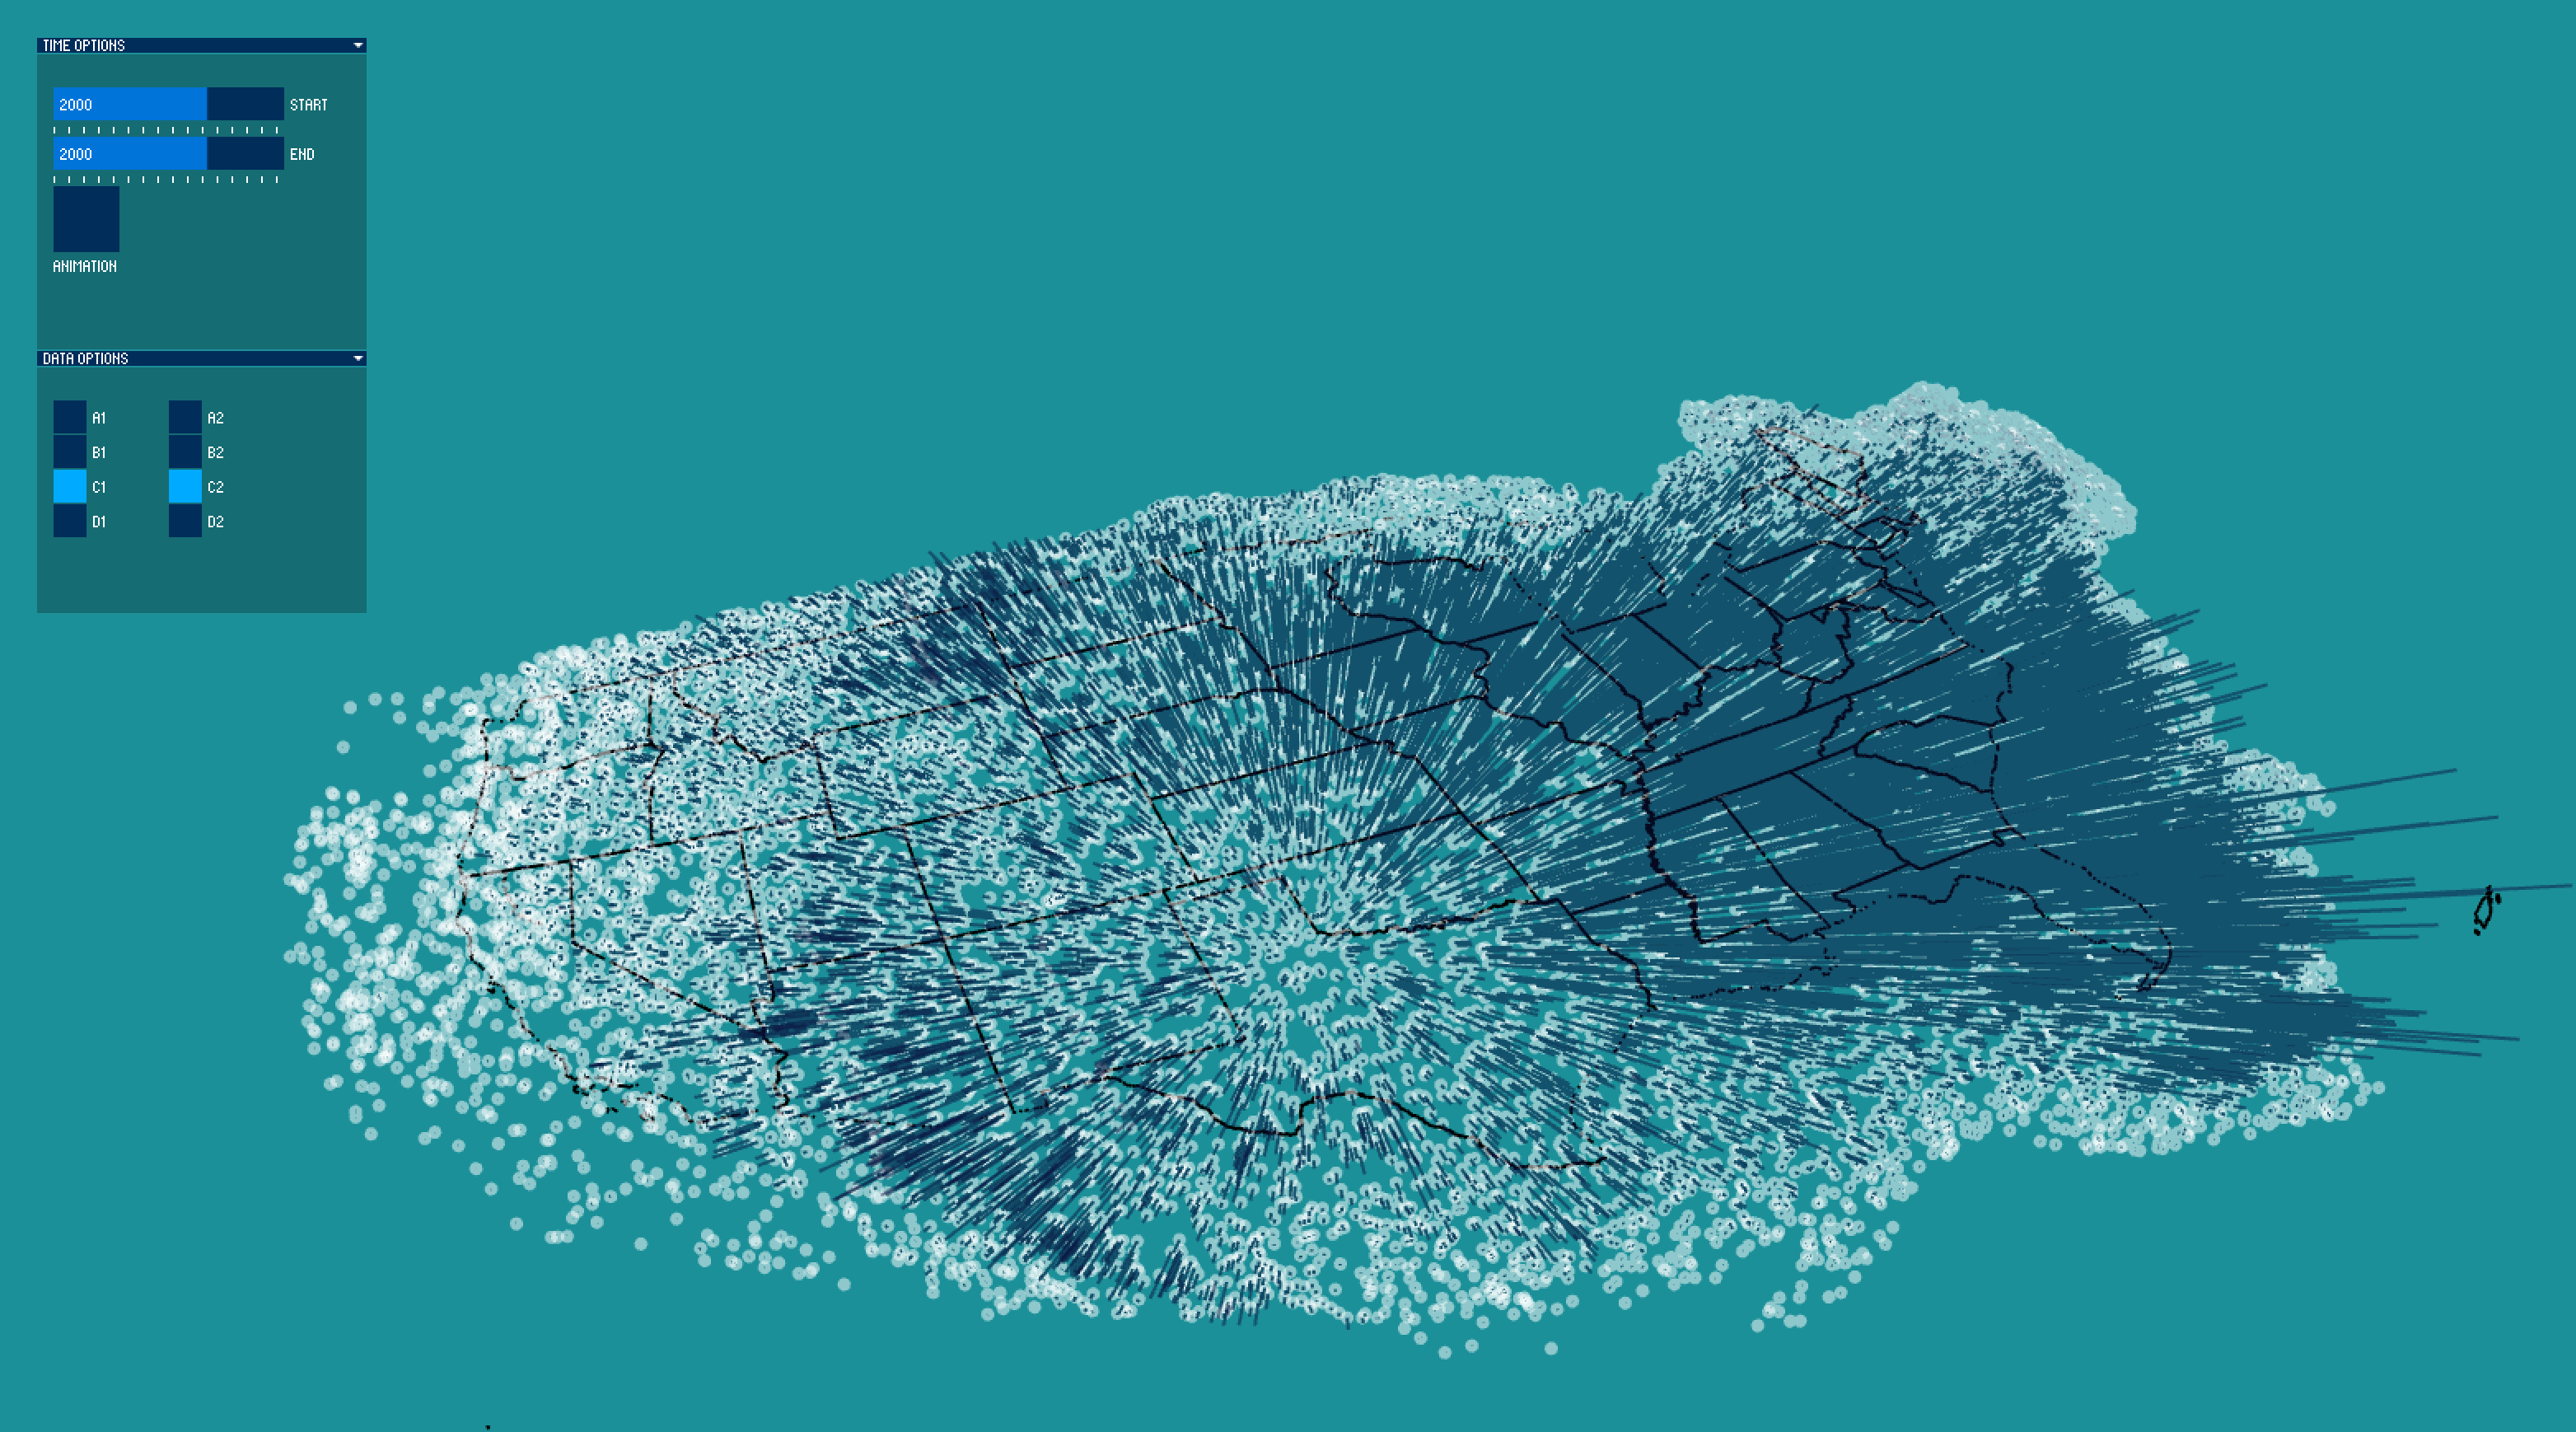
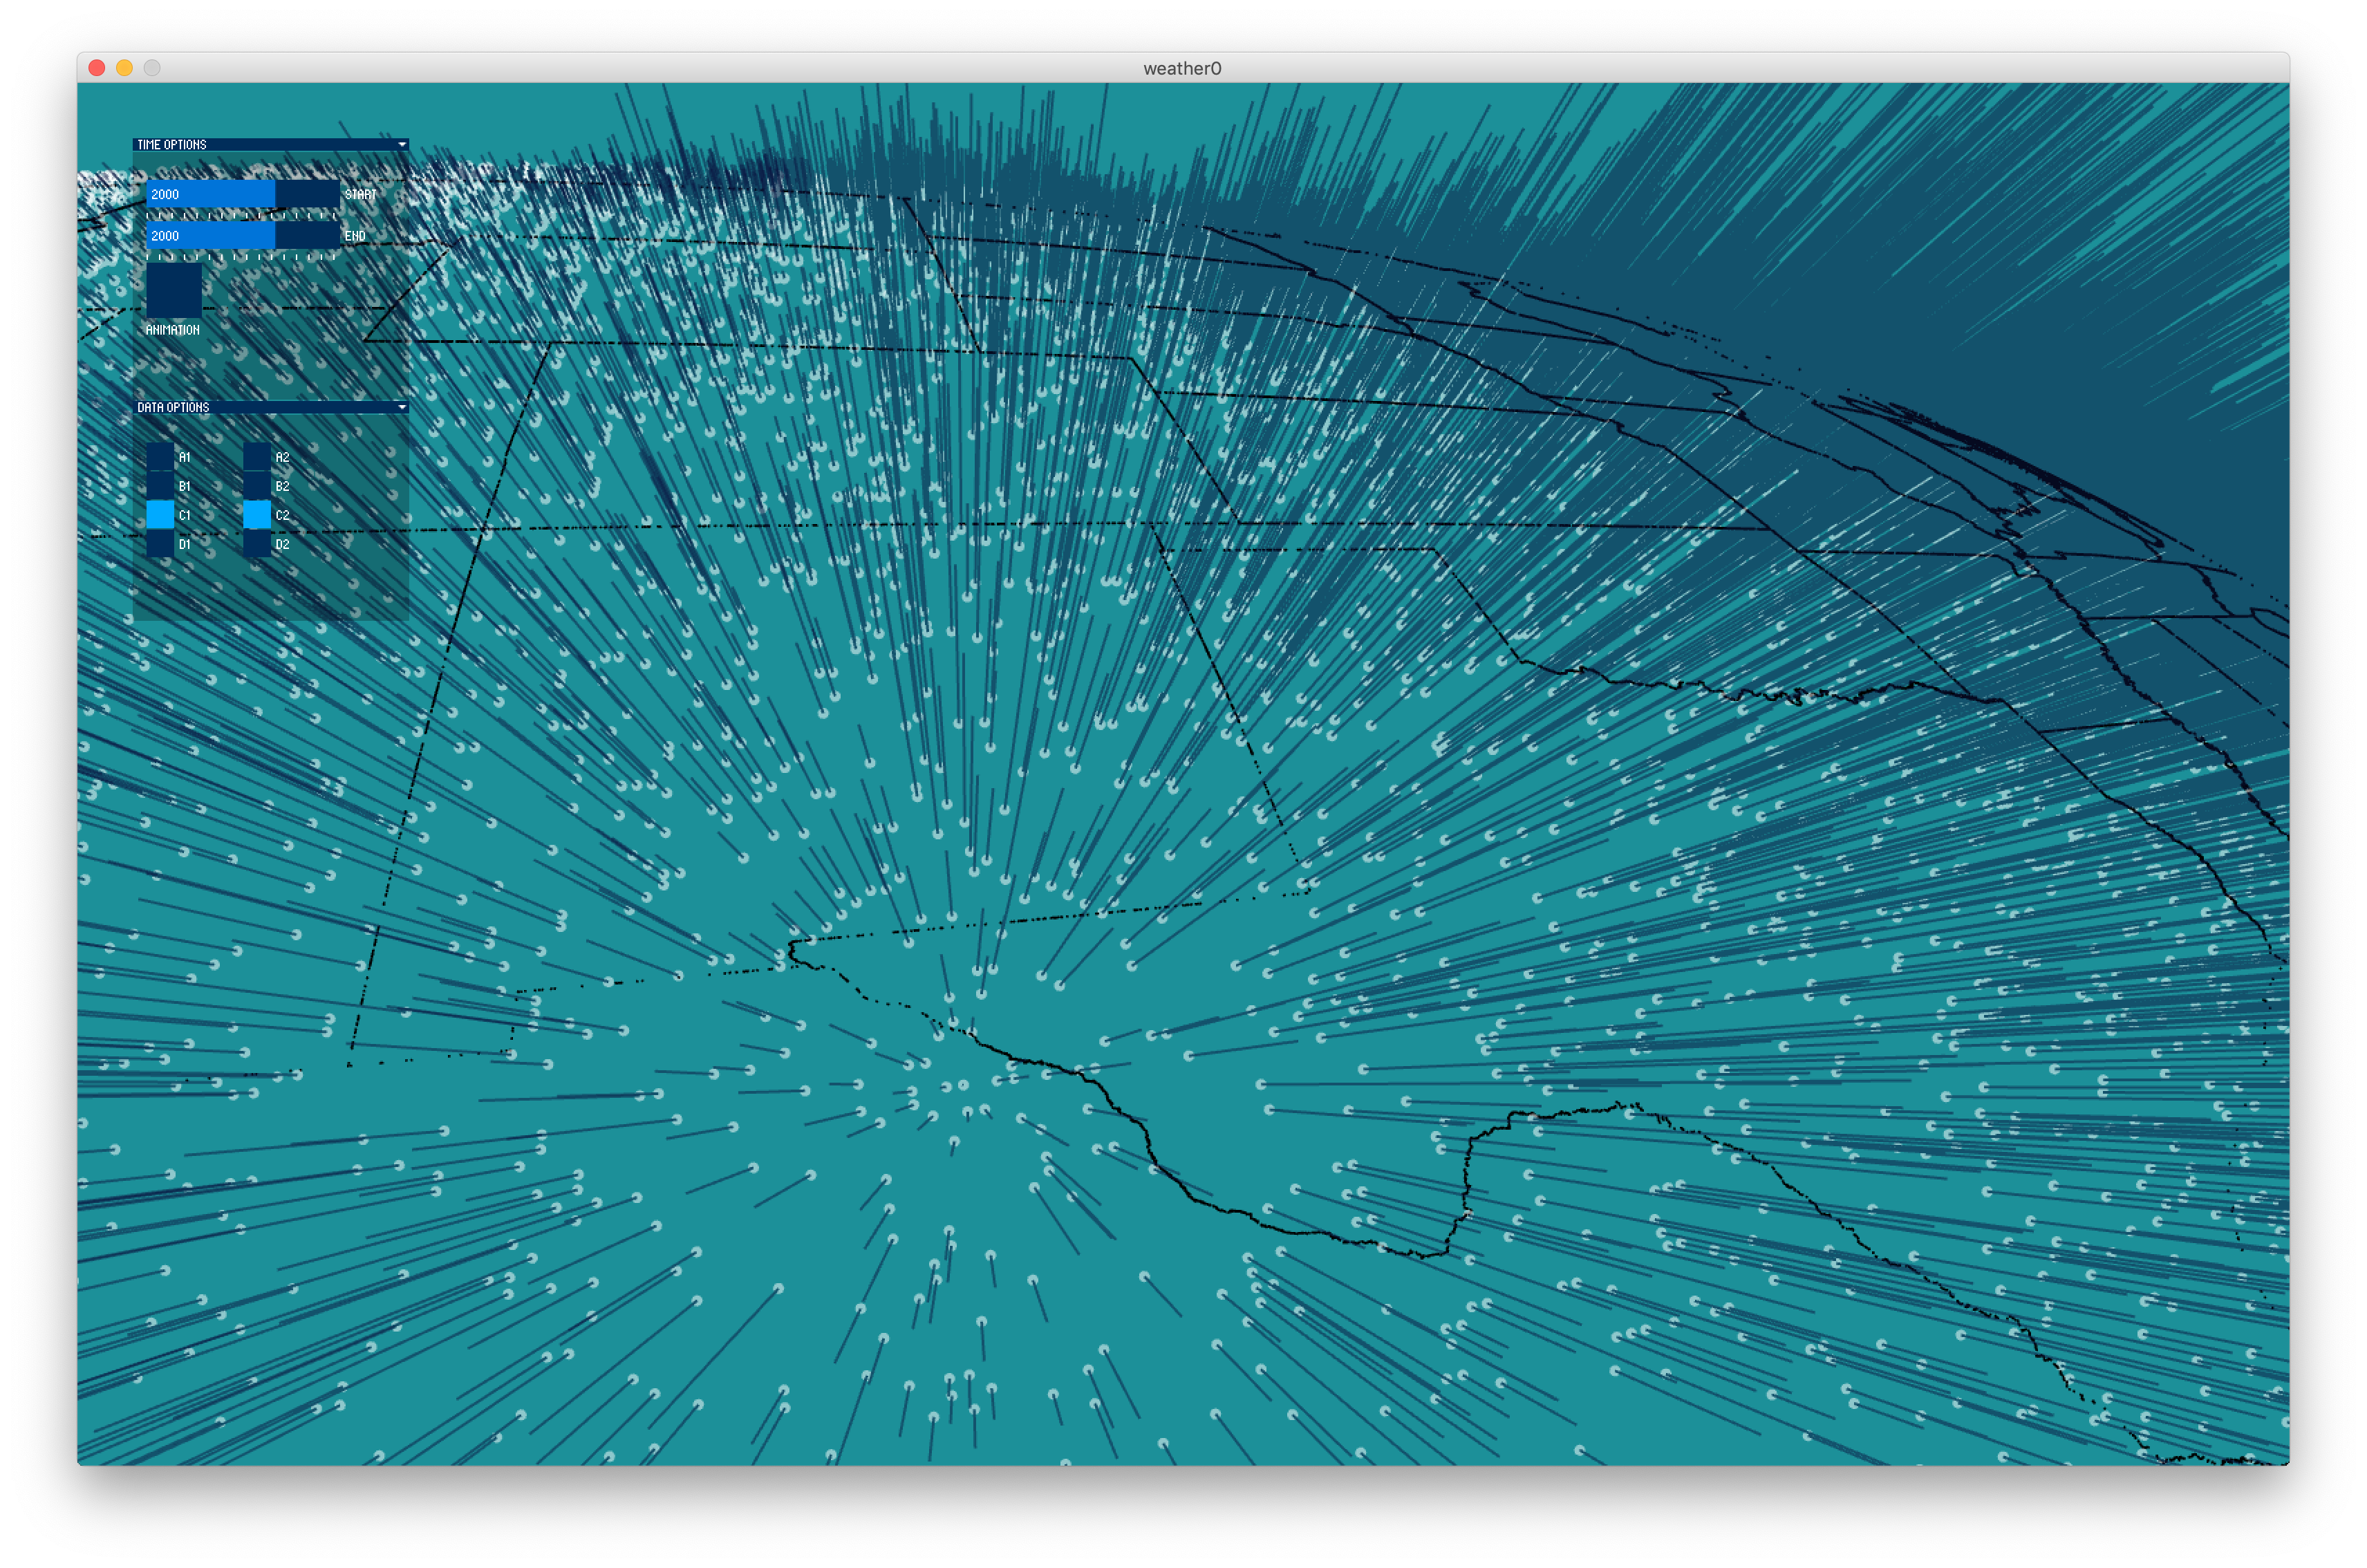
Here are some screenshots I took in the development process, which included troubleshooting the spherical coordinate system, and correctly mapping states to the surface. Originally the data was plotted as floating points, but that was later changed to the height-map.


Final result

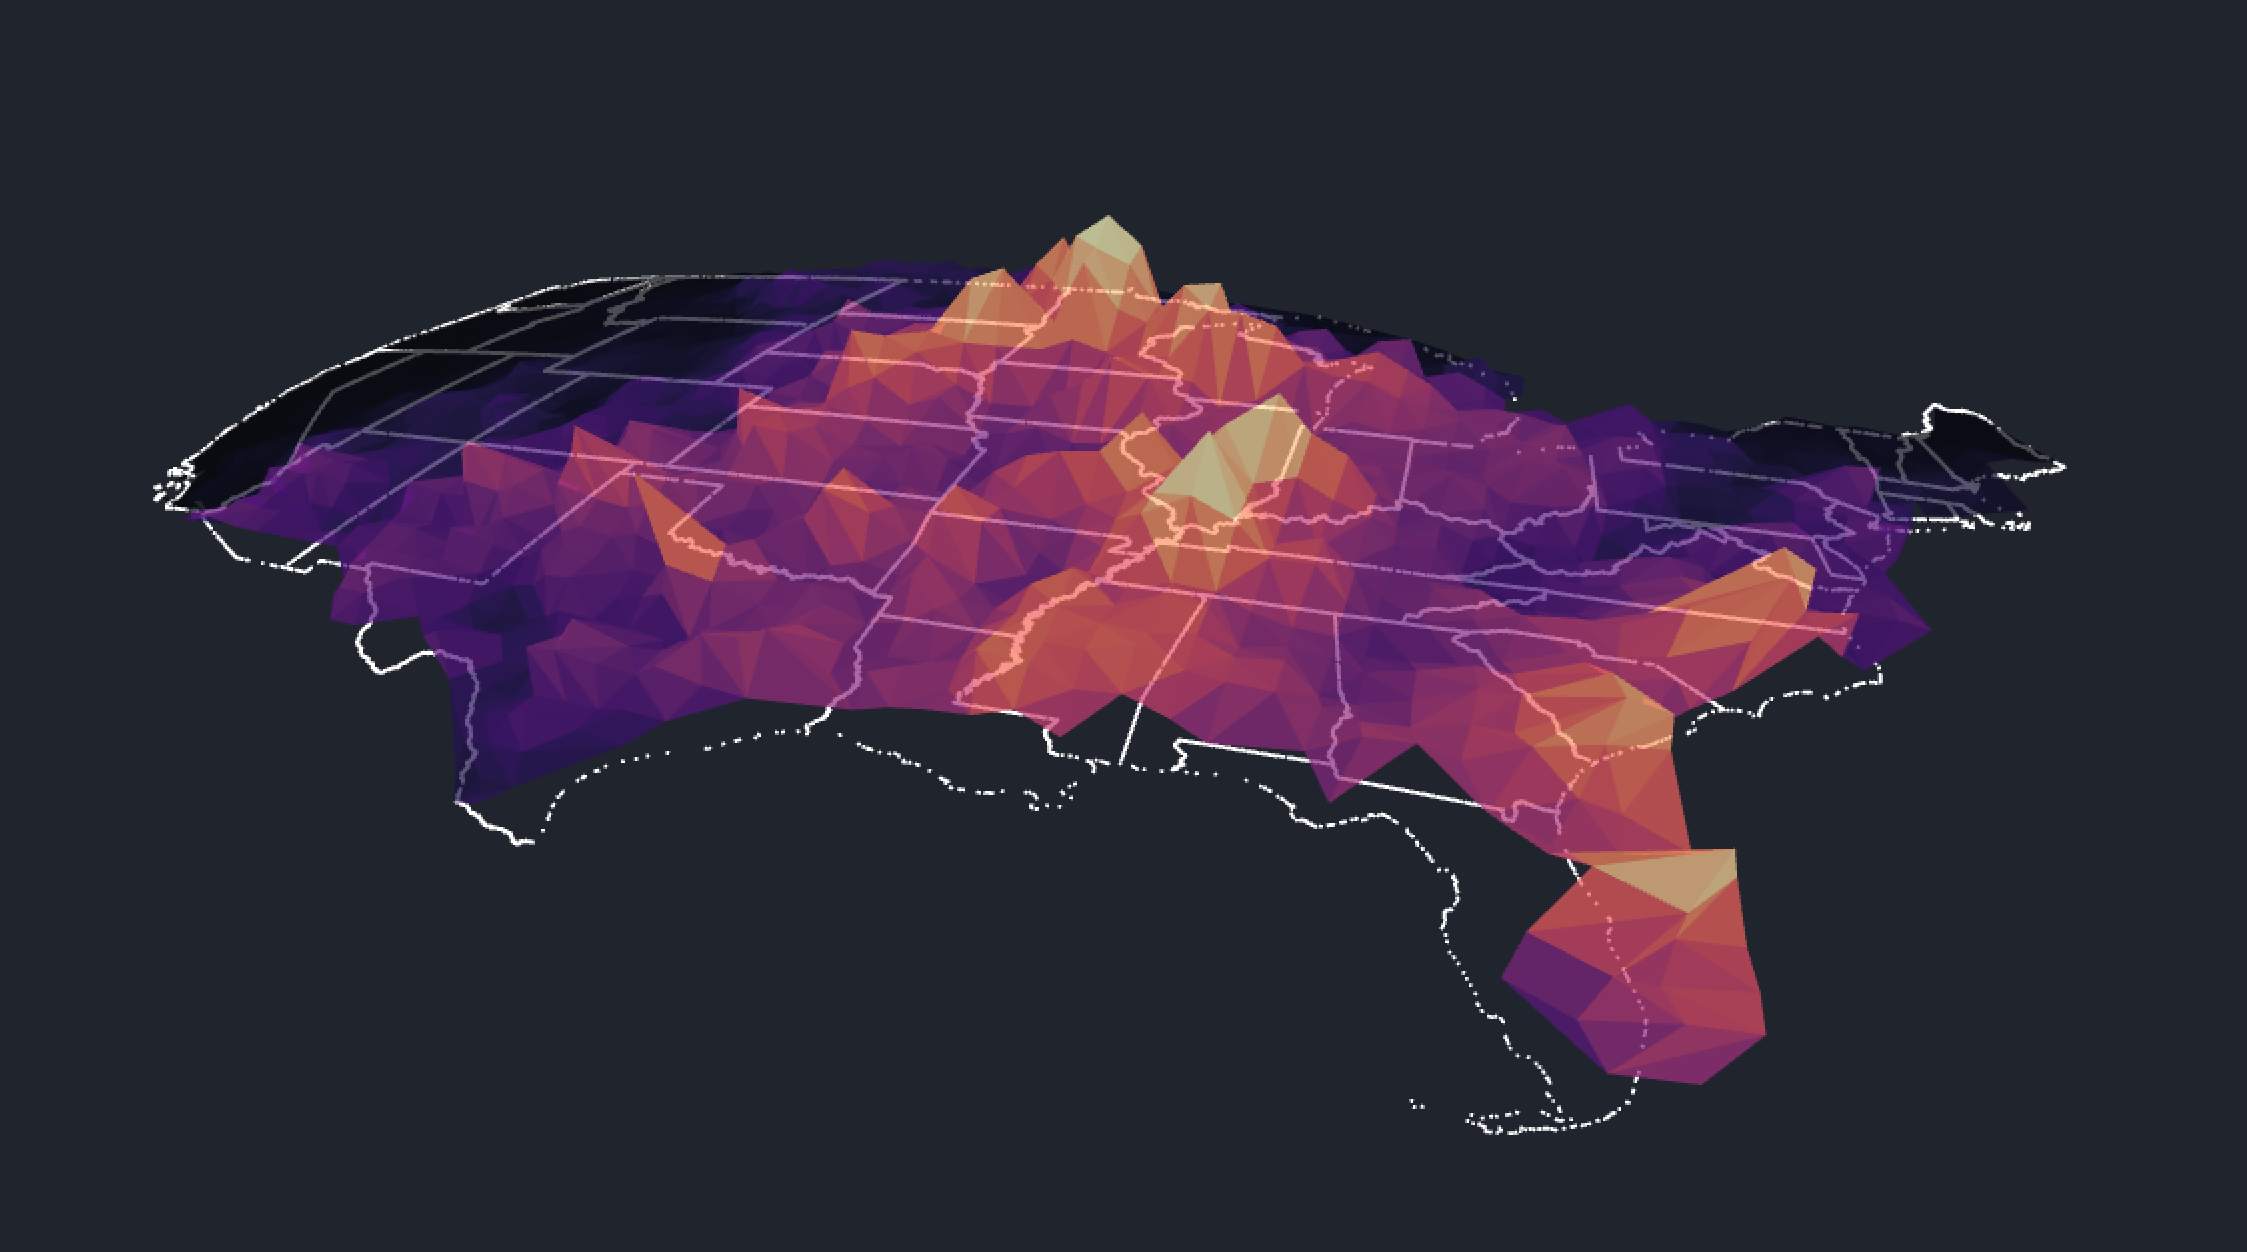
I am very happy with the final results, which show the lightning data from 2012. I experimented with coloring the height map based on the underlying state, but I think coloring the triangles by their average altitude looks better.


Code
All work is developed within Processing
Source Code + Data