3D Checkout Duration Visualisation
MAT 259, 2018
Wilson Mui
Concept
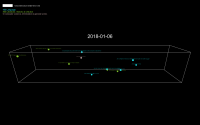
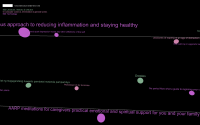
The idea behind this project was to create a visualization that can show the checkout time for the large Dewey categories. Multiple categories can be displayed alongside each other to compare. Data from all book and dvd checkouts between January 2018 - December 2018 is used. The code can be easily modified for longer queries. Each category has its own color. Books are shown as spheres and DVDs as cubes. The speed of the shapes is in relation to how quickly the book is returned. Changes in checkout duration of specified categories over time can be seen. Differences in checkout volume between categories is noticeable as well.
Entering 000, 100, ..., 900 will load and display all the books and DVDs checked out in the 12 month period belonging to the Dewey class. Multiple categories can be inputted for comparison.
Query
SELECT
DATE(cout) AS 'cout',
DATE(cin) AS 'cin',
itemtype,
deweyClass As 'class',
title
FROM
spl_2016.inraw
WHERE
YEAR(cout) = 2018
AND MONTH(cout) between 1 and 12
AND (itemType = "acbk" or itemType = "acdvd")
AND deweyClass != ''
ORDER BY date(cout) DESC
Final result
Please put your final images or screen shots here with some explanations.
Code