Language Learning Interest at Seattle Public Library
MAT 259, 2019
Meilin Shi
Concept
I’m interested in the checkouts within Dewey Class 400 – Language. For this project, I focused on 10 languages listed below and would like to see if there is a relative popularity in language learning at Seattle Public Library. To measure popularity, I used total checkouts number, average keeping time, and all checkout language related items from 2006 to 2018.
| Dewey | Language |
| 420 | English |
| 430 | German and related |
| 440 | French and related |
| 450 | Italian and related |
| 460 | Spanish and related |
| 491.7 | Russian |
| 492.7 | Arabic |
| 495.1 | Chinese |
| 495.6 | Japanese |
| 495.7 | Korean |
Query
Query #1 On total checkouts (27.002 sec)
SELECT
    YEAR(cout) AS years,
    MONTH(cout) AS months,
    COUNT(IF(deweyClass >= 420 AND deweyClass < 430,1,NULL)) AS 'English',
    COUNT(IF(deweyClass >= 430 AND deweyClass < 440,1,NULL)) AS 'German & related',
    COUNT(IF(deweyClass >= 440 AND deweyClass < 450,1,NULL)) AS 'French & related',
    COUNT(IF(deweyClass >= 450 AND deweyClass < 460,1,NULL)) AS 'Italian & related',
    COUNT(IF(deweyClass >= 460 AND deweyClass < 470,1,NULL)) AS 'Spanish & related',
    COUNT(IF(deweyClass >= 491.7 AND deweyClass < 491.8,1,NULL)) AS 'Russian',
    COUNT(IF(deweyClass >= 492.7 AND deweyClass < 492.8,1,NULL)) AS 'Arabic',
    COUNT(IF(deweyClass >= 495.1 AND deweyClass < 495.2,1,NULL)) AS 'Chinese',
    COUNT(IF(deweyClass >= 495.6 AND deweyClass < 495.7,1,NULL)) AS 'Japanese',
    COUNT(IF(deweyClass >= 495.7 AND deweyClass < 495.8,1,NULL)) AS 'Korean'
FROM
    spl_2016.outraw
WHERE
    deweyClass >= 420 AND deweyClass < 495.8
        AND YEAR(cout) BETWEEN 2006 AND 2018
GROUP BY MONTH(cout),YEAR(cout)
ORDER BY YEAR(cout), MONTH(cout);
SELECT
    class, years, months, AVG(TIMESTAMPDIFF(DAY, cout, cin)) AS AVG_TIME
FROM
    (SELECT
        SUBSTRING(deweyClass, 1, 5) AS class,
        #SUBSTRING(deweyClass, 1, 2) AS class, #for deweyClass 420 to 470
            YEAR(cout) AS years, MONTH(cout) AS months,
            cin,
            cout,
            TIMESTAMPDIFF(DAY, cout, cin)
    FROM
        spl_2016.inraw
    WHERE
        YEAR(cout) BETWEEN 2006 AND 2018
            AND TIMESTAMPDIFF(DAY, cout, cin) > 0
  #    AND deweyClass >= 420 AND deweyClass < 470
           AND (deweyClass >= 491.7 AND deweyClass < 491.8
             OR deweyClass >= 492.7 AND deweyClass < 492.8
             OR deweyClass >= 495.1 AND deweyClass < 495.2
             OR deweyClass >= 495.6 AND deweyClass < 495.7
             OR deweyClass >= 495.7 AND deweyClass < 495.8)
    GROUP BY years , months , class , cin , cout) AS aTable
GROUP BY class , years , months
SELECT
    title,itemtype,deweyClass,
    COUNT(title) AS Counts,
    COUNT(IF(YEAR(cout) = 2006, 1, NULL)) AS '2006',
    COUNT(IF(YEAR(cout) = 2007, 1, NULL)) AS '2007',
    COUNT(IF(YEAR(cout) = 2008, 1, NULL)) AS '2008',
    COUNT(IF(YEAR(cout) = 2009, 1, NULL)) AS '2009',
    COUNT(IF(YEAR(cout) = 2010, 1, NULL)) AS '2010',
    COUNT(IF(YEAR(cout) = 2011, 1, NULL)) AS '2011',
    COUNT(IF(YEAR(cout) = 2012, 1, NULL)) AS '2012',
    COUNT(IF(YEAR(cout) = 2013, 1, NULL)) AS '2013',
    COUNT(IF(YEAR(cout) = 2014, 1, NULL)) AS '2014',
    COUNT(IF(YEAR(cout) = 2015, 1, NULL)) AS '2015',
    COUNT(IF(YEAR(cout) = 2016, 1, NULL)) AS '2016',
    COUNT(IF(YEAR(cout) = 2017, 1, NULL)) AS '2017',
    COUNT(IF(YEAR(cout) = 2018, 1, NULL)) AS '2018'
FROM
    spl_2016.outraw
WHERE
    YEAR(cout) BETWEEN 2006 AND 2018
        AND (deweyClass >= 420 AND deweyClass < 470)
        OR (deweyClass >= 491.7 AND deweyClass < 491.8)
        OR (deweyClass >= 492.7 AND deweyClass < 492.8)
        OR (deweyClass >= 495.1 AND deweyClass < 495.2)
        OR (deweyClass >= 495.6 AND deweyClass < 495.8)
GROUP BY title , itemtype , deweyClass
ORDER BY COUNT(title) DESC
Process
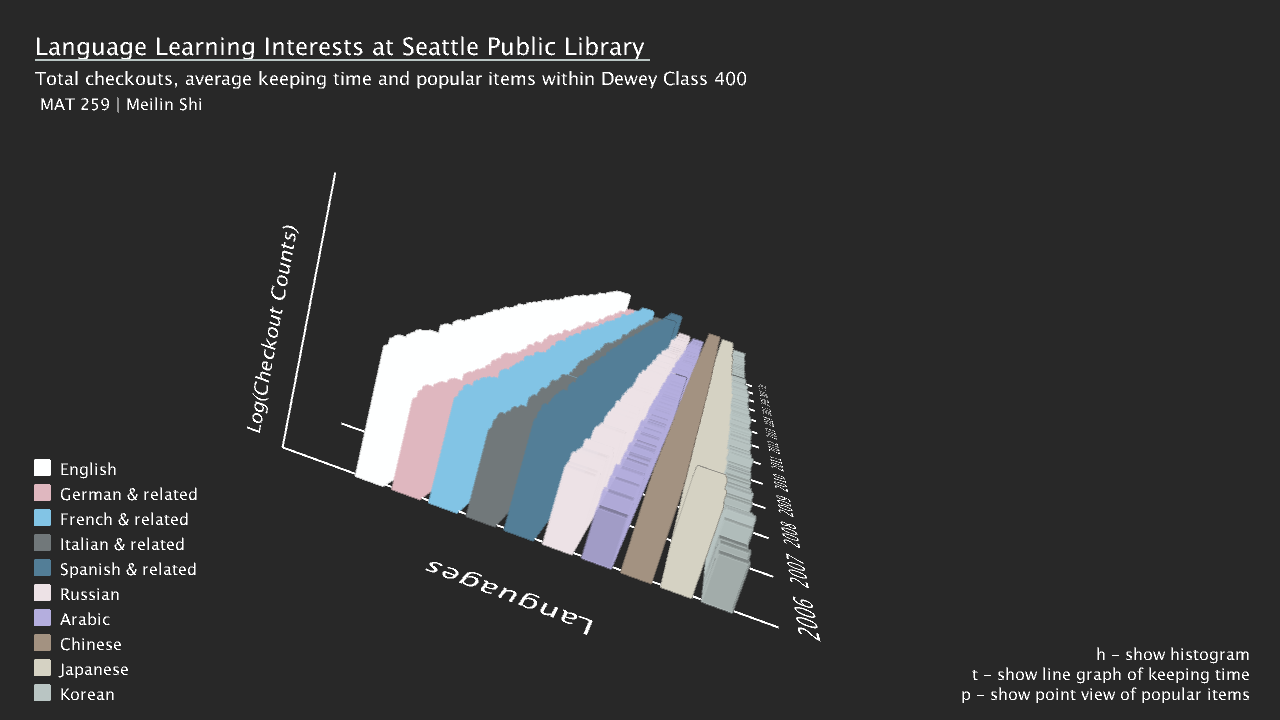
For the 3D histogram, I put time on x-axis, languages on y-axis and checkout counts on z-axis. Because the checkouts number for English and Spanish are way too high, (i.e. they went out of the screen), I used log scale to show the numbers at this time. As we can see from the screenshot, there is not much variation within each language because of the log scale, but we can still see variation across languages.
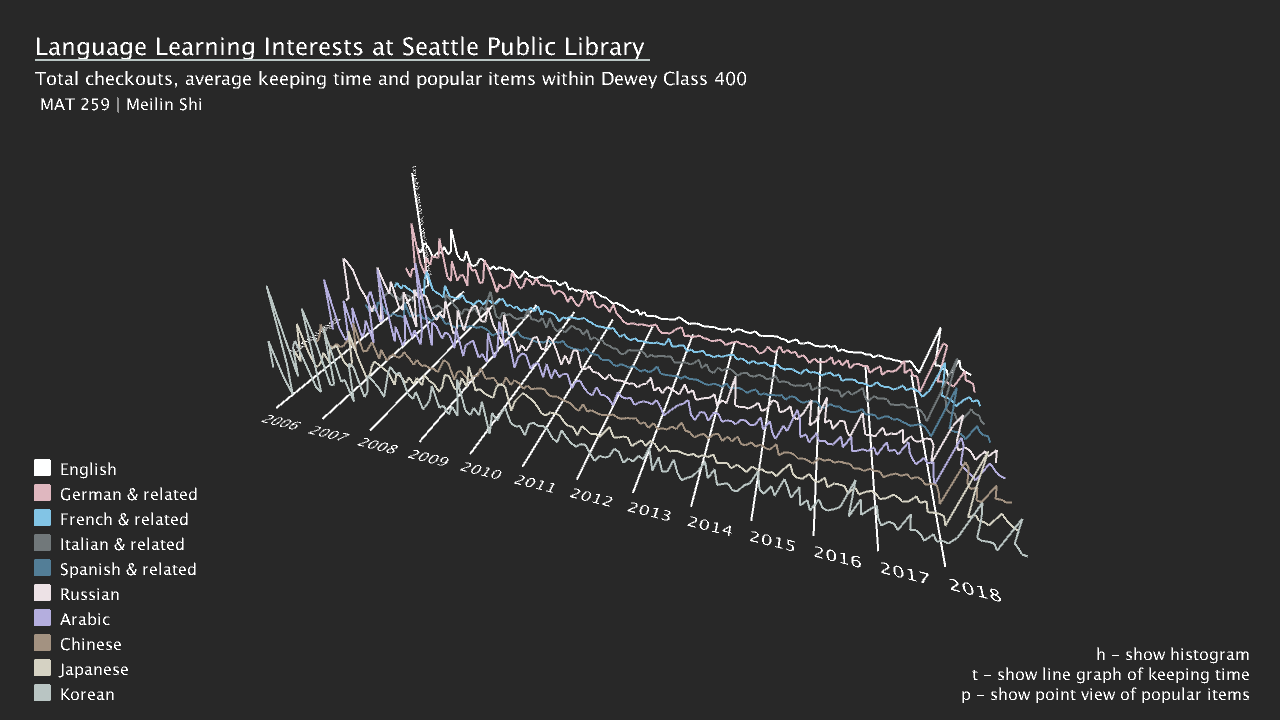
Keepting time is shown as a line graph, time on x-axis, languages on y-axis and keeping time (in days) on z-axis. One thing to be noticed is the peak around January and Feburary 2018. And the pattern is same for all languages. I found out from my checkouts query that Jan and Feb 2018 data were missing. But in the keeping time query they are not, and the numbers are big (50-70 days) compared to the nearby months (10-30 days). I guess it is either because of the library closure or the library system went wrong at that time.
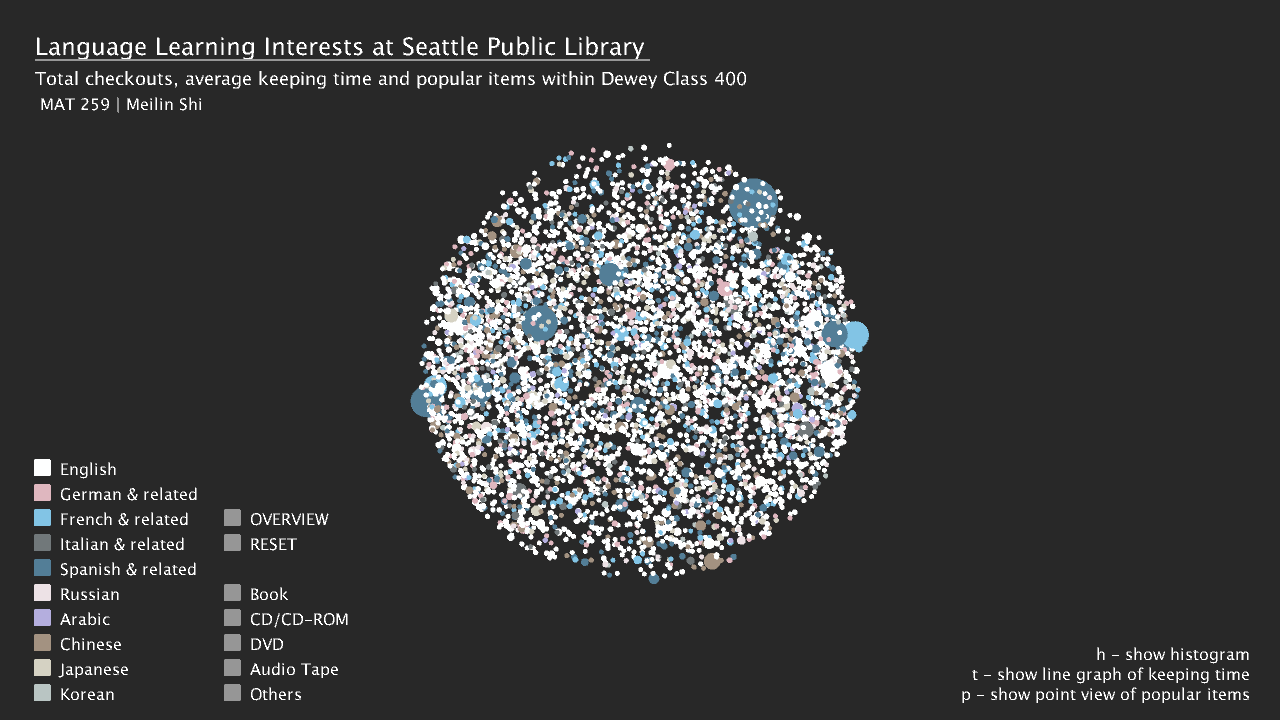
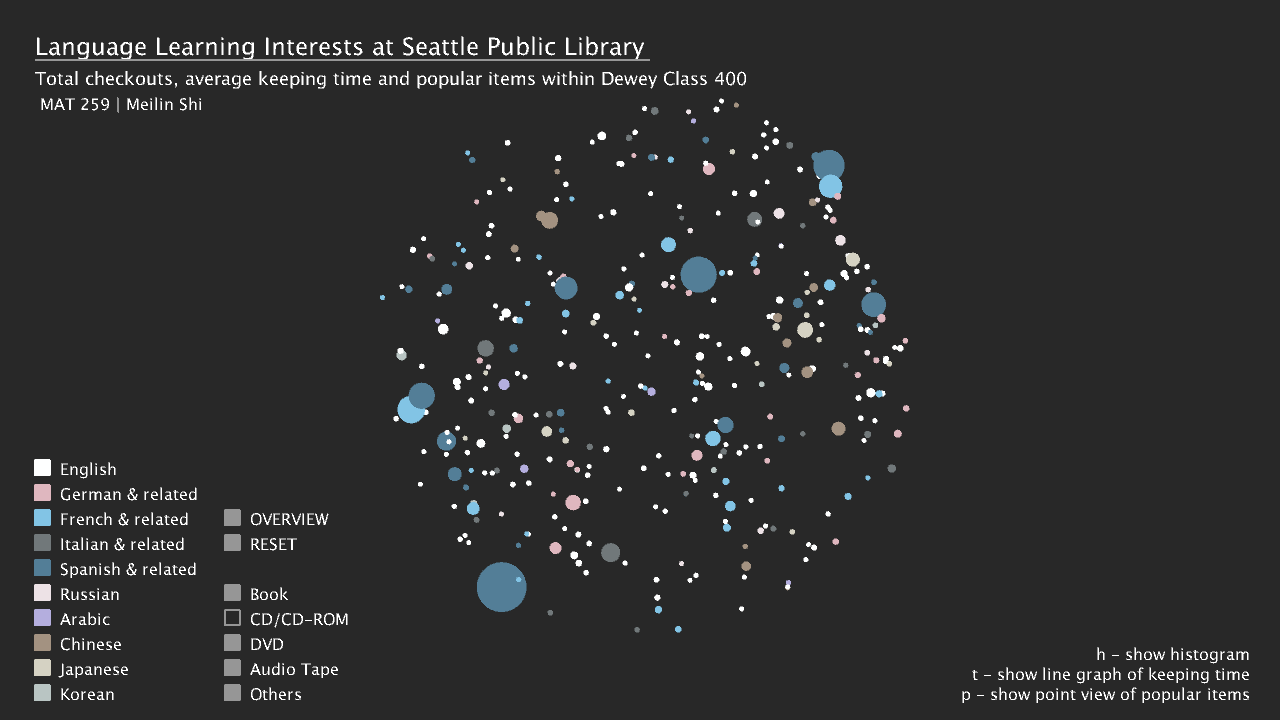
I also did a point cloud of all checkout items within these languages and map their checkout counts as the size of the point. All items are grouped by language or item type.
Keepting time is shown as a line graph, time on x-axis, languages on y-axis and keeping time (in days) on z-axis. One thing to be noticed is the peak around January and Feburary 2018. And the pattern is same for all languages. I found out from my checkouts query that Jan and Feb 2018 data were missing. But in the keeping time query they are not, and the numbers are big (50-70 days) compared to the nearby months (10-30 days). I guess it is either because of the library closure or the library system went wrong at that time.
I also did a point cloud of all checkout items within these languages and map their checkout counts as the size of the point. All items are grouped by language or item type.
Final result
The legend buttons can be clicked to see the checkout items within each language or each item type.The majority of checkout item type are books. Interesting to see that the bigger dots (longer keeping time) are CD/CD-ROM items.
Code