Checkout changes by weekday and day of the year
MAT 259, 2019
Sandy Schoettler
Concept
Every checkout of a particular item type (say DVDs or books) has an associated week number (the week of the year) and a day of the week (Monday through Sunday). This visualization compares the relative checkout activity on corresponding days of the week, and days of the year, for either books, or for dvds/movies.
Query
SELECT tslice, weekNum, yr-2010 as yearNum, 0 as itemType, count(*) as qty
FROM (SELECT checkout,
itemtype,
week(checkout,5) as weekNum,
(Weekday(checkout) * 24*4) + floor(Hour(checkout) * 4 + (Minute(checkout)/15)) AS tslice,
year(checkout) as yr
FROM transactions,
itemType
WHERE checkout BETWEEN '2016-01-01' AND '2019-01-01'
AND transactions.itemnumber = itemType.itemnumber) sample
WHERE tslice != 0
AND ( itemtype = 'acbk'
OR itemtype = 'arbk'
OR itemtype = 'bcbk'
OR itemtype = 'drbk'
OR itemtype = 'jcbk'
OR itemtype = 'jrbk' )
GROUP BY tslice, weeknum, yearNum, itemType;
Query Variations
-- DVD / VIDEO
-- change line 1 to include "1 as itemType"
-- AND ( itemtype = 'acdvd'
--     OR itemtype = 'ardvd'
--     OR itemtype = 'bcdvd'
--     OR itemtype = 'drdvd'
--     OR itemtype = 'jcdvd'
--     OR itemtype = 'jrdvd'
--     OR itemtype = 'scmed')

-- BOOKS
-- change line 1 to include "0 as itemType"
--    AND ( itemtype = 'acbk'
--           OR itemtype = 'arbk'
--           OR itemtype = 'bcbk'
--           OR itemtype = 'drbk'
--           OR itemtype = 'jcbk'
--           OR itemtype = 'jrbk' )
Process
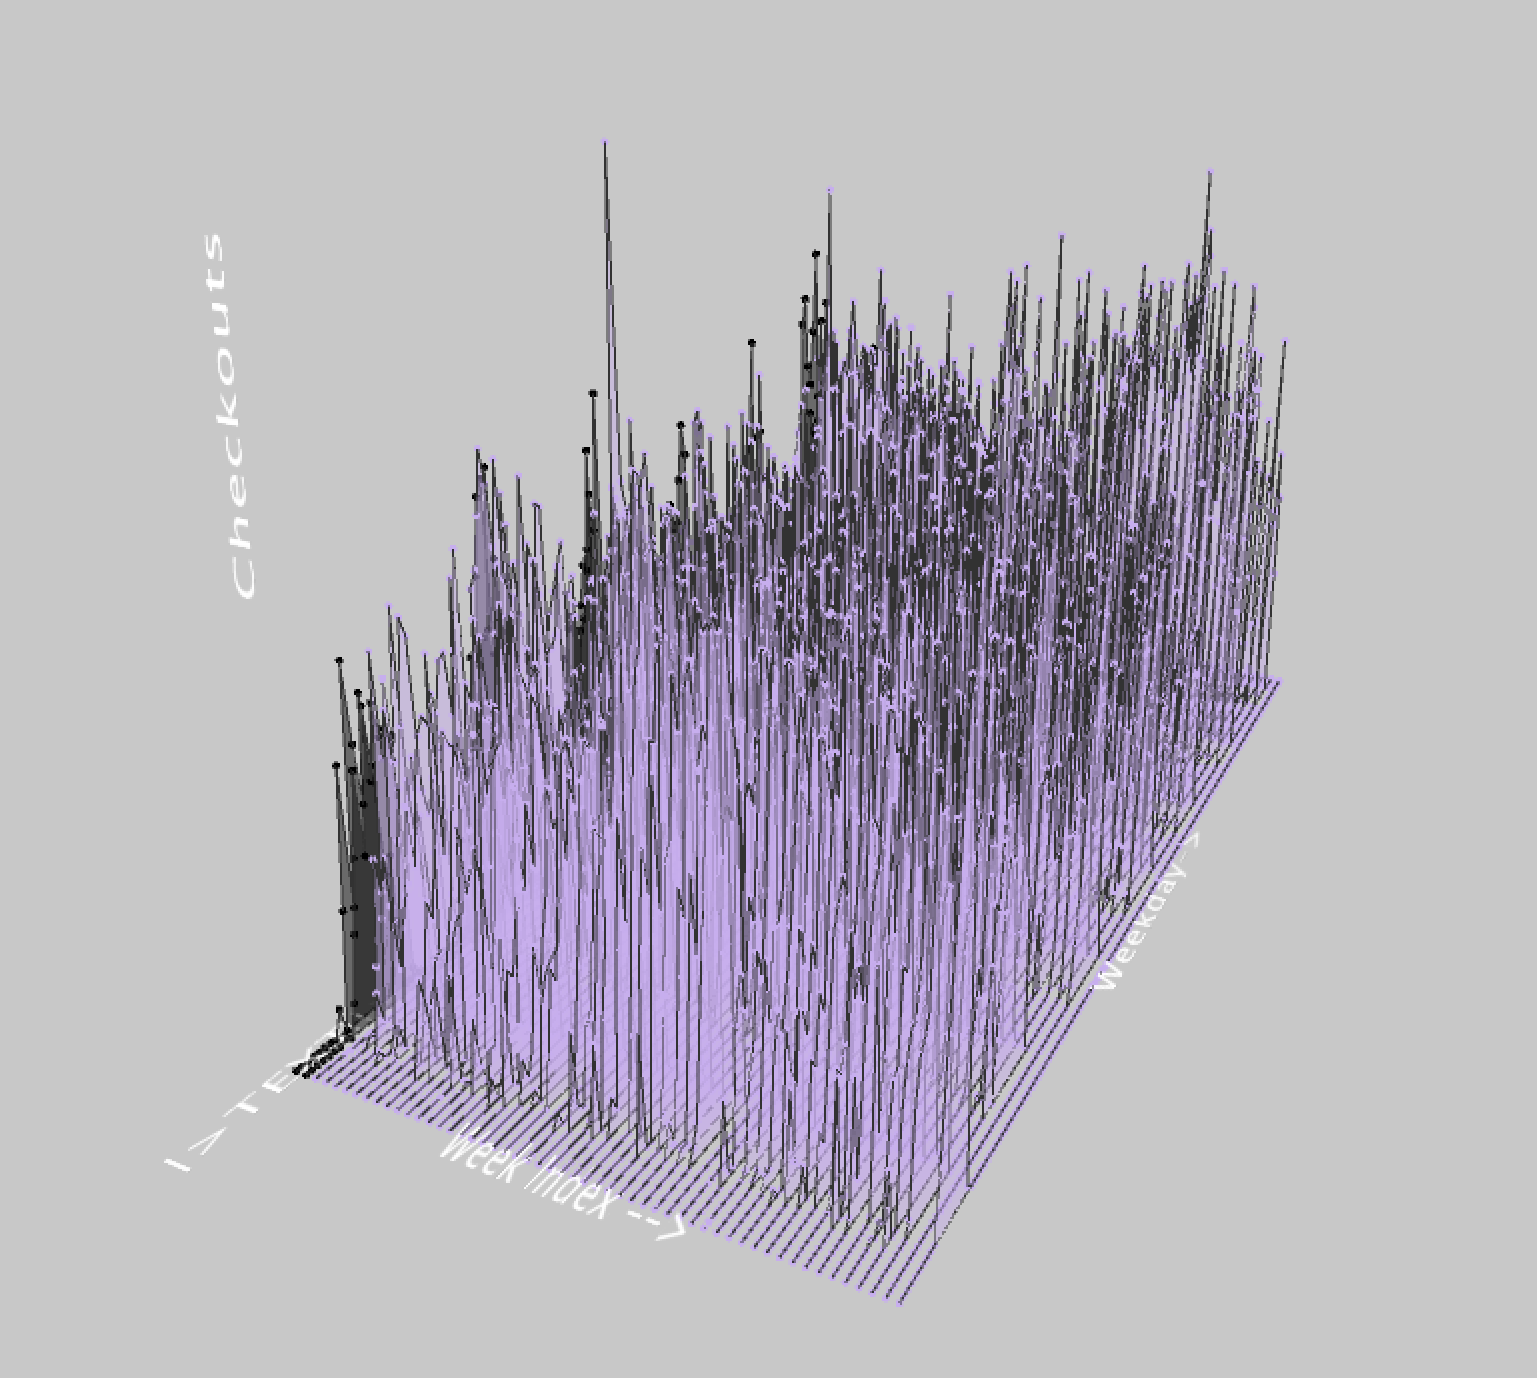
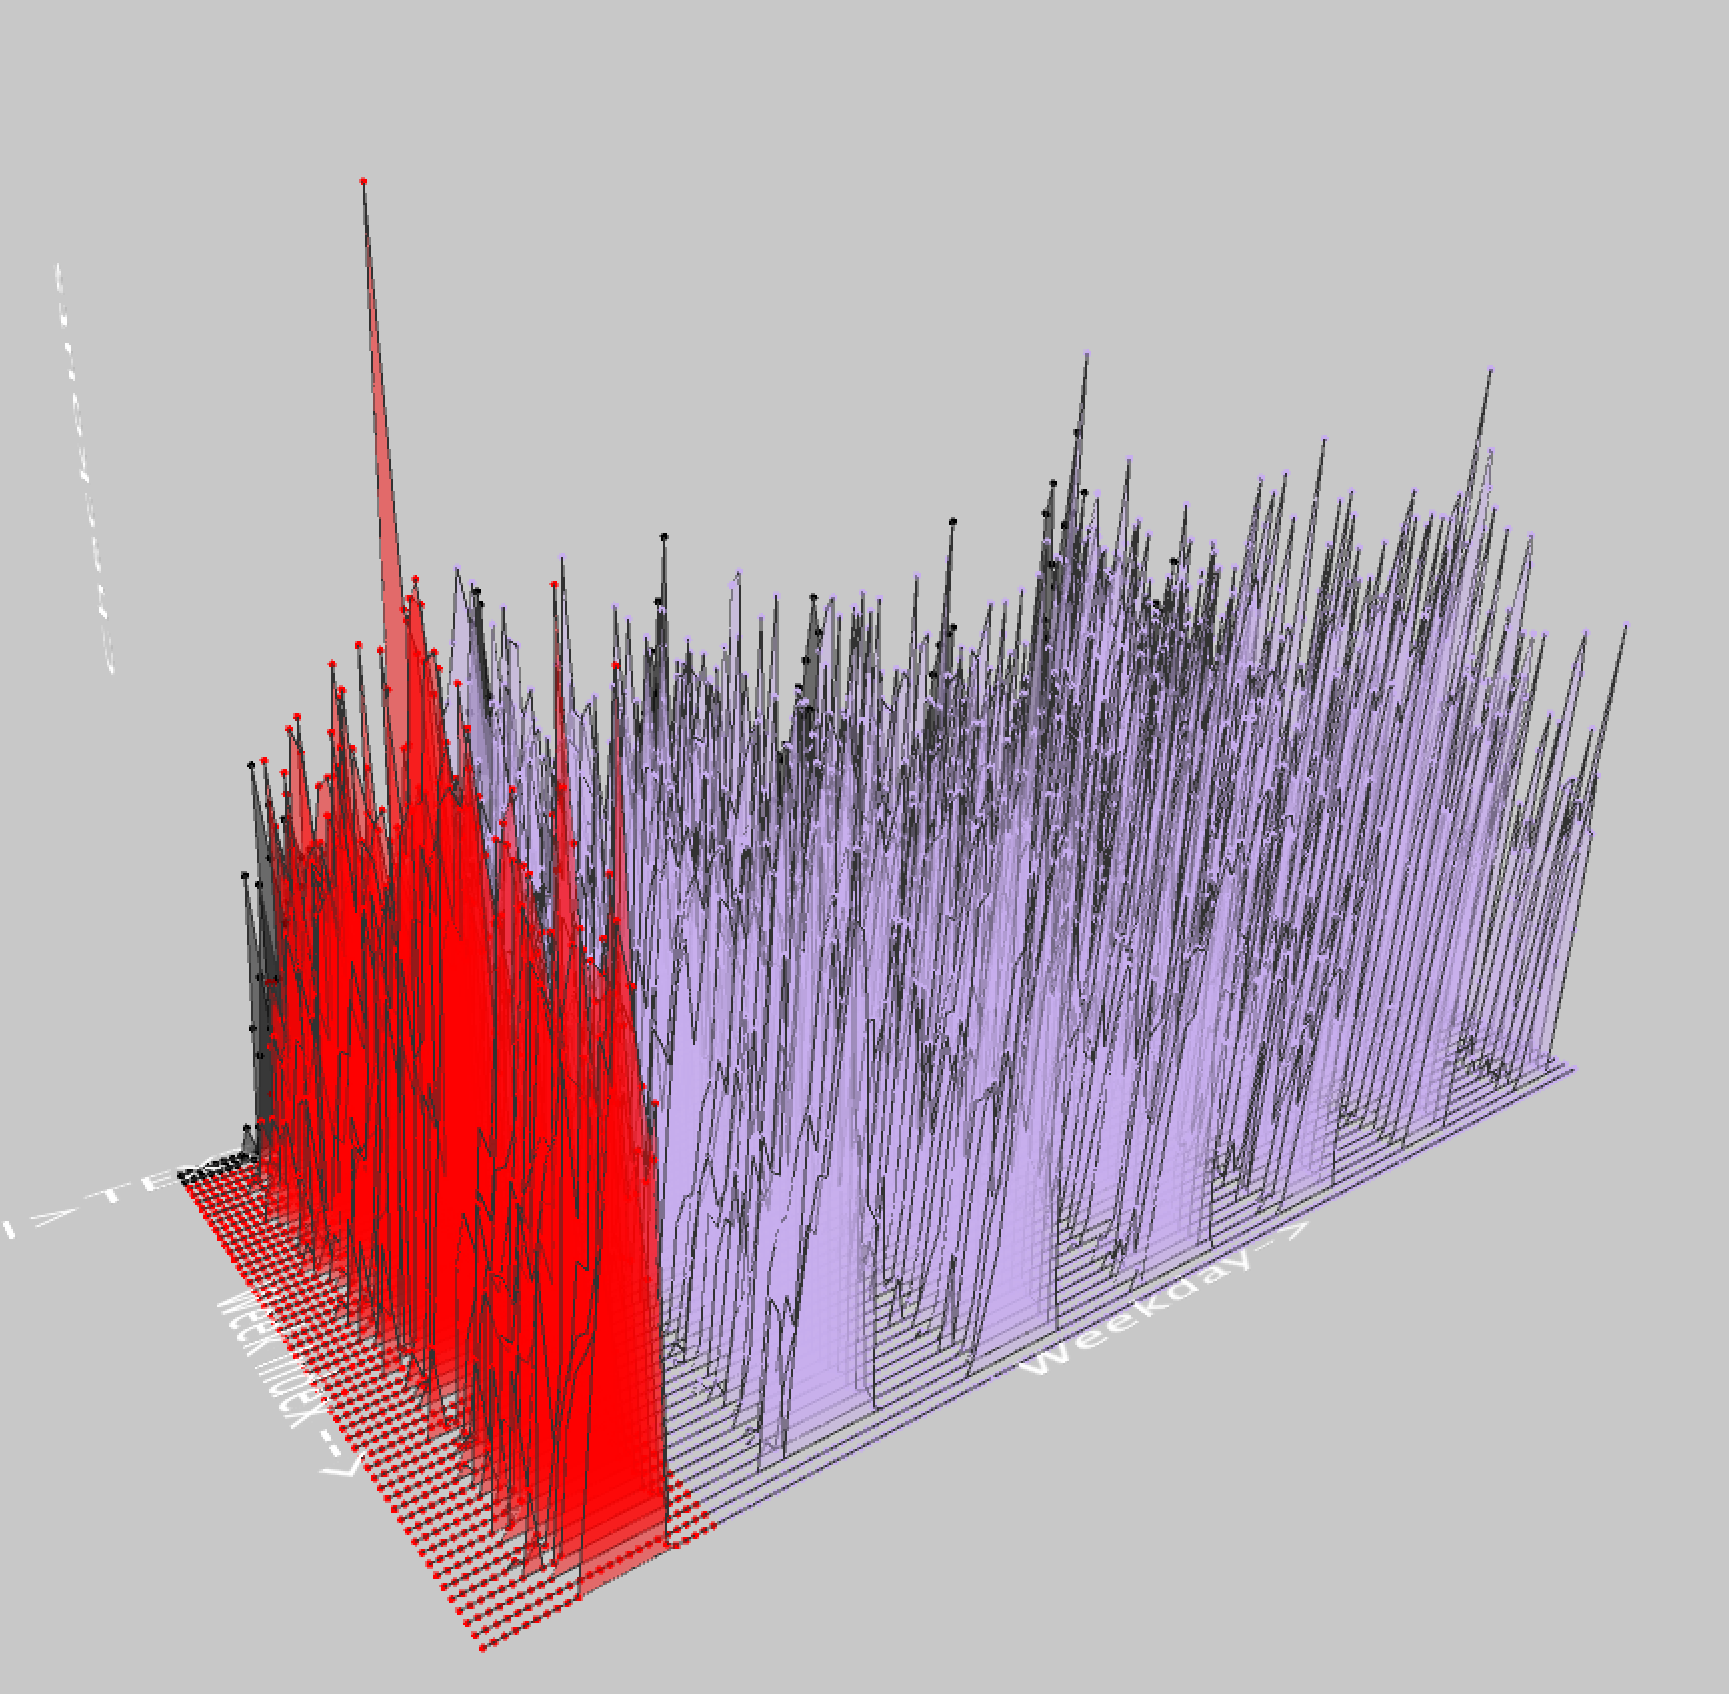
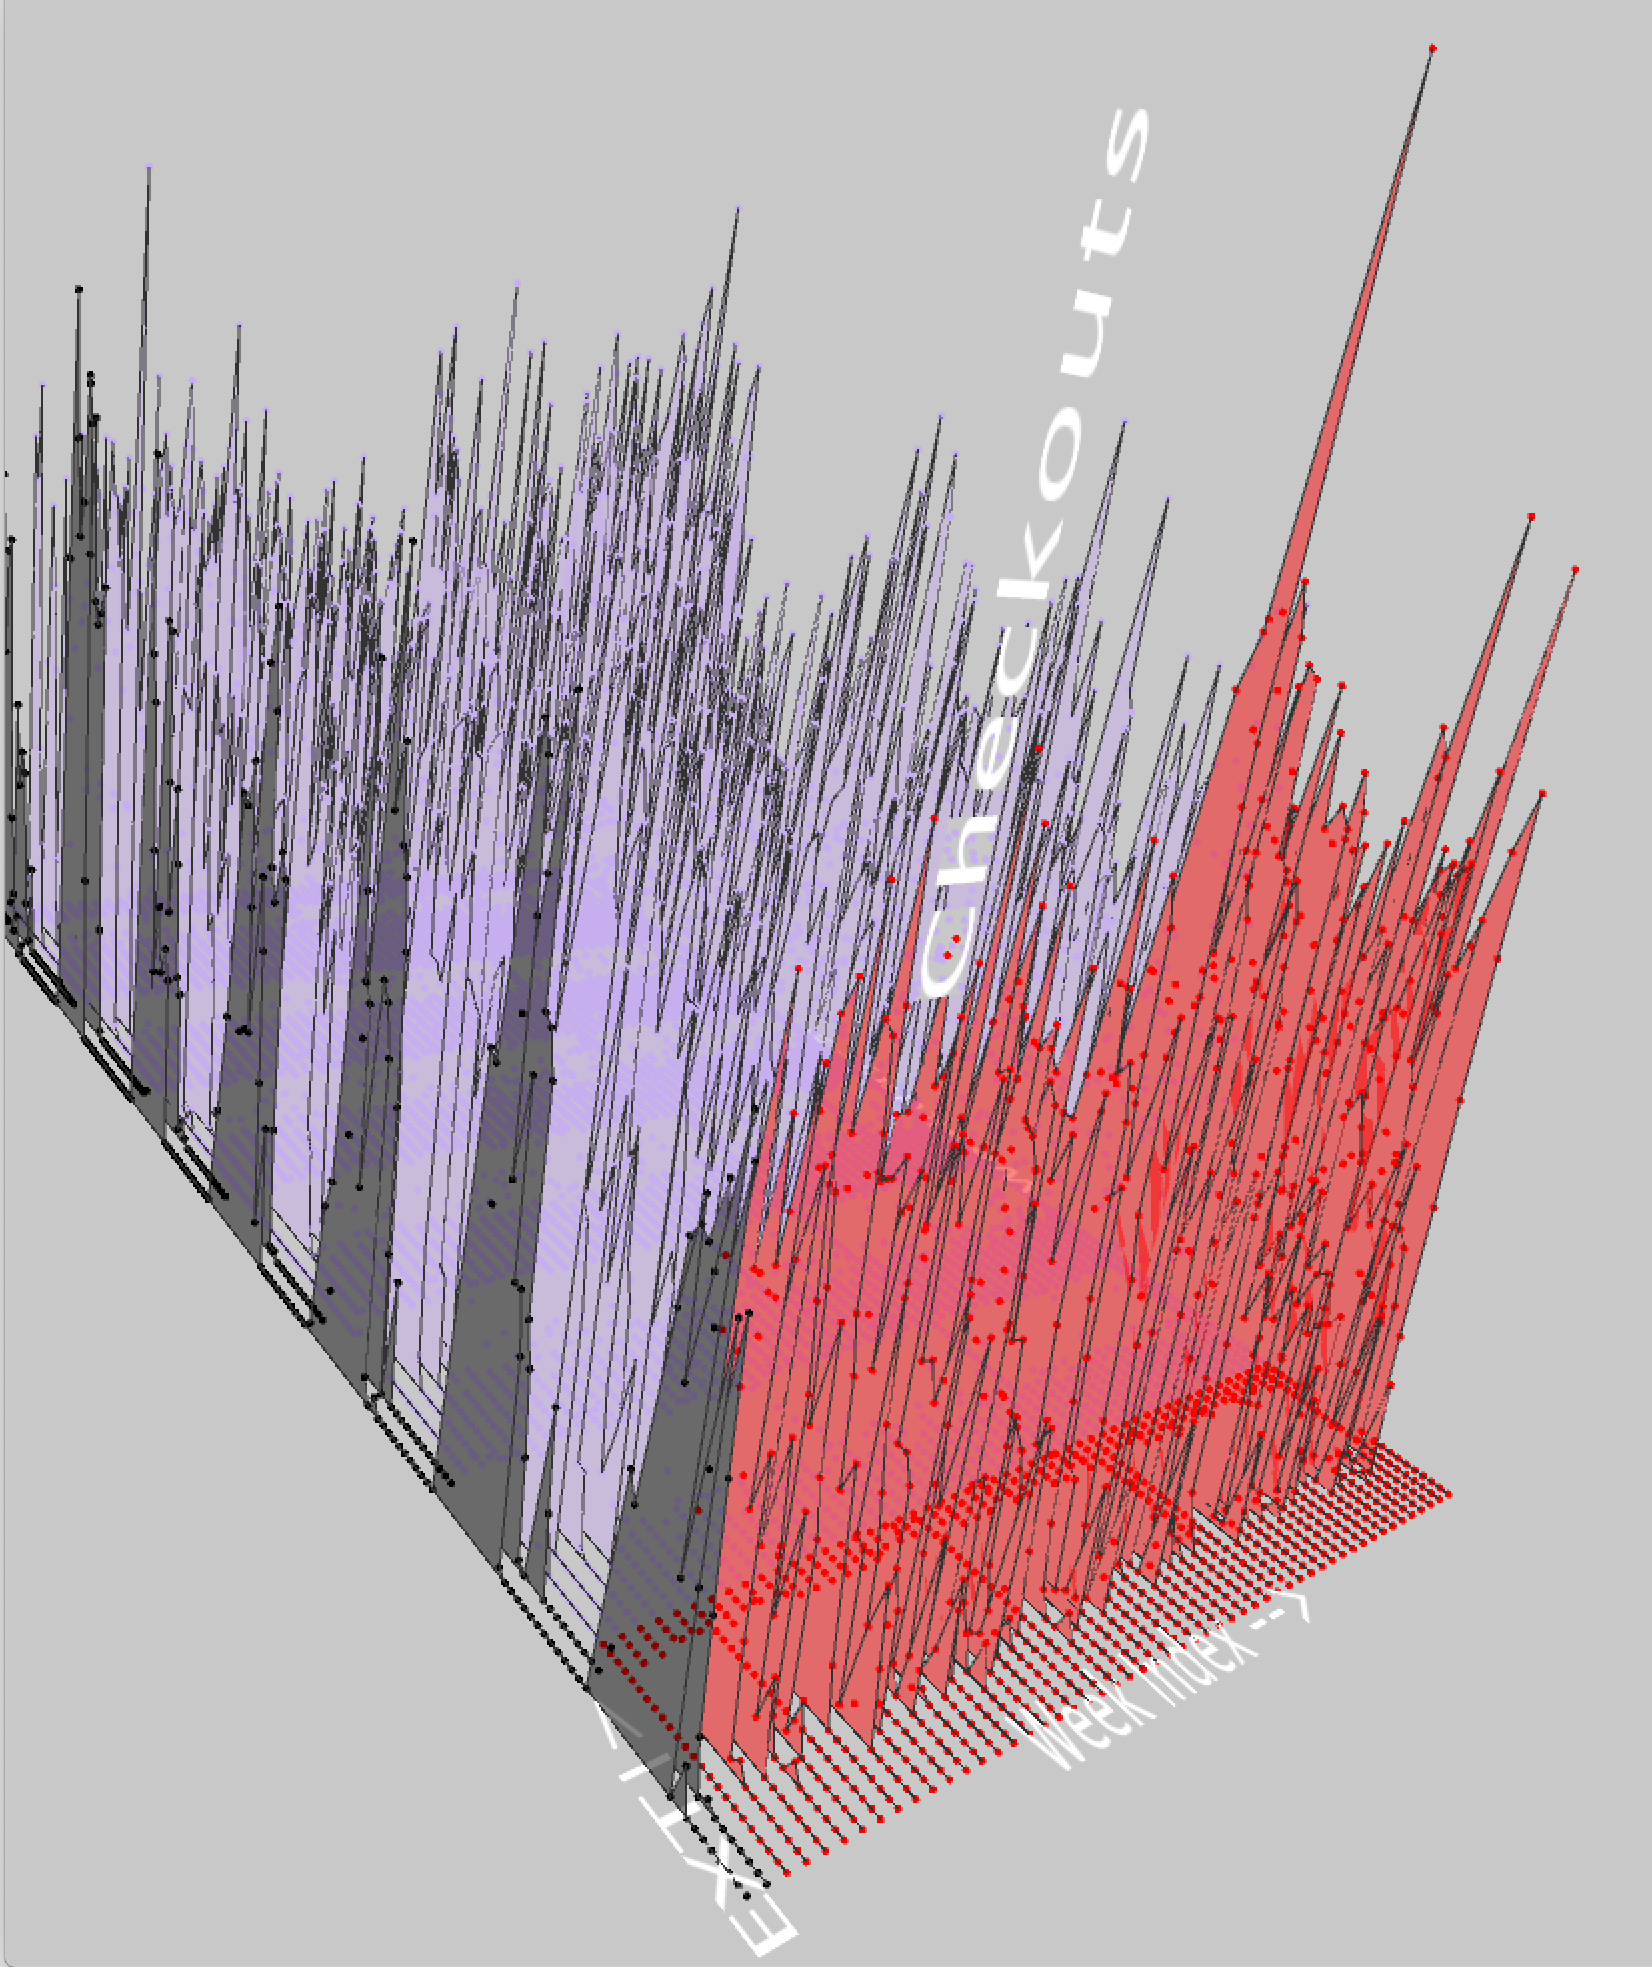
Here are some screenshots I took of the process, including trying to represent the data as floating points. The data gathered is very high resolution, covering 15-minute intervals for each day. The final version aggregates all these 15-minute data points into a sum for that day of that week.
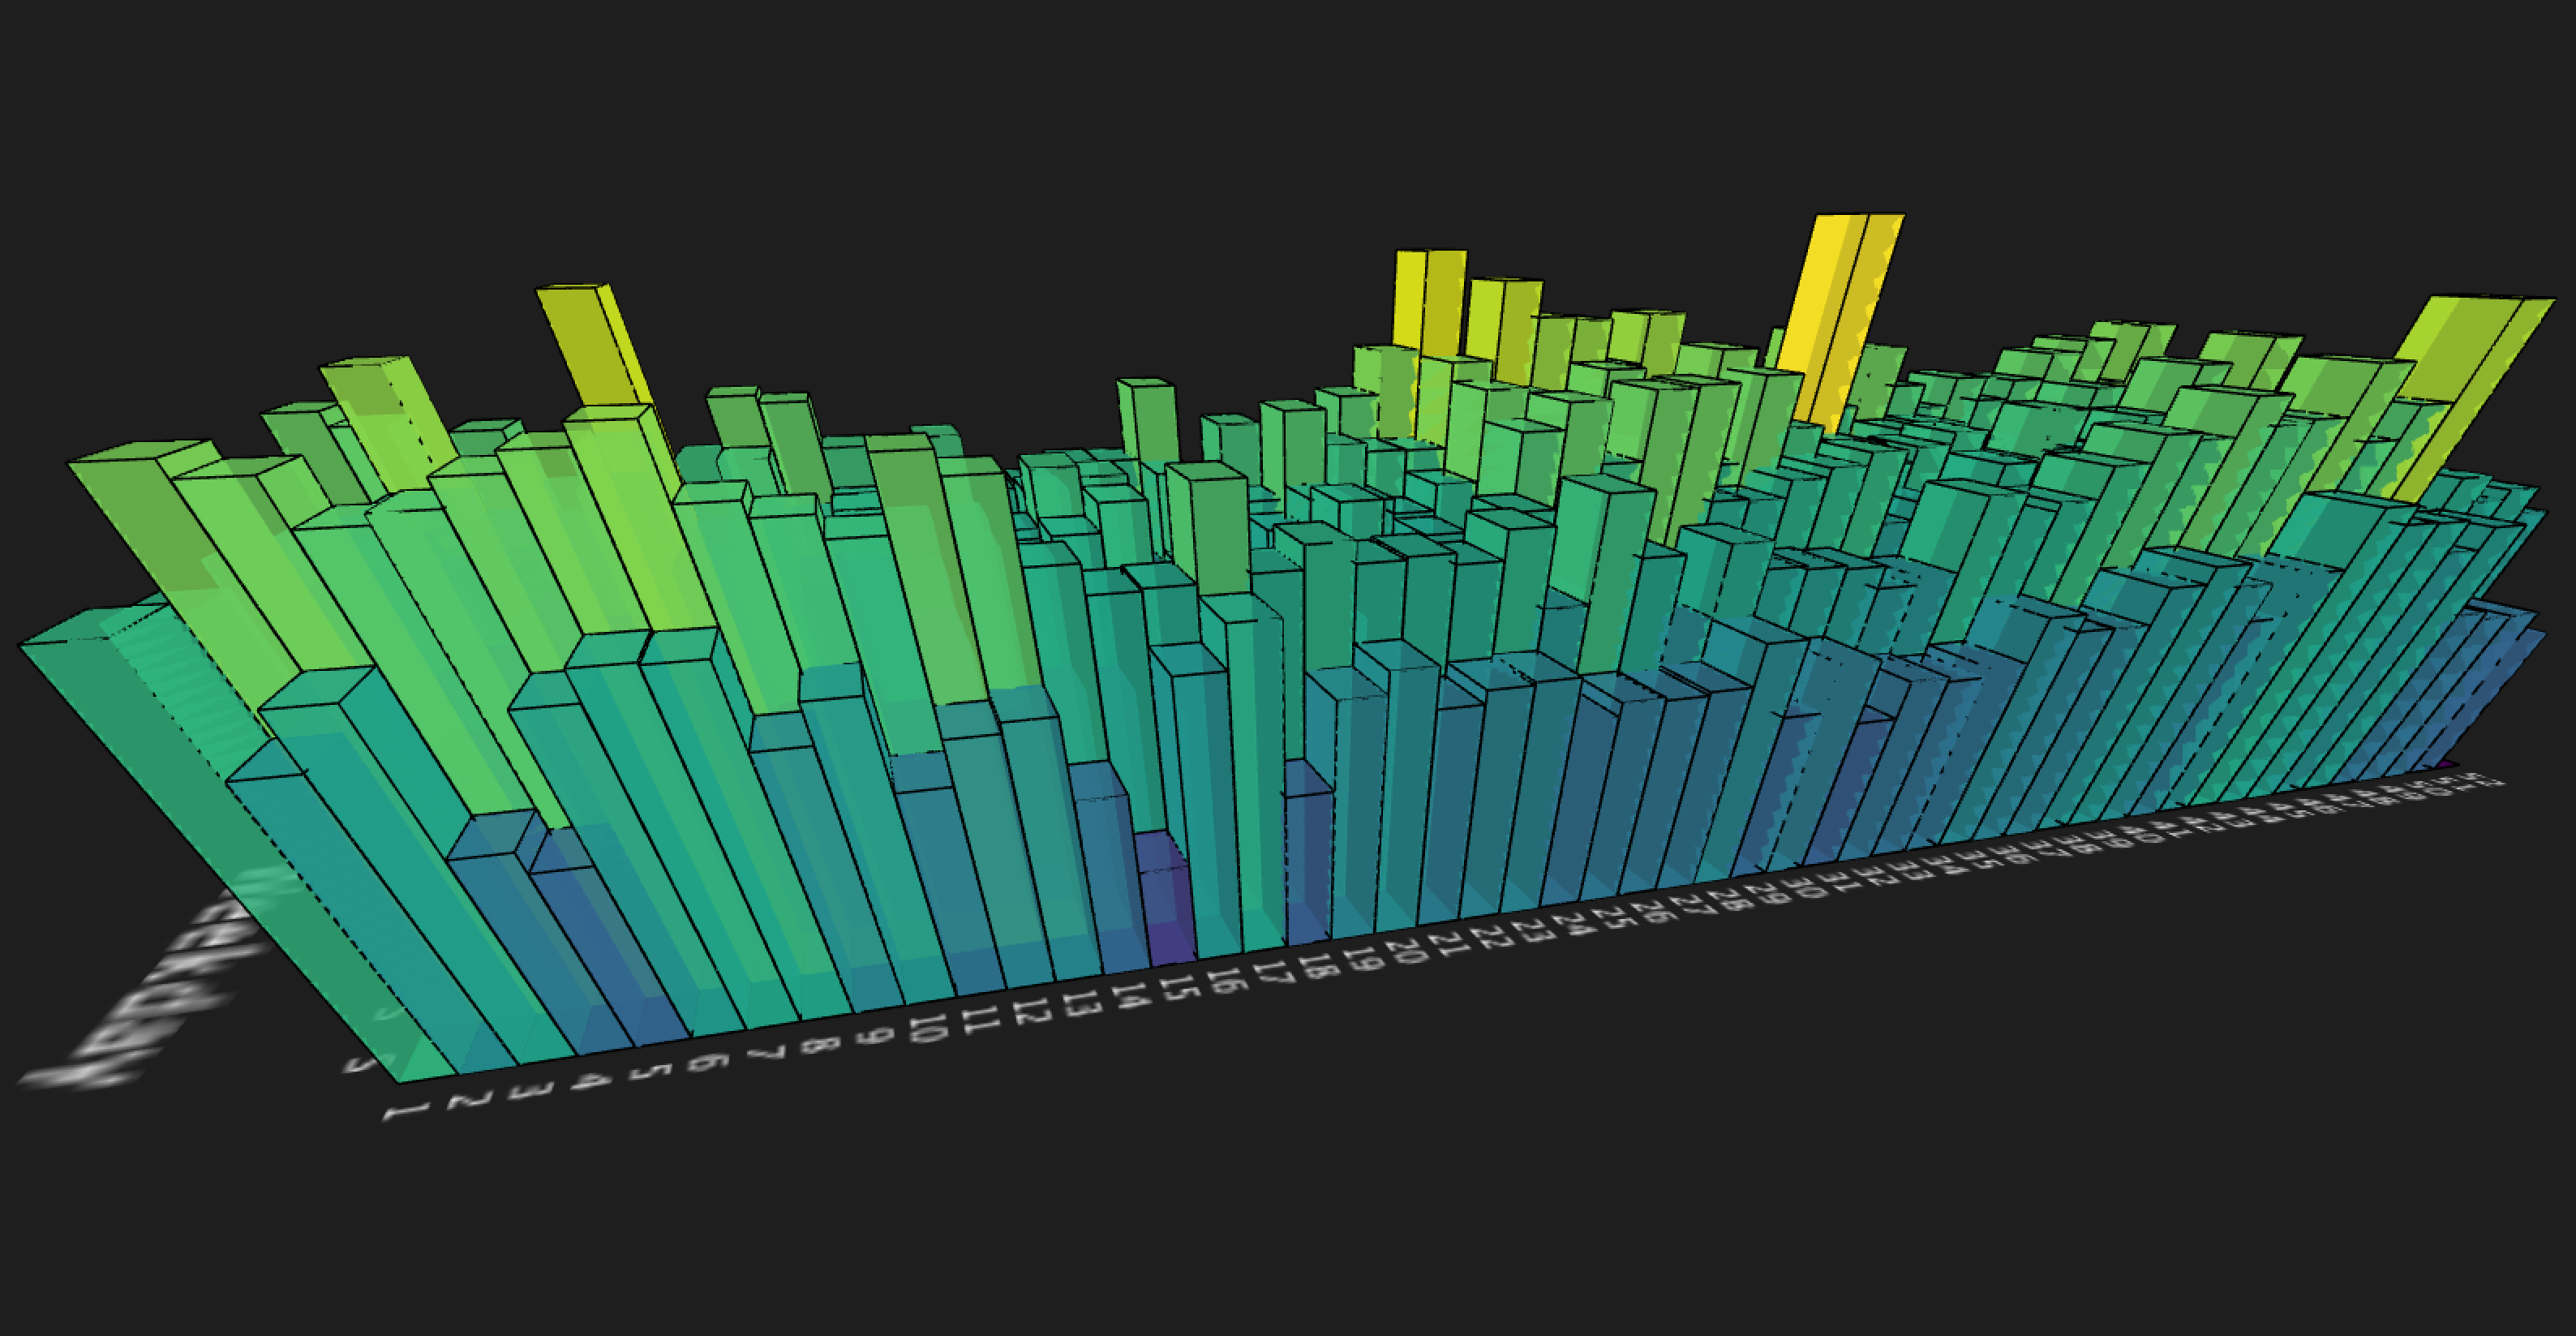
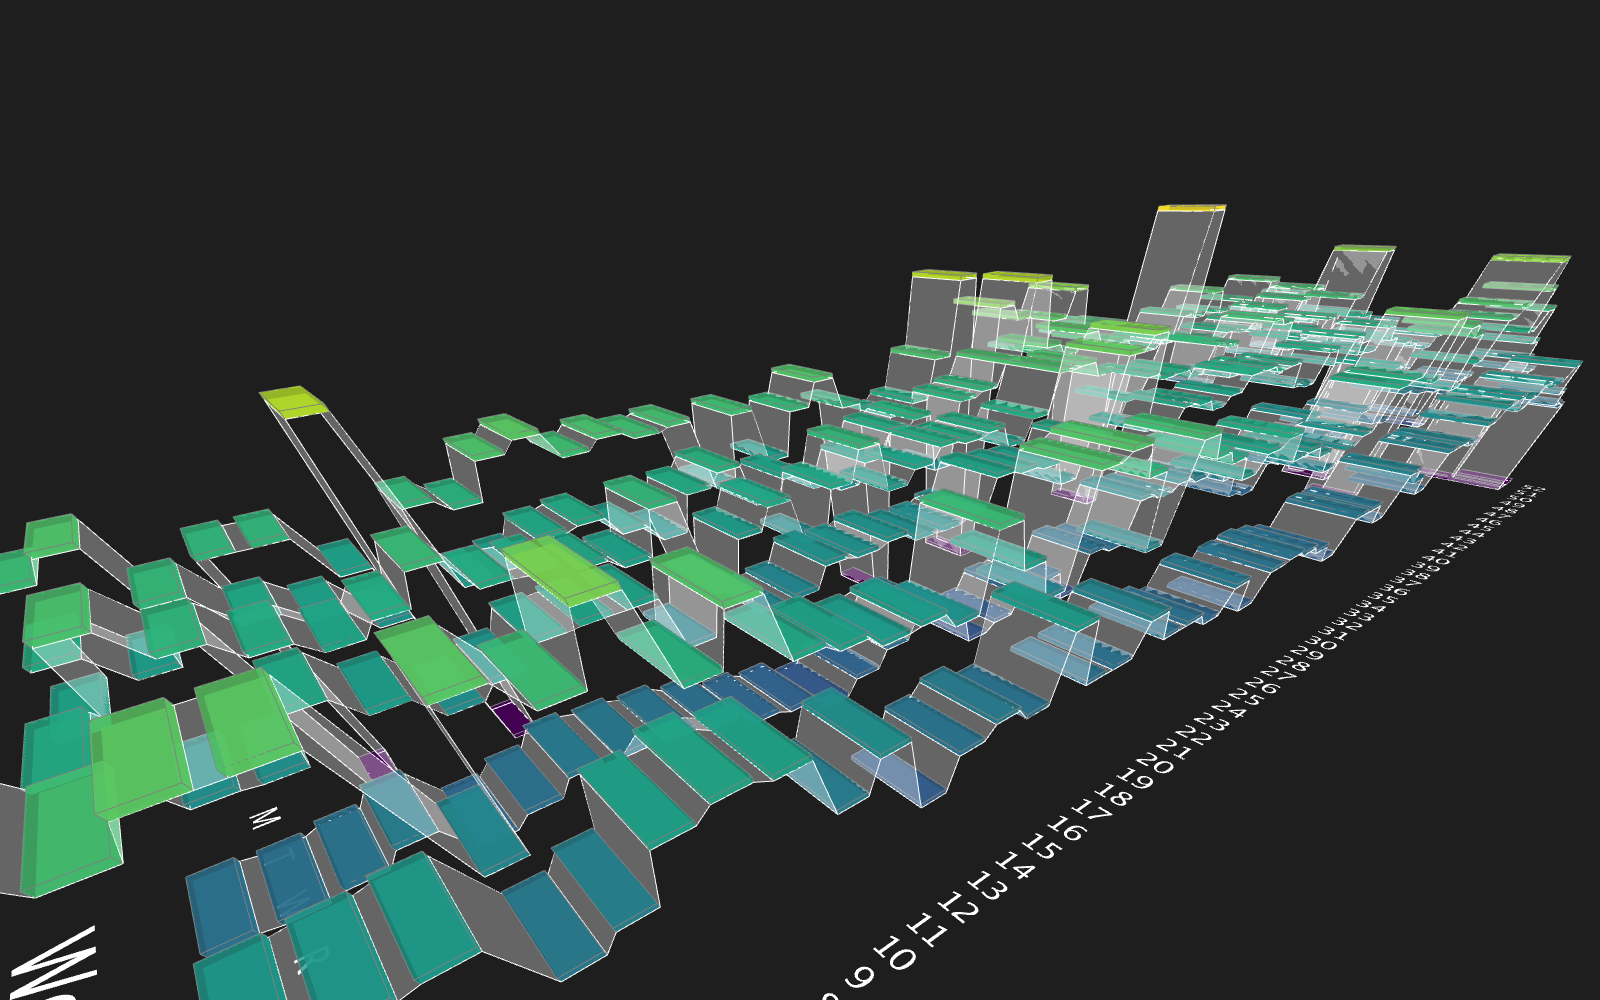
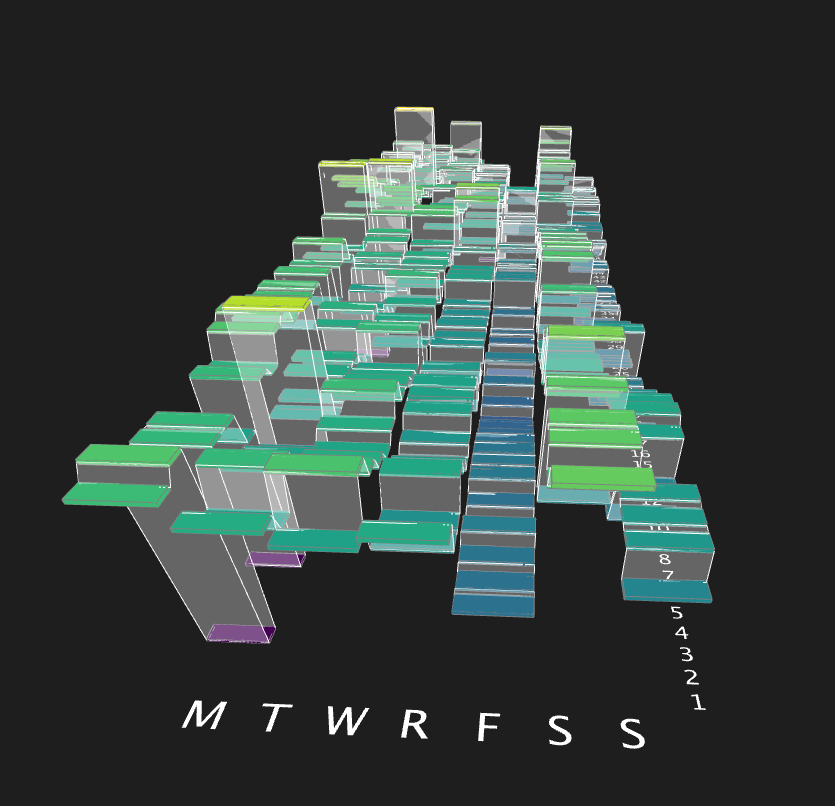
Final result
I finally arrived at a visualization that created a 3D bar chart, but I improved on this and made a ribbon effect, which allows the audience to see more data with greater clarity. The color can be changed with number keys to correspond to the height, or the relative quantity compared to the start year.
Code