A Network of Map Collections at Seattle Public Library
MAT 259, 2019
Susan Burtner
Concept
I took this class to learn how to make cool network visualizations, and since I work with a lot of maps, I decided to create a visualization that showed how the various map collections of the Seattle Public Library were related to each other based on a shared characteristic.
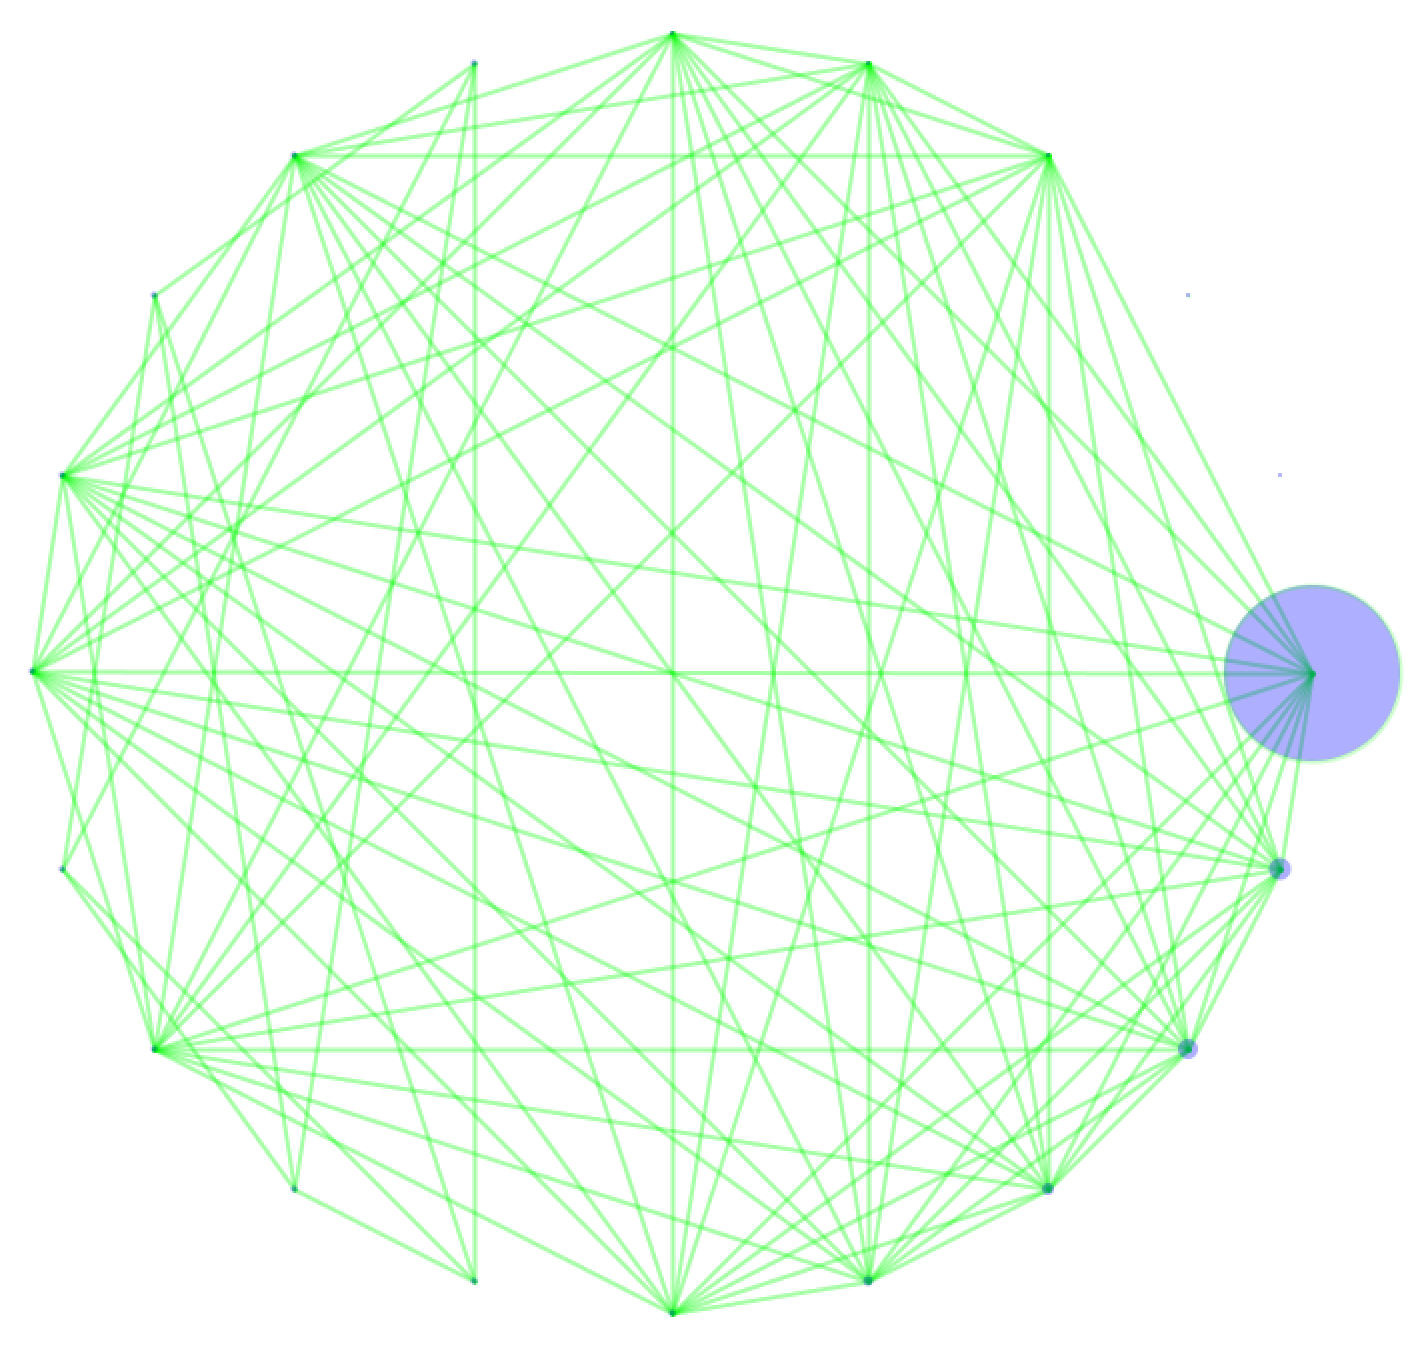
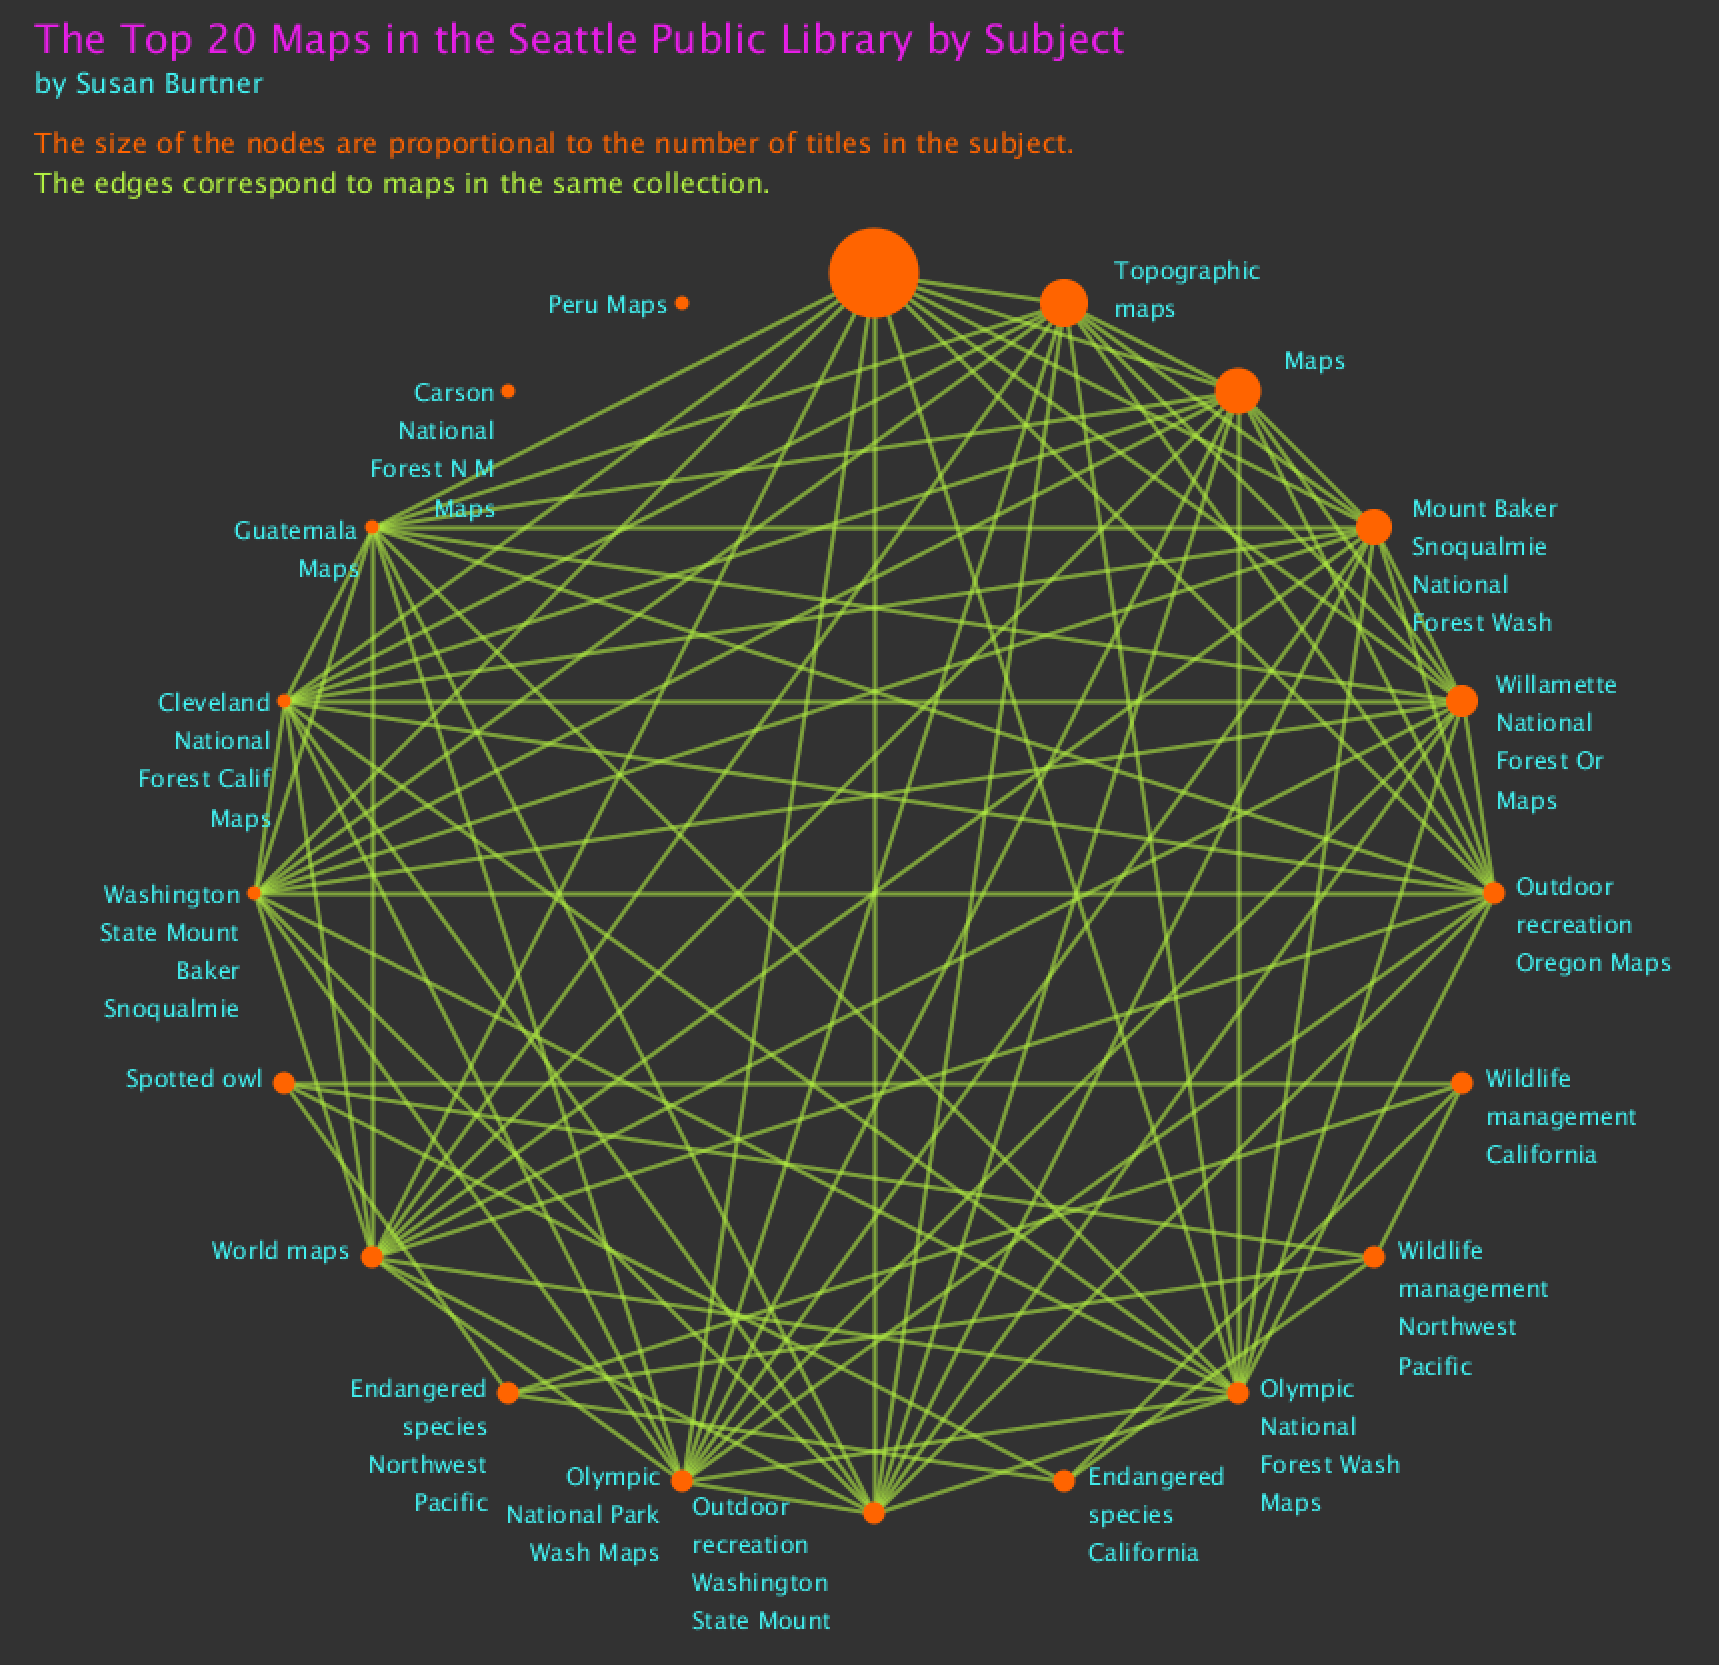
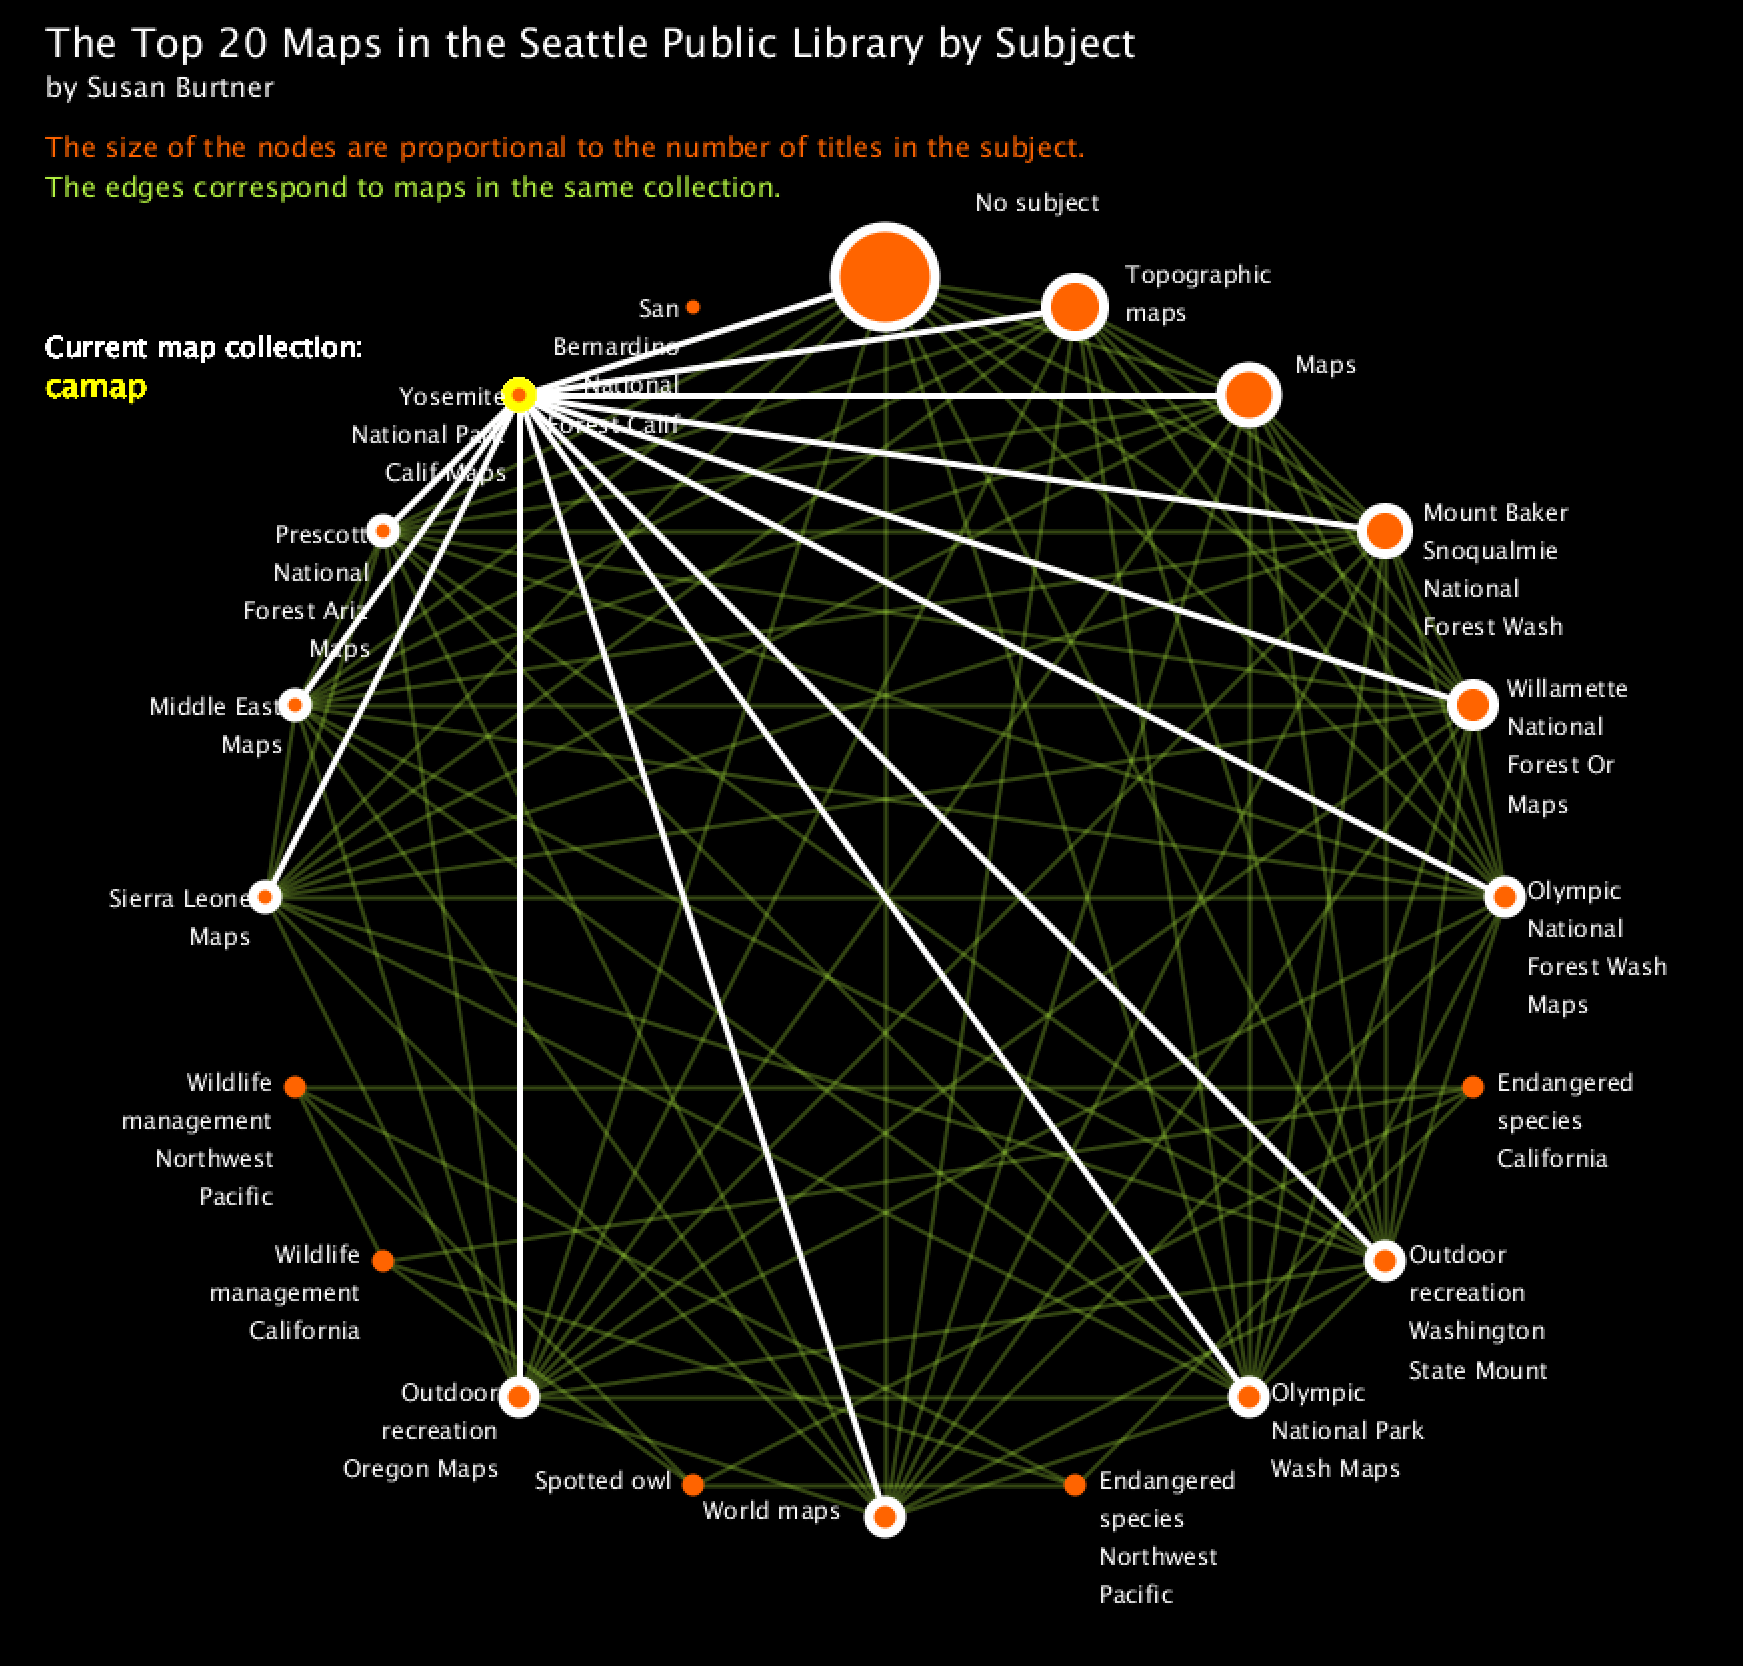
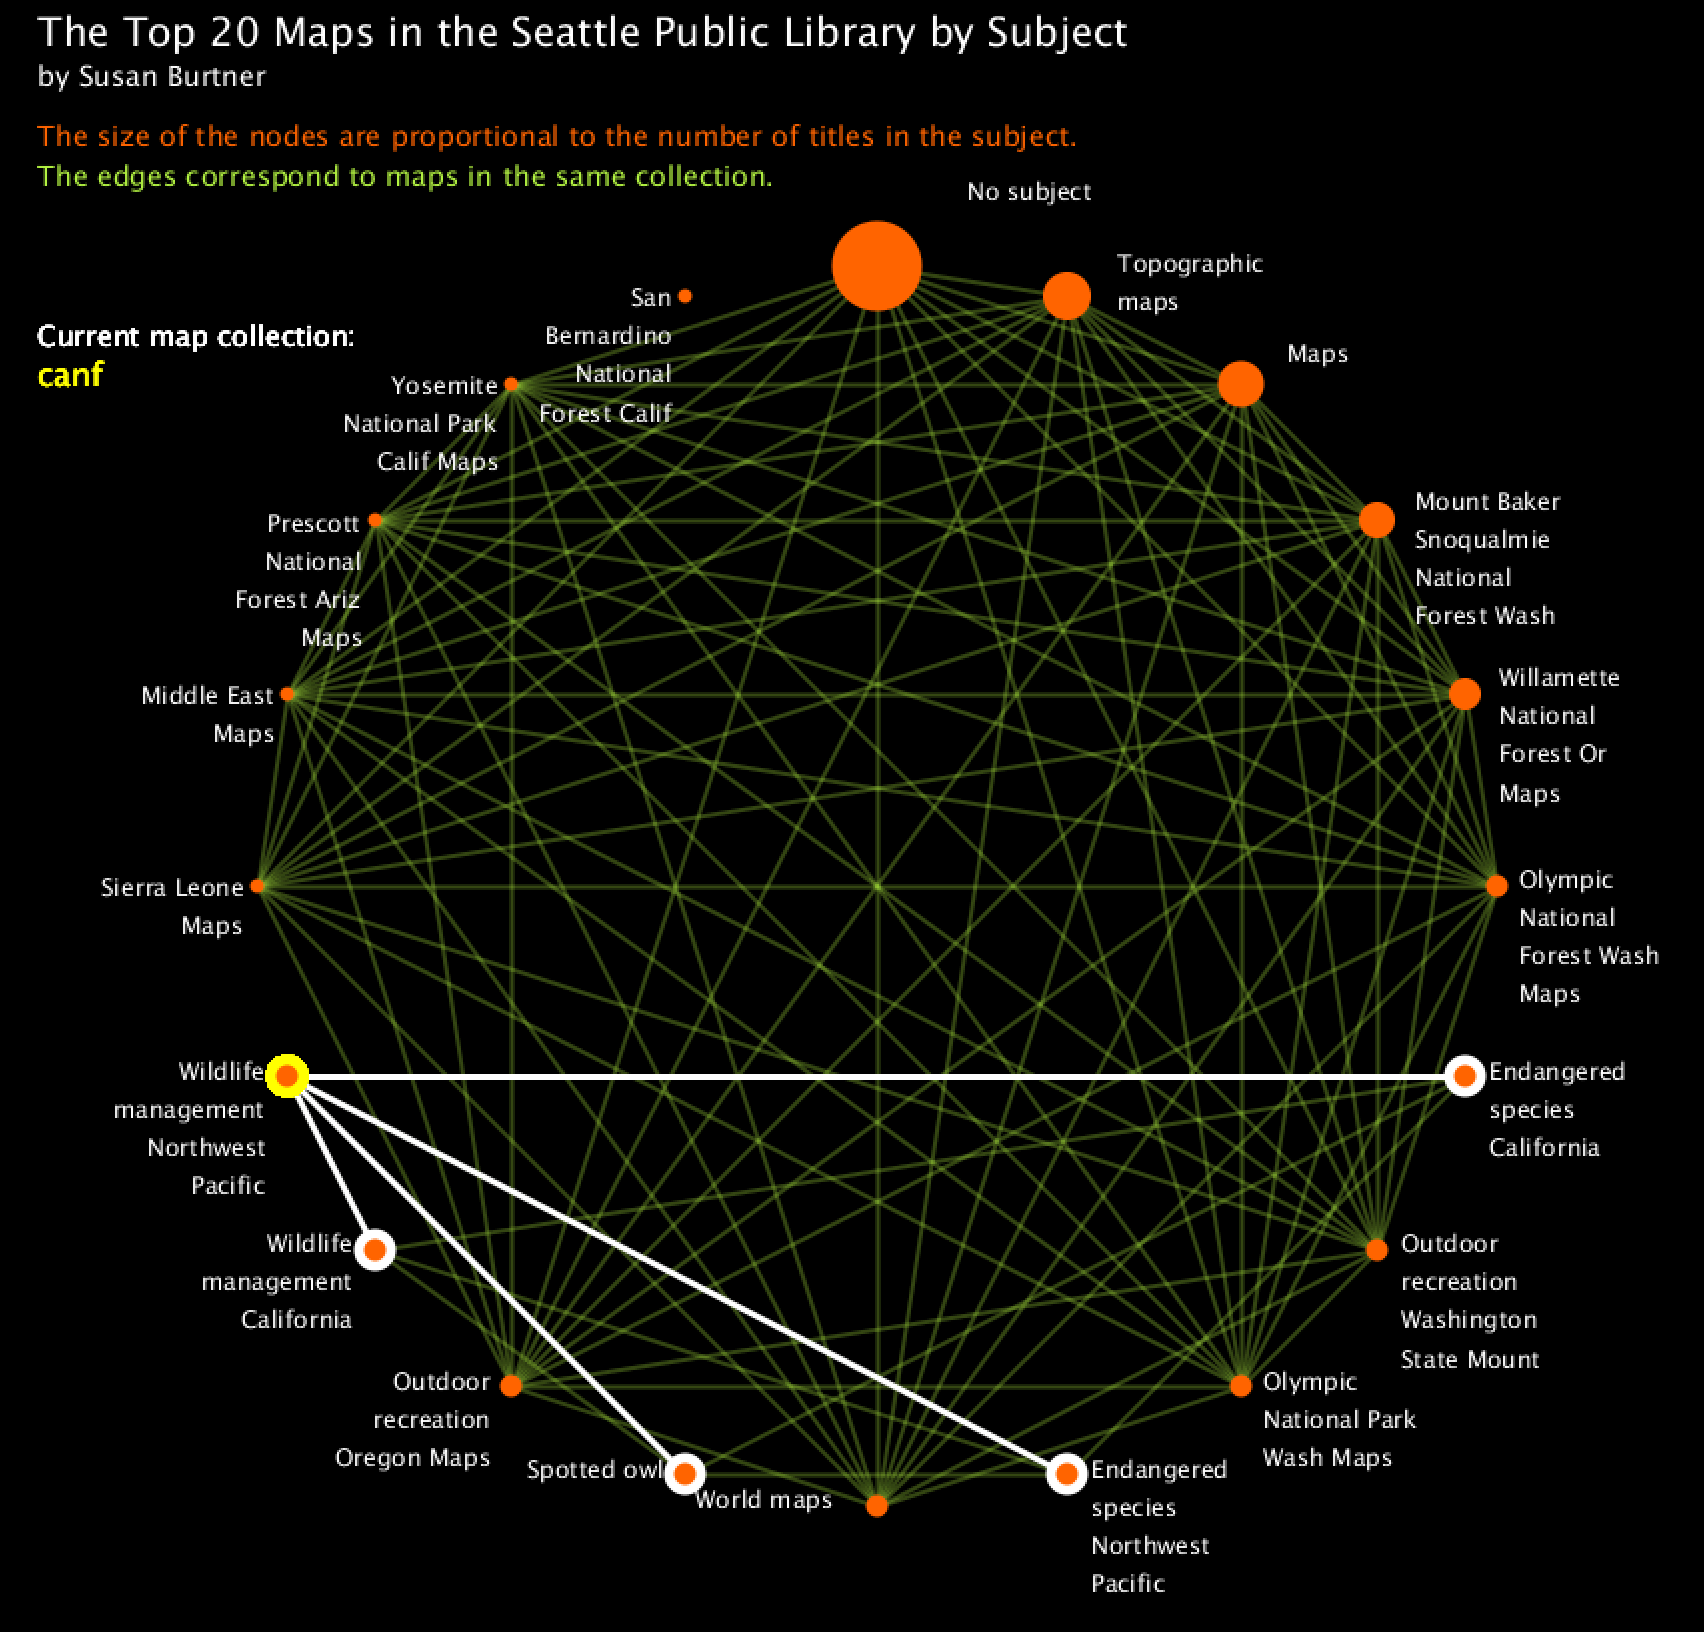
In my visualization, nodes represent subjects of maps and edges represent whether the subjects are in the same collection. The size of the nodes correspond to the number of titles in that subject. You can hover over a node to see which other subject matters are covered in the collection.
In my visualization, nodes represent subjects of maps and edges represent whether the subjects are in the same collection. The size of the nodes correspond to the number of titles in that subject. You can hover over a node to see which other subject matters are covered in the collection.
Query
SELECT `subject`, COUNT(title.title) AS numberOfTitlesInSubject, collectionCode.collectionCode
FROM title, `subject`, itemType, itemToBib, collectionCode
WHERE itemType.itemtype LIKE '%acmap' AND
collectionCode.itemNumber = itemType.itemNumber AND
itemType.itemNumber = itemToBib.itemNumber AND
itemToBib.bibNumber = subject.bibNumber AND
subject.bibNumber = title.bibNumber
GROUP BY `subject`, collectionCode
ORDER BY numberOfTitlesInSubject DESC
LIMIT 20;
Preliminary sketches
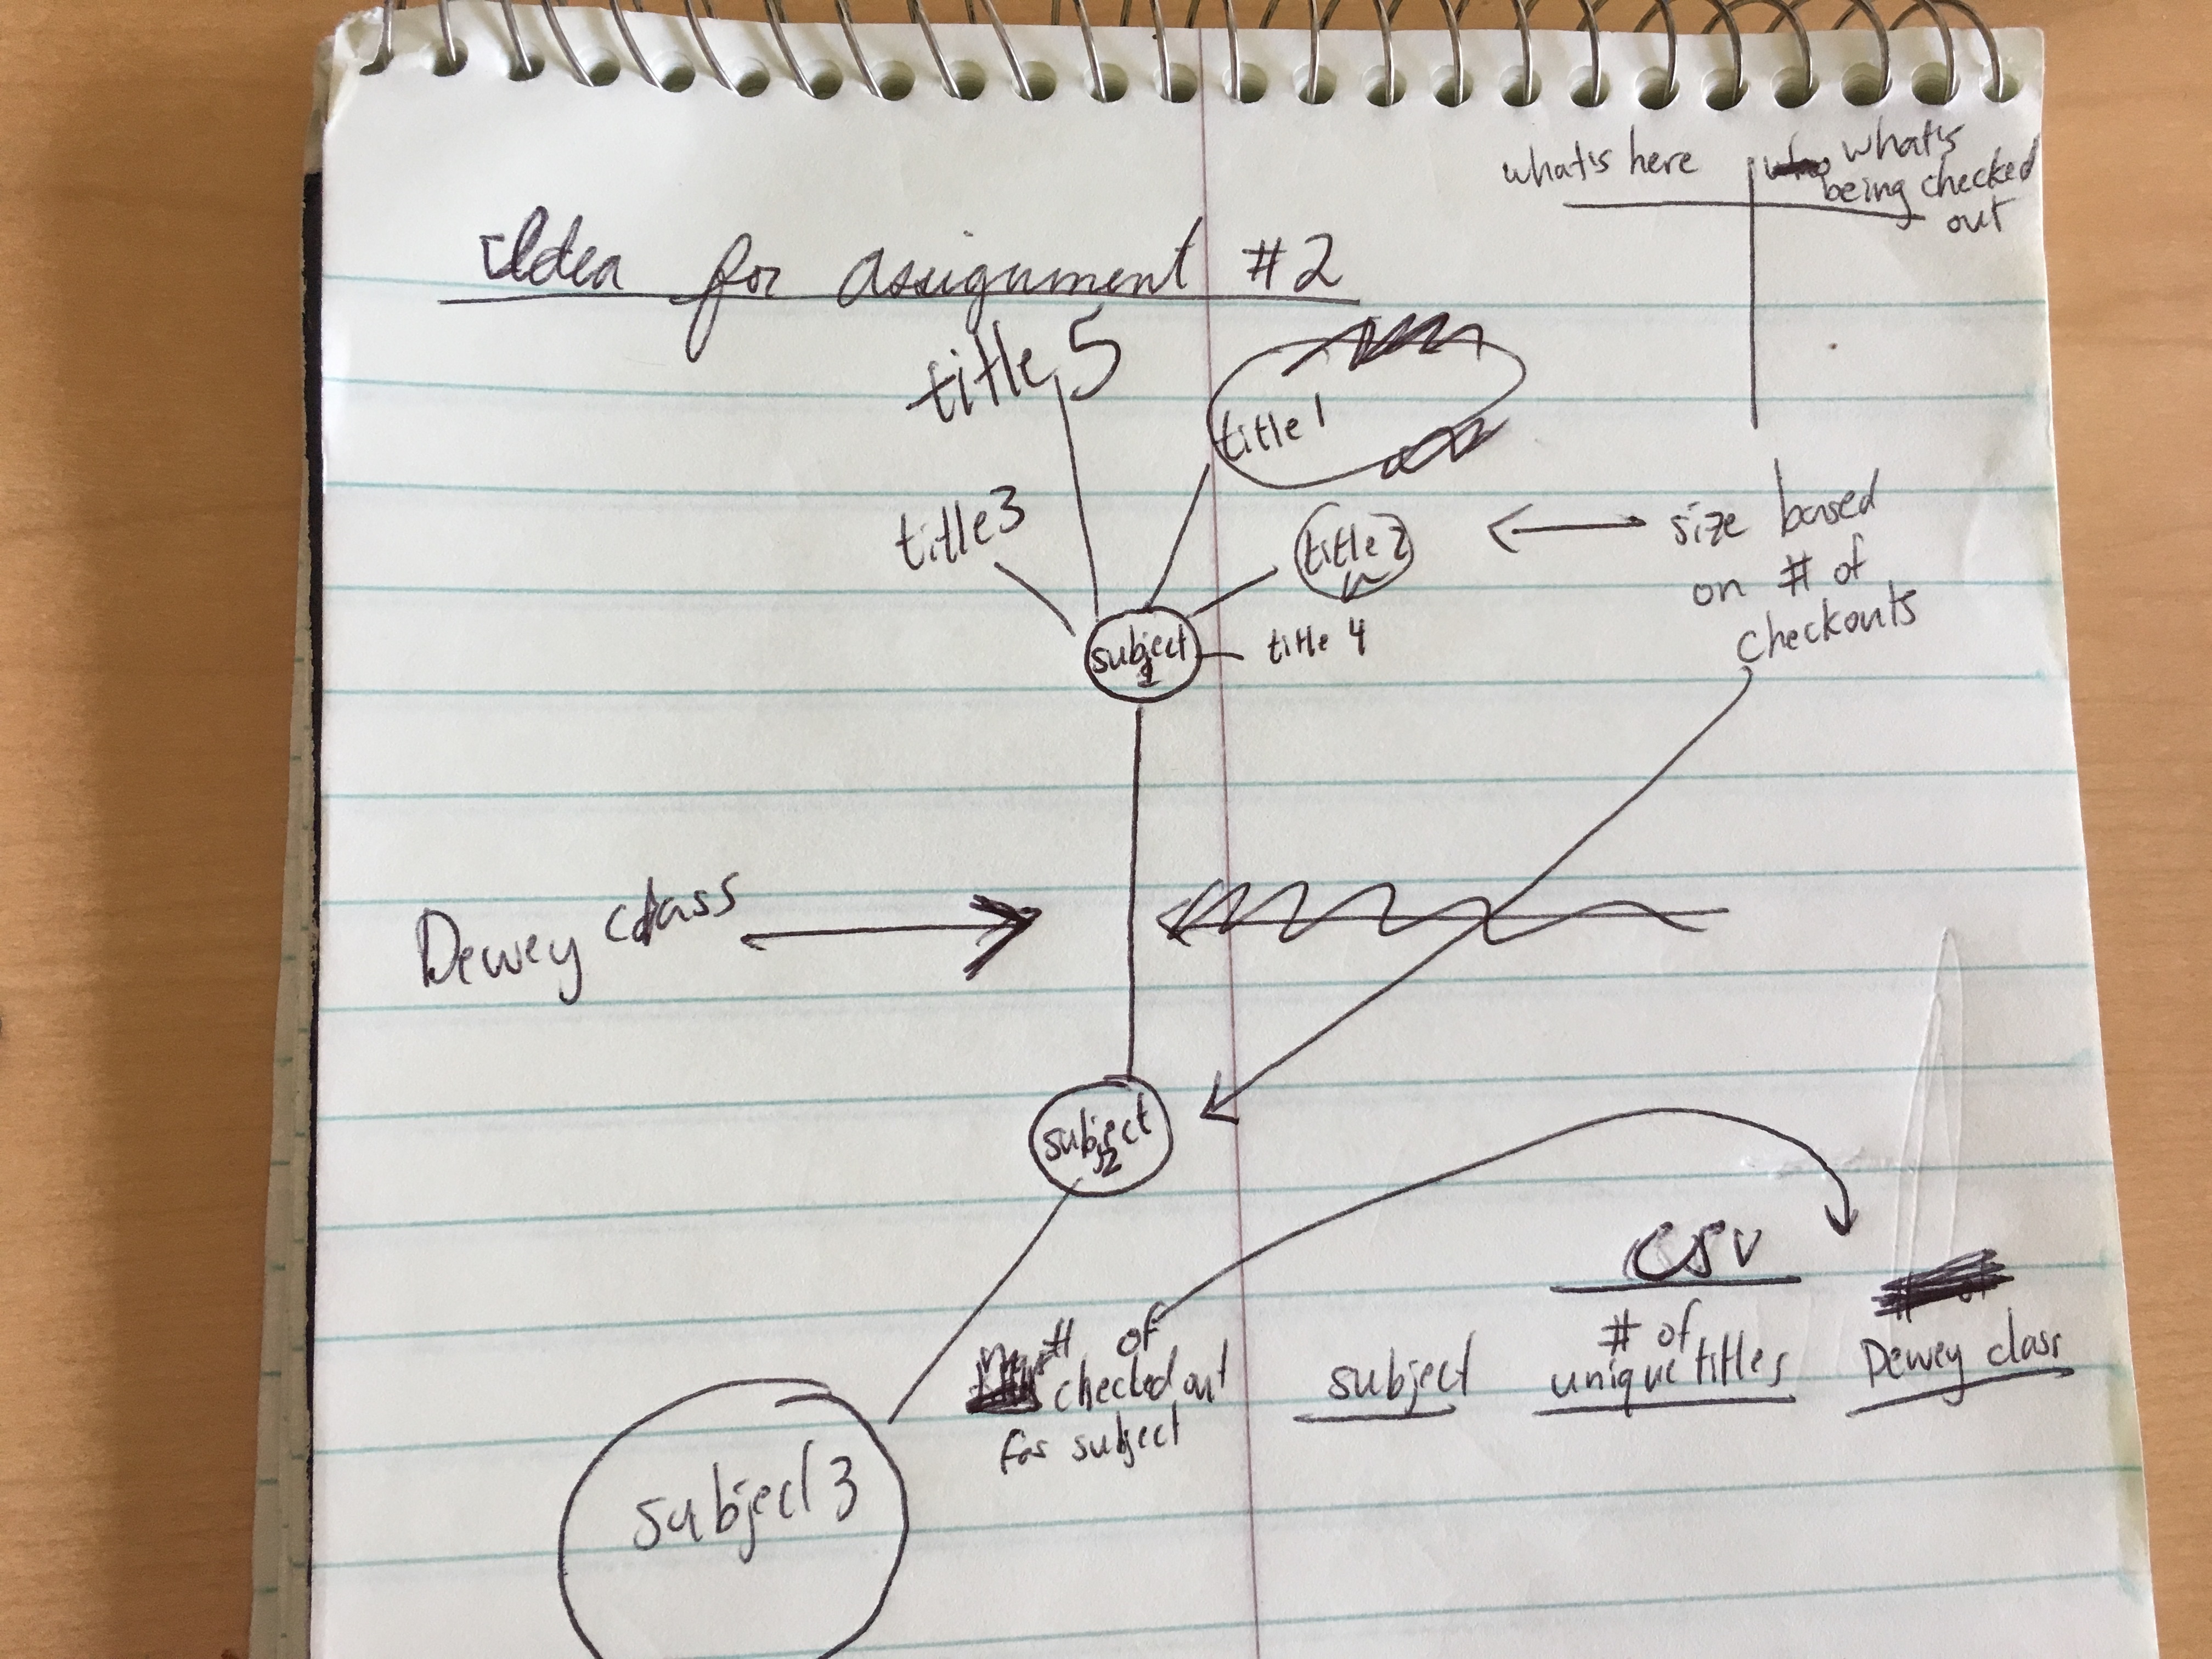
My initial sketch was fairly faithful to what I was able to implement. Though originally I wanted to look at Dewey classes, there were unfortunately too few records with Dewey classes included. I ultimately chose to compare subjects of maps which exposed an interesting variety of subjectivity among the people who manually catalogued the maps.
Process
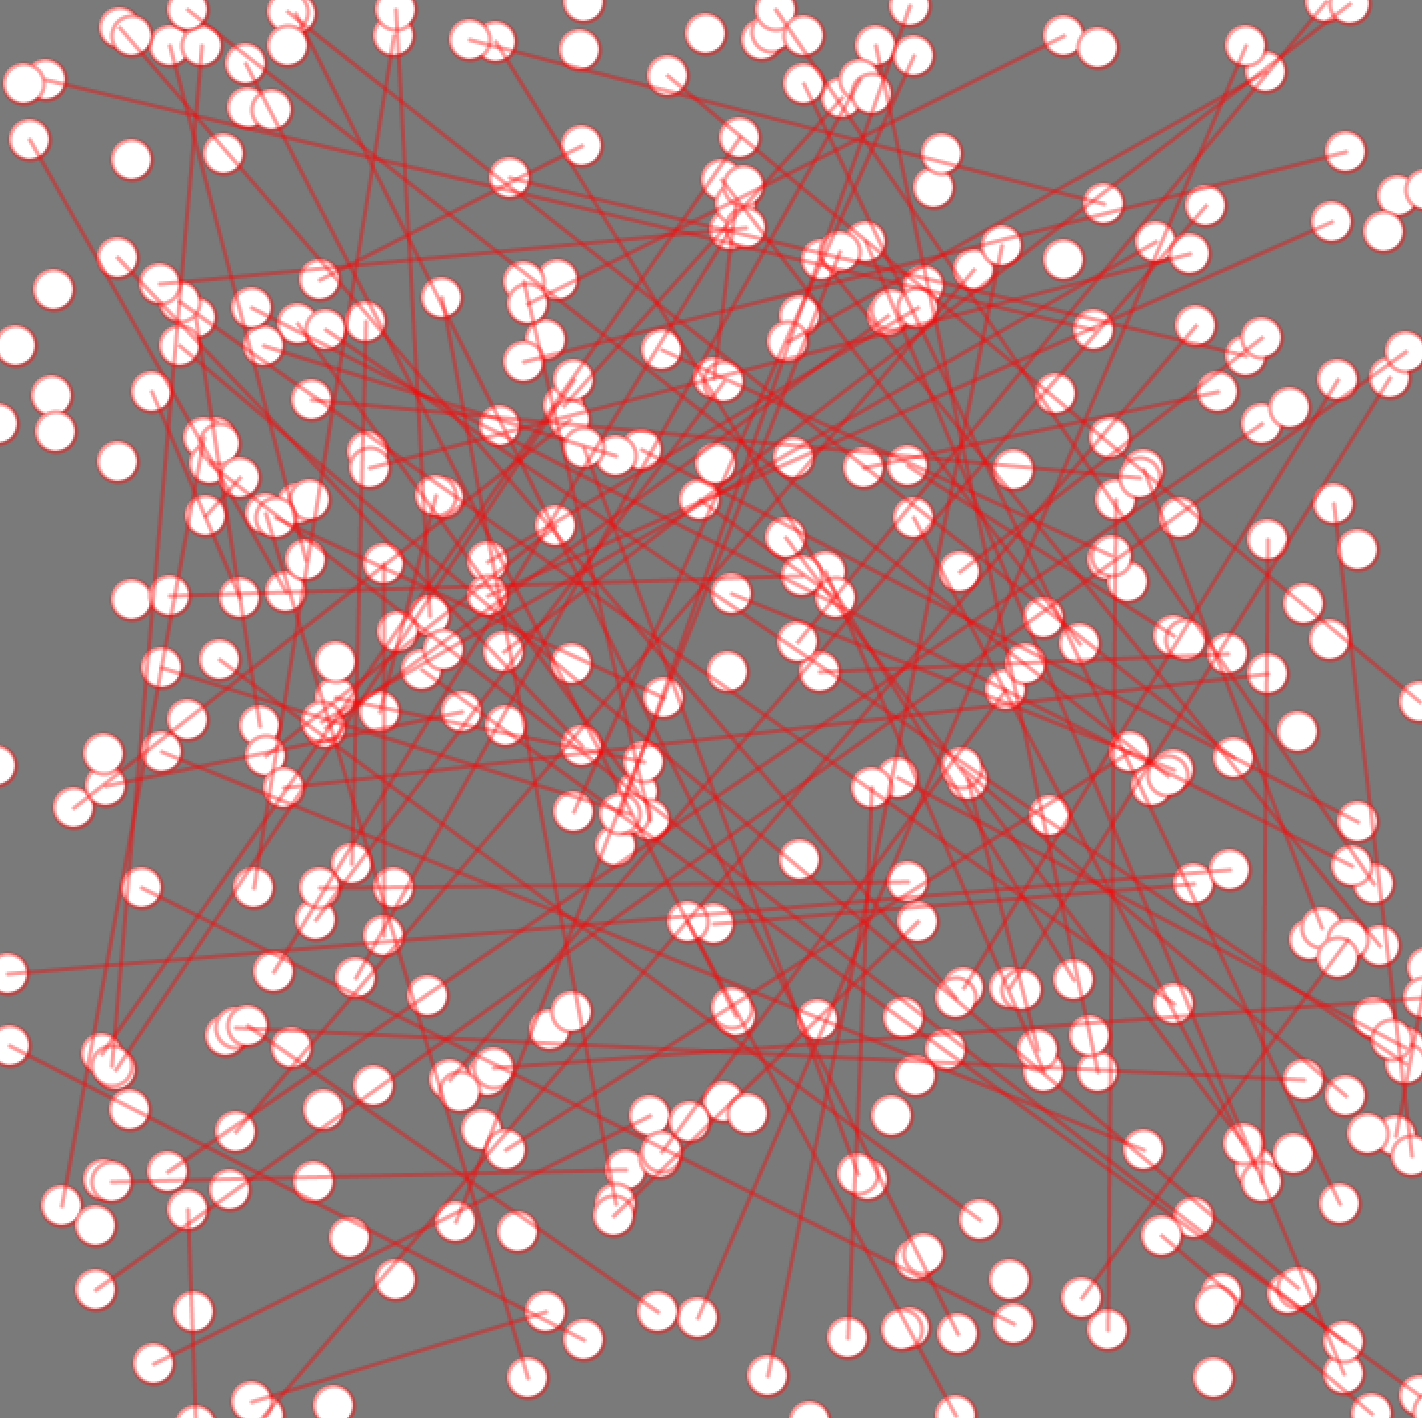
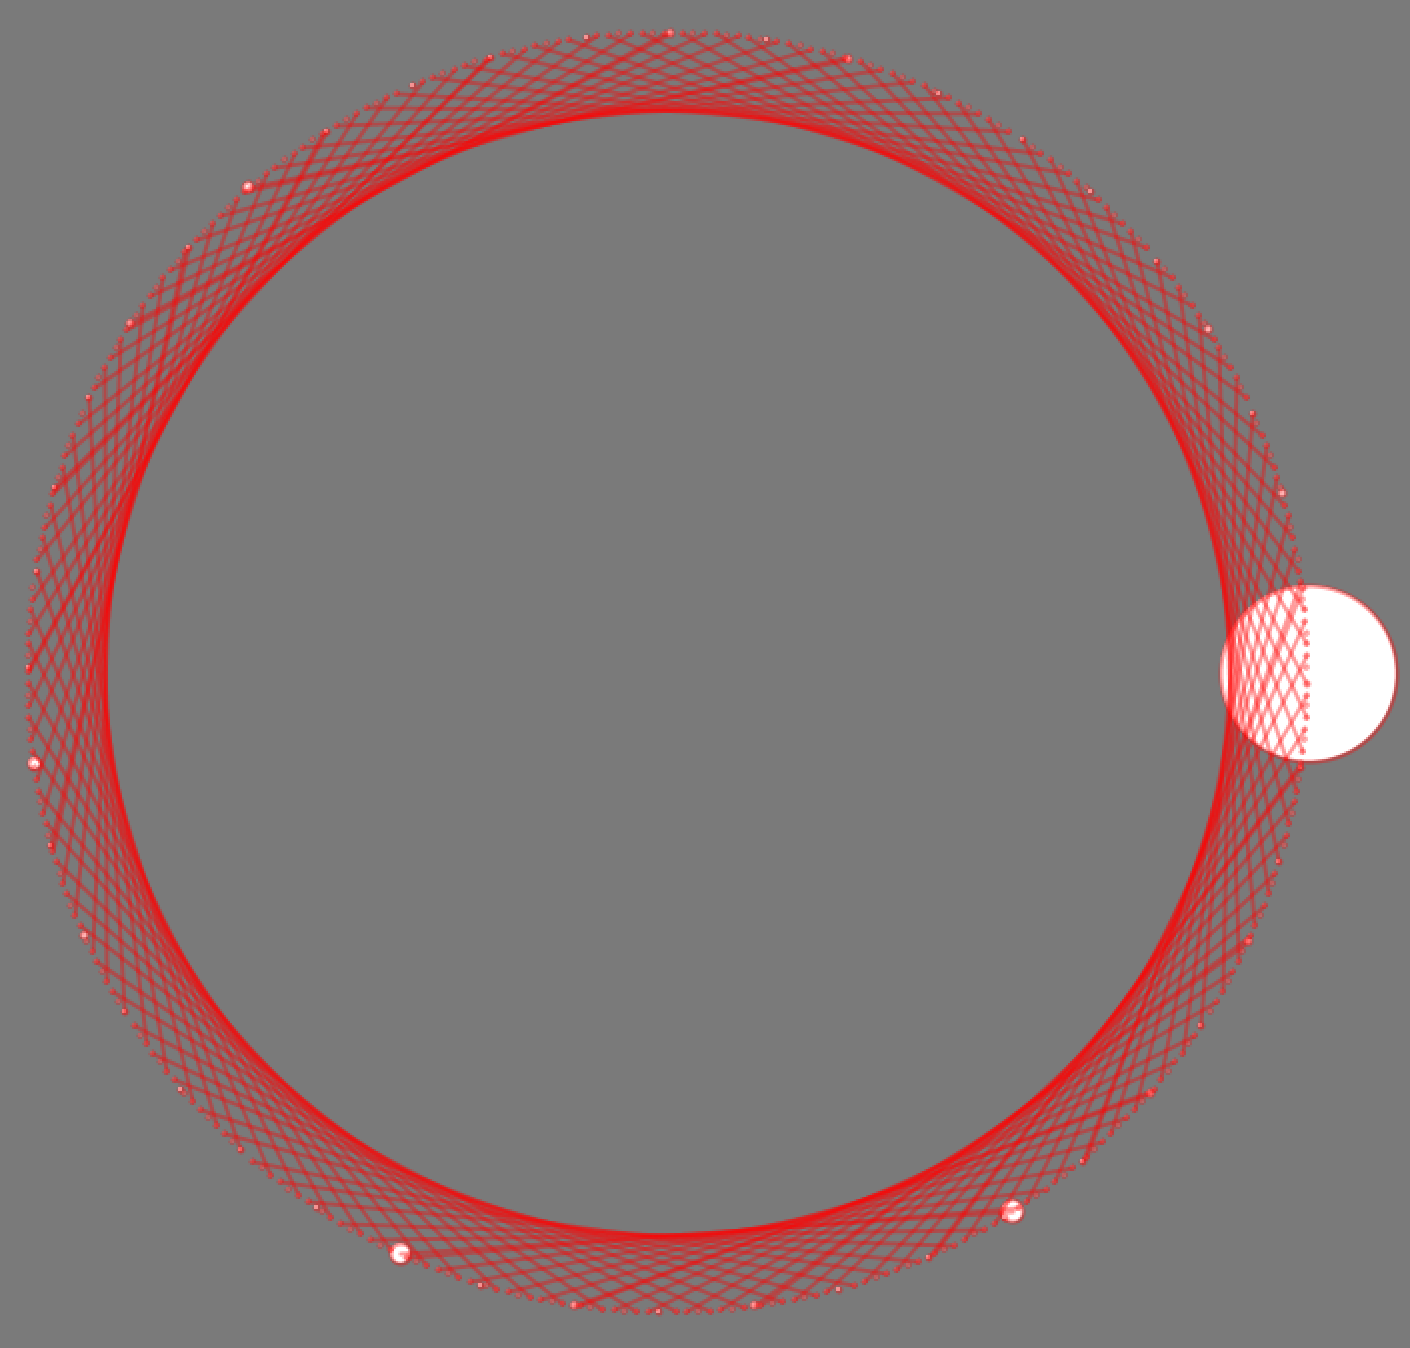
At first all I could make was a visualization with random nodes. Then I figured out how to place them meaningfully in a circle. Then I was able to able to give the nodes another dimension of meaning by size. And finally, I constructed the network.


Final result
After getting some feedback from the class, I implemented some minor changes to my initial final result and produced the visualization below. In this edited version, you can hover over nodes to see which map subjects are covered by the same collection. Simultaneously, the name of the map collection is given on the left hand side. While there was a question on the order of the nodes along the circle, I decided to keep it since I liked how easy it was to move between subjects.


Code