Visualizing the Items Acquired by Seattle Public Library over Time
MAT 259, 2019
Jiaheng Tang
Concept
I'm interested in one particular metadata - itemNumber. It is a unique and incrementing id that gets assigned and incremented each time a new item gets acquired. I want to plot the itemNumber as well as the deweyClass of each item over time to see if there are any interesting patterns.
Query
This query returns itemNumber, bibNumber, itemType, title and deweyClass of all the items sorted by itemNumber. It takes about 29 seconds and returns 2,391,281 results.
It's worth noting that there are duplicates with the same item number, and only differs slightly in their titles. I removed them later when loading into processing. After removing the duplicates, there remain 2,326,621 records.
Preliminary sketches and process
I then used a python script to substitute the itemType of each record to book or media or misc based on their original itemType. Here is the python script I wrote.
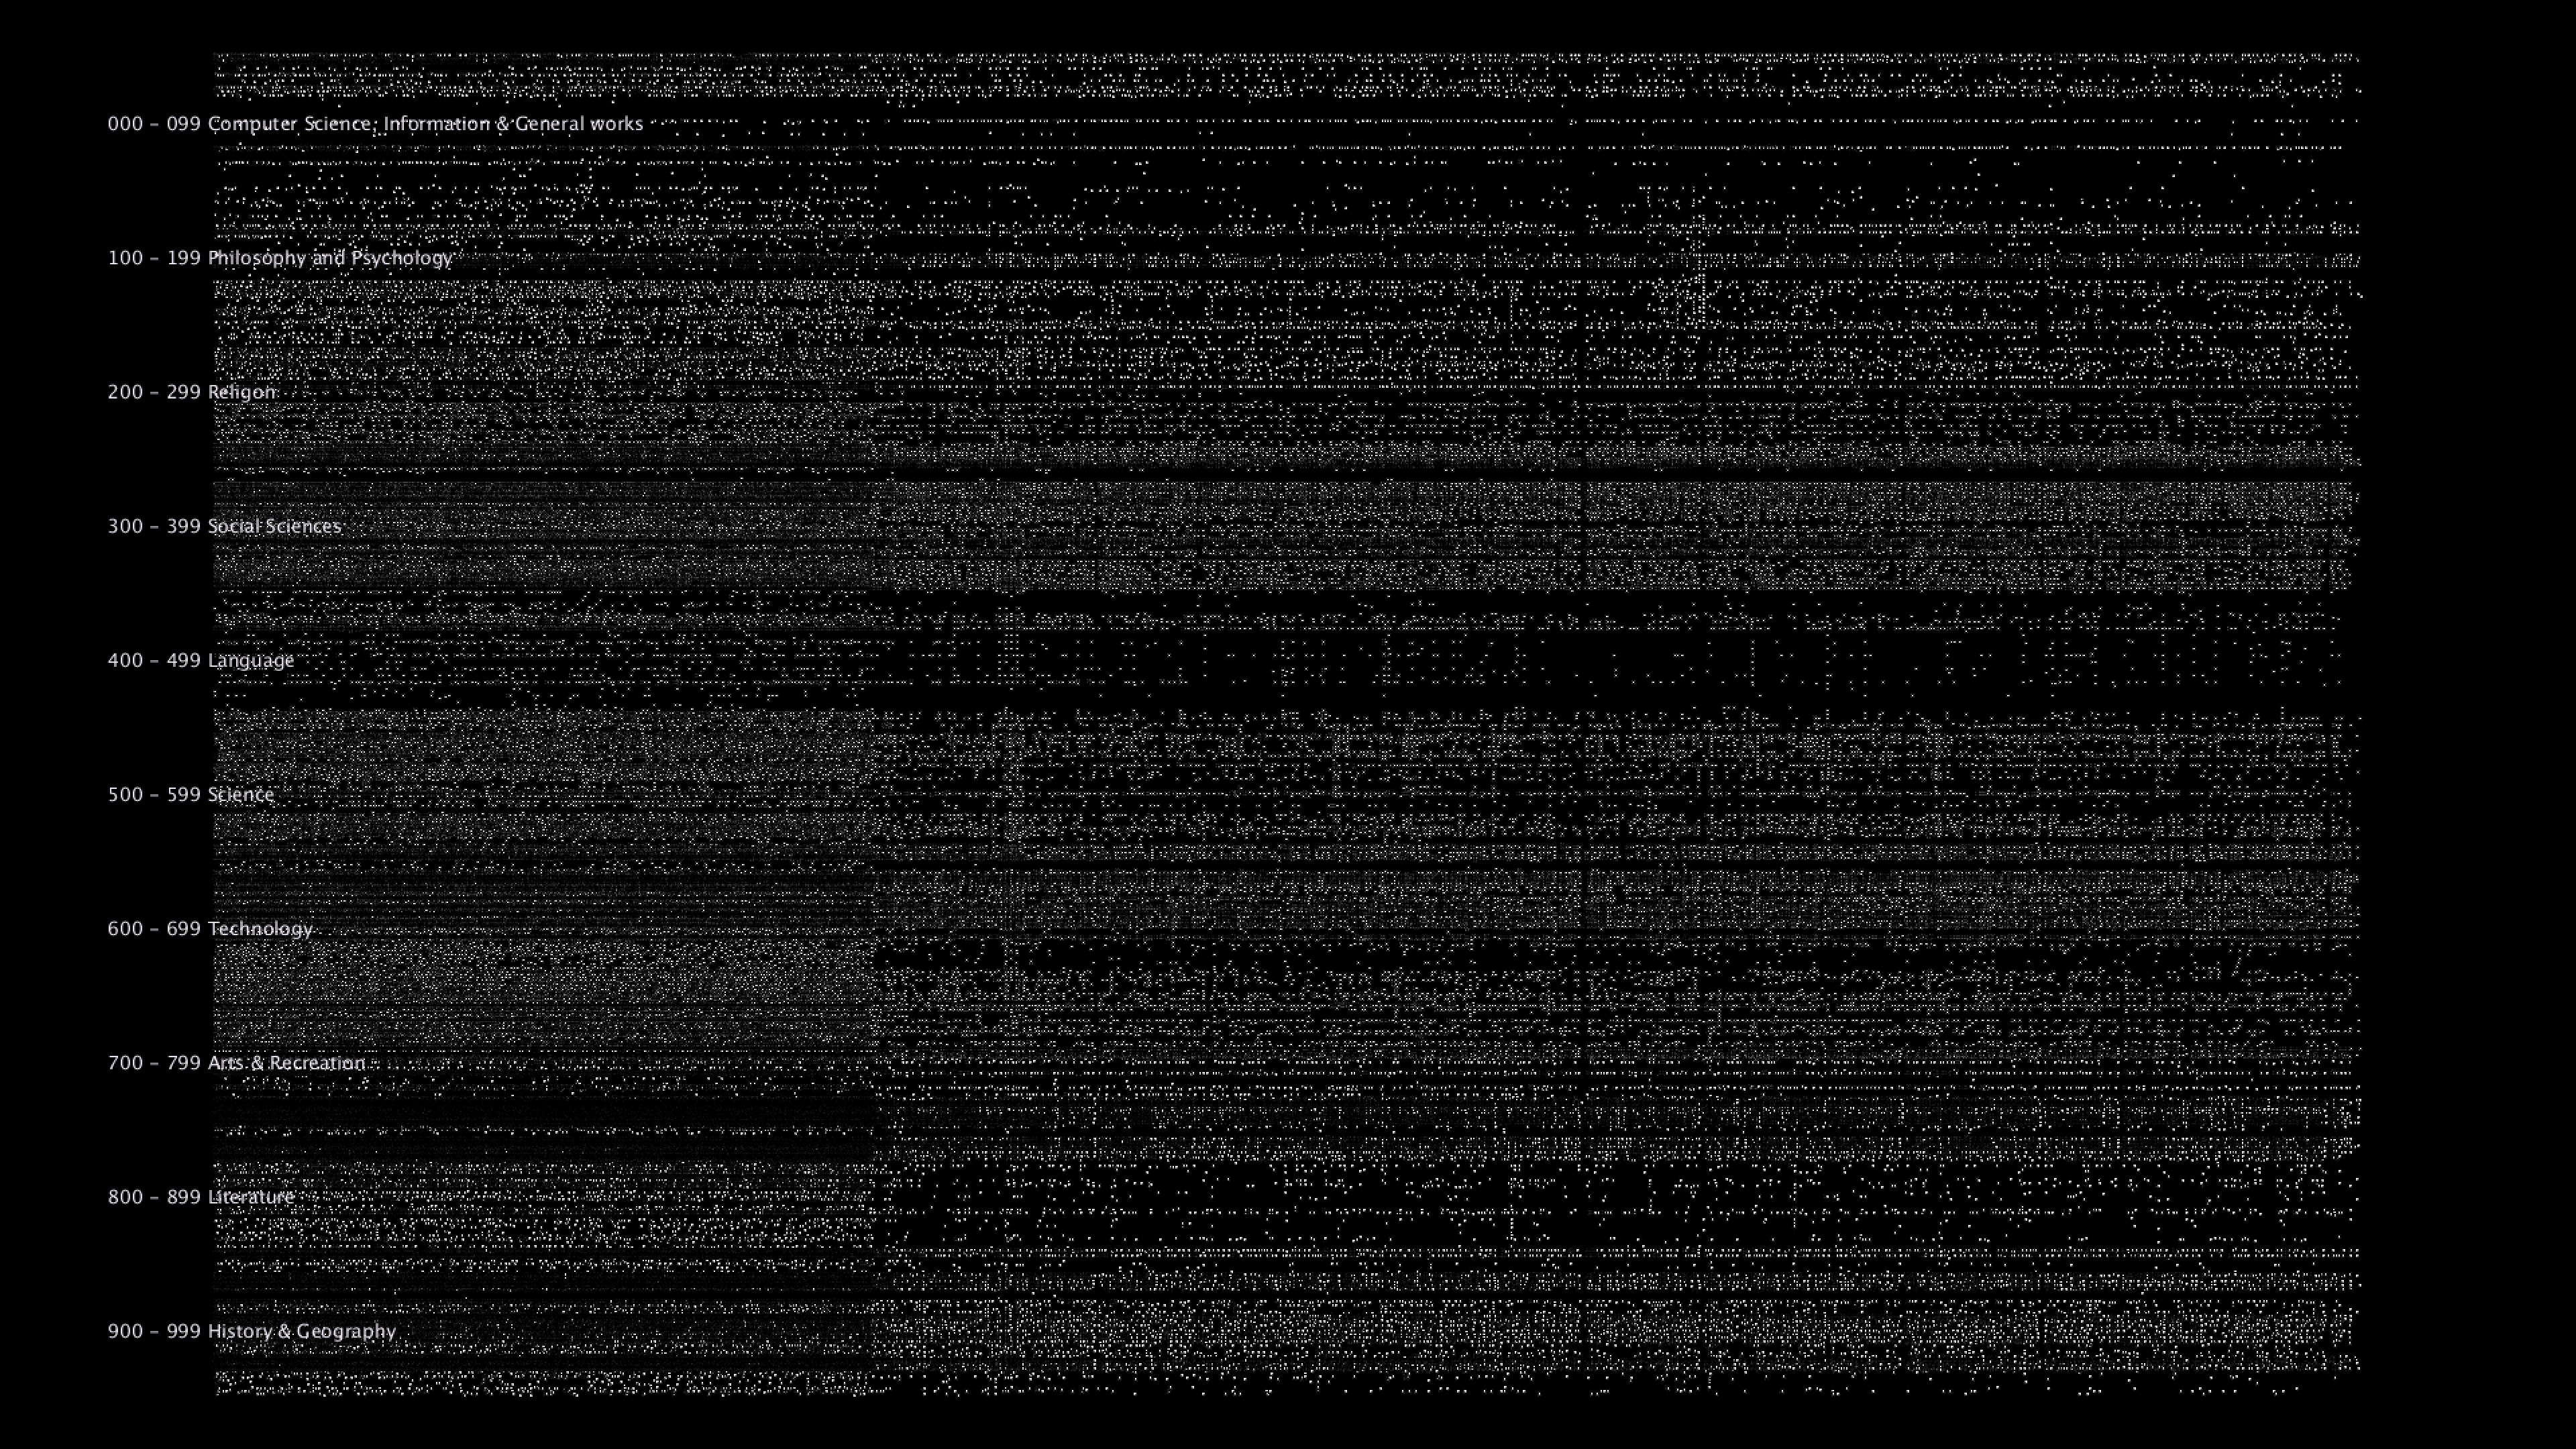
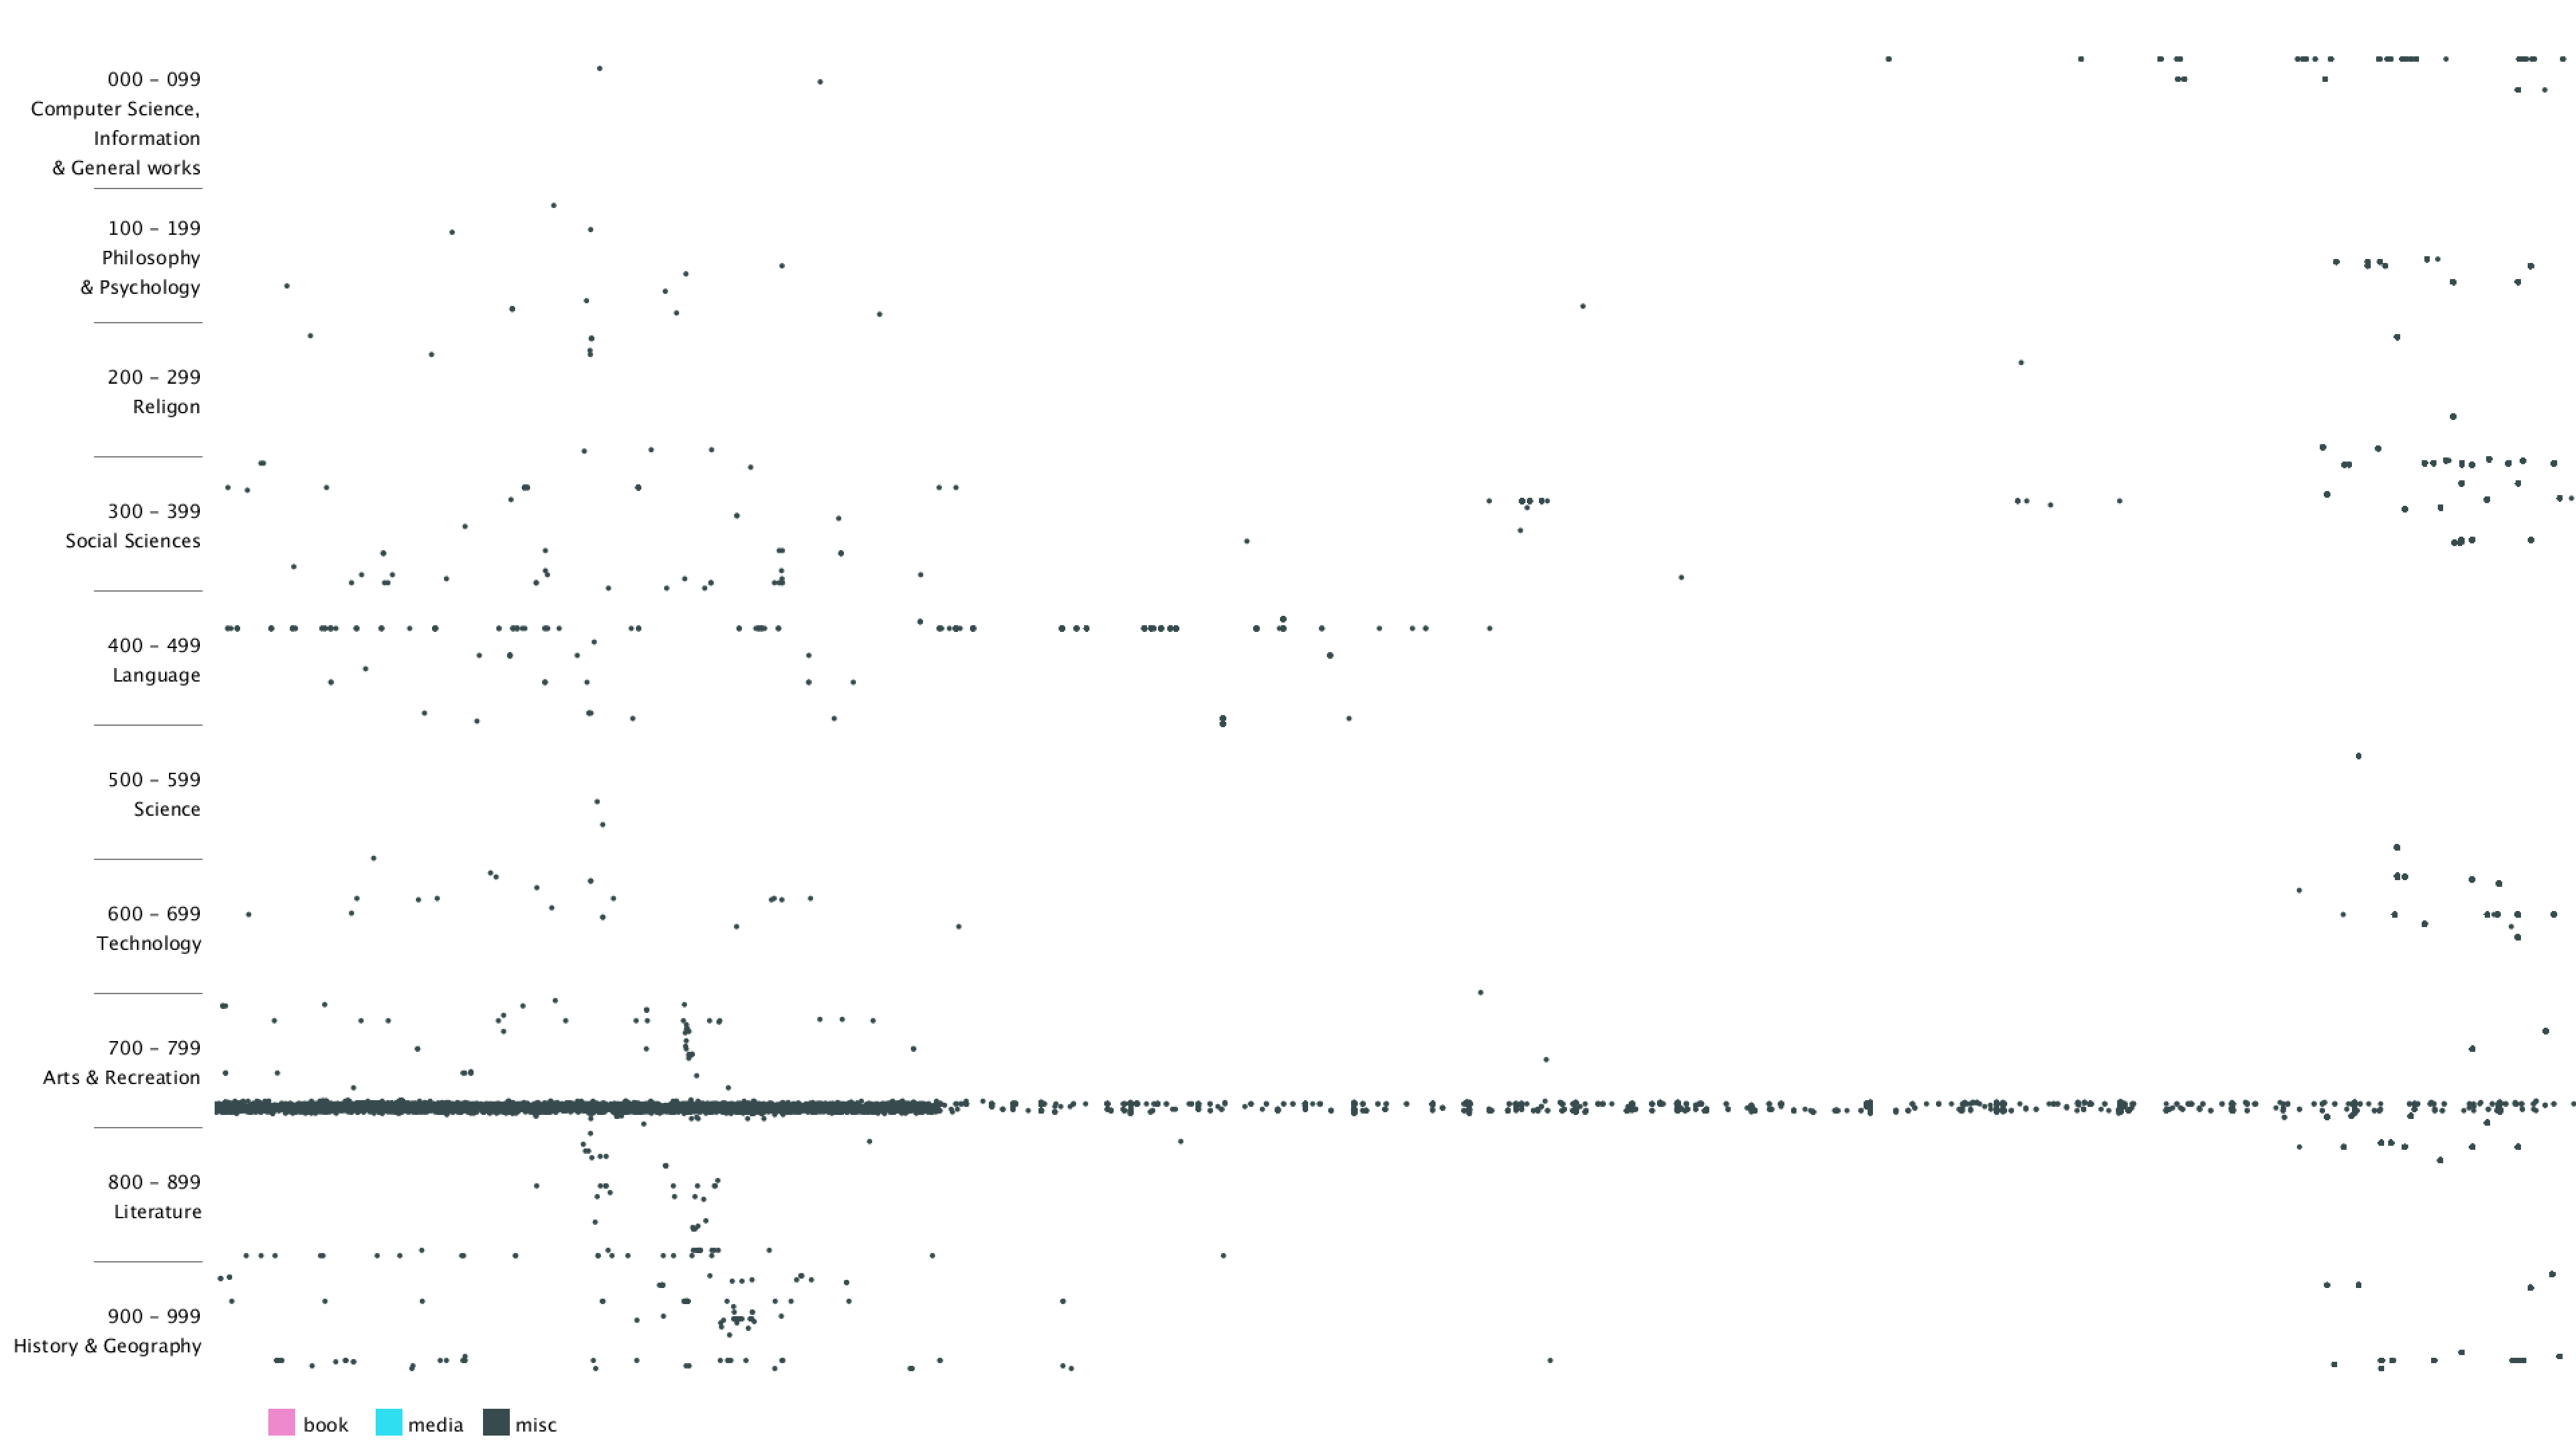
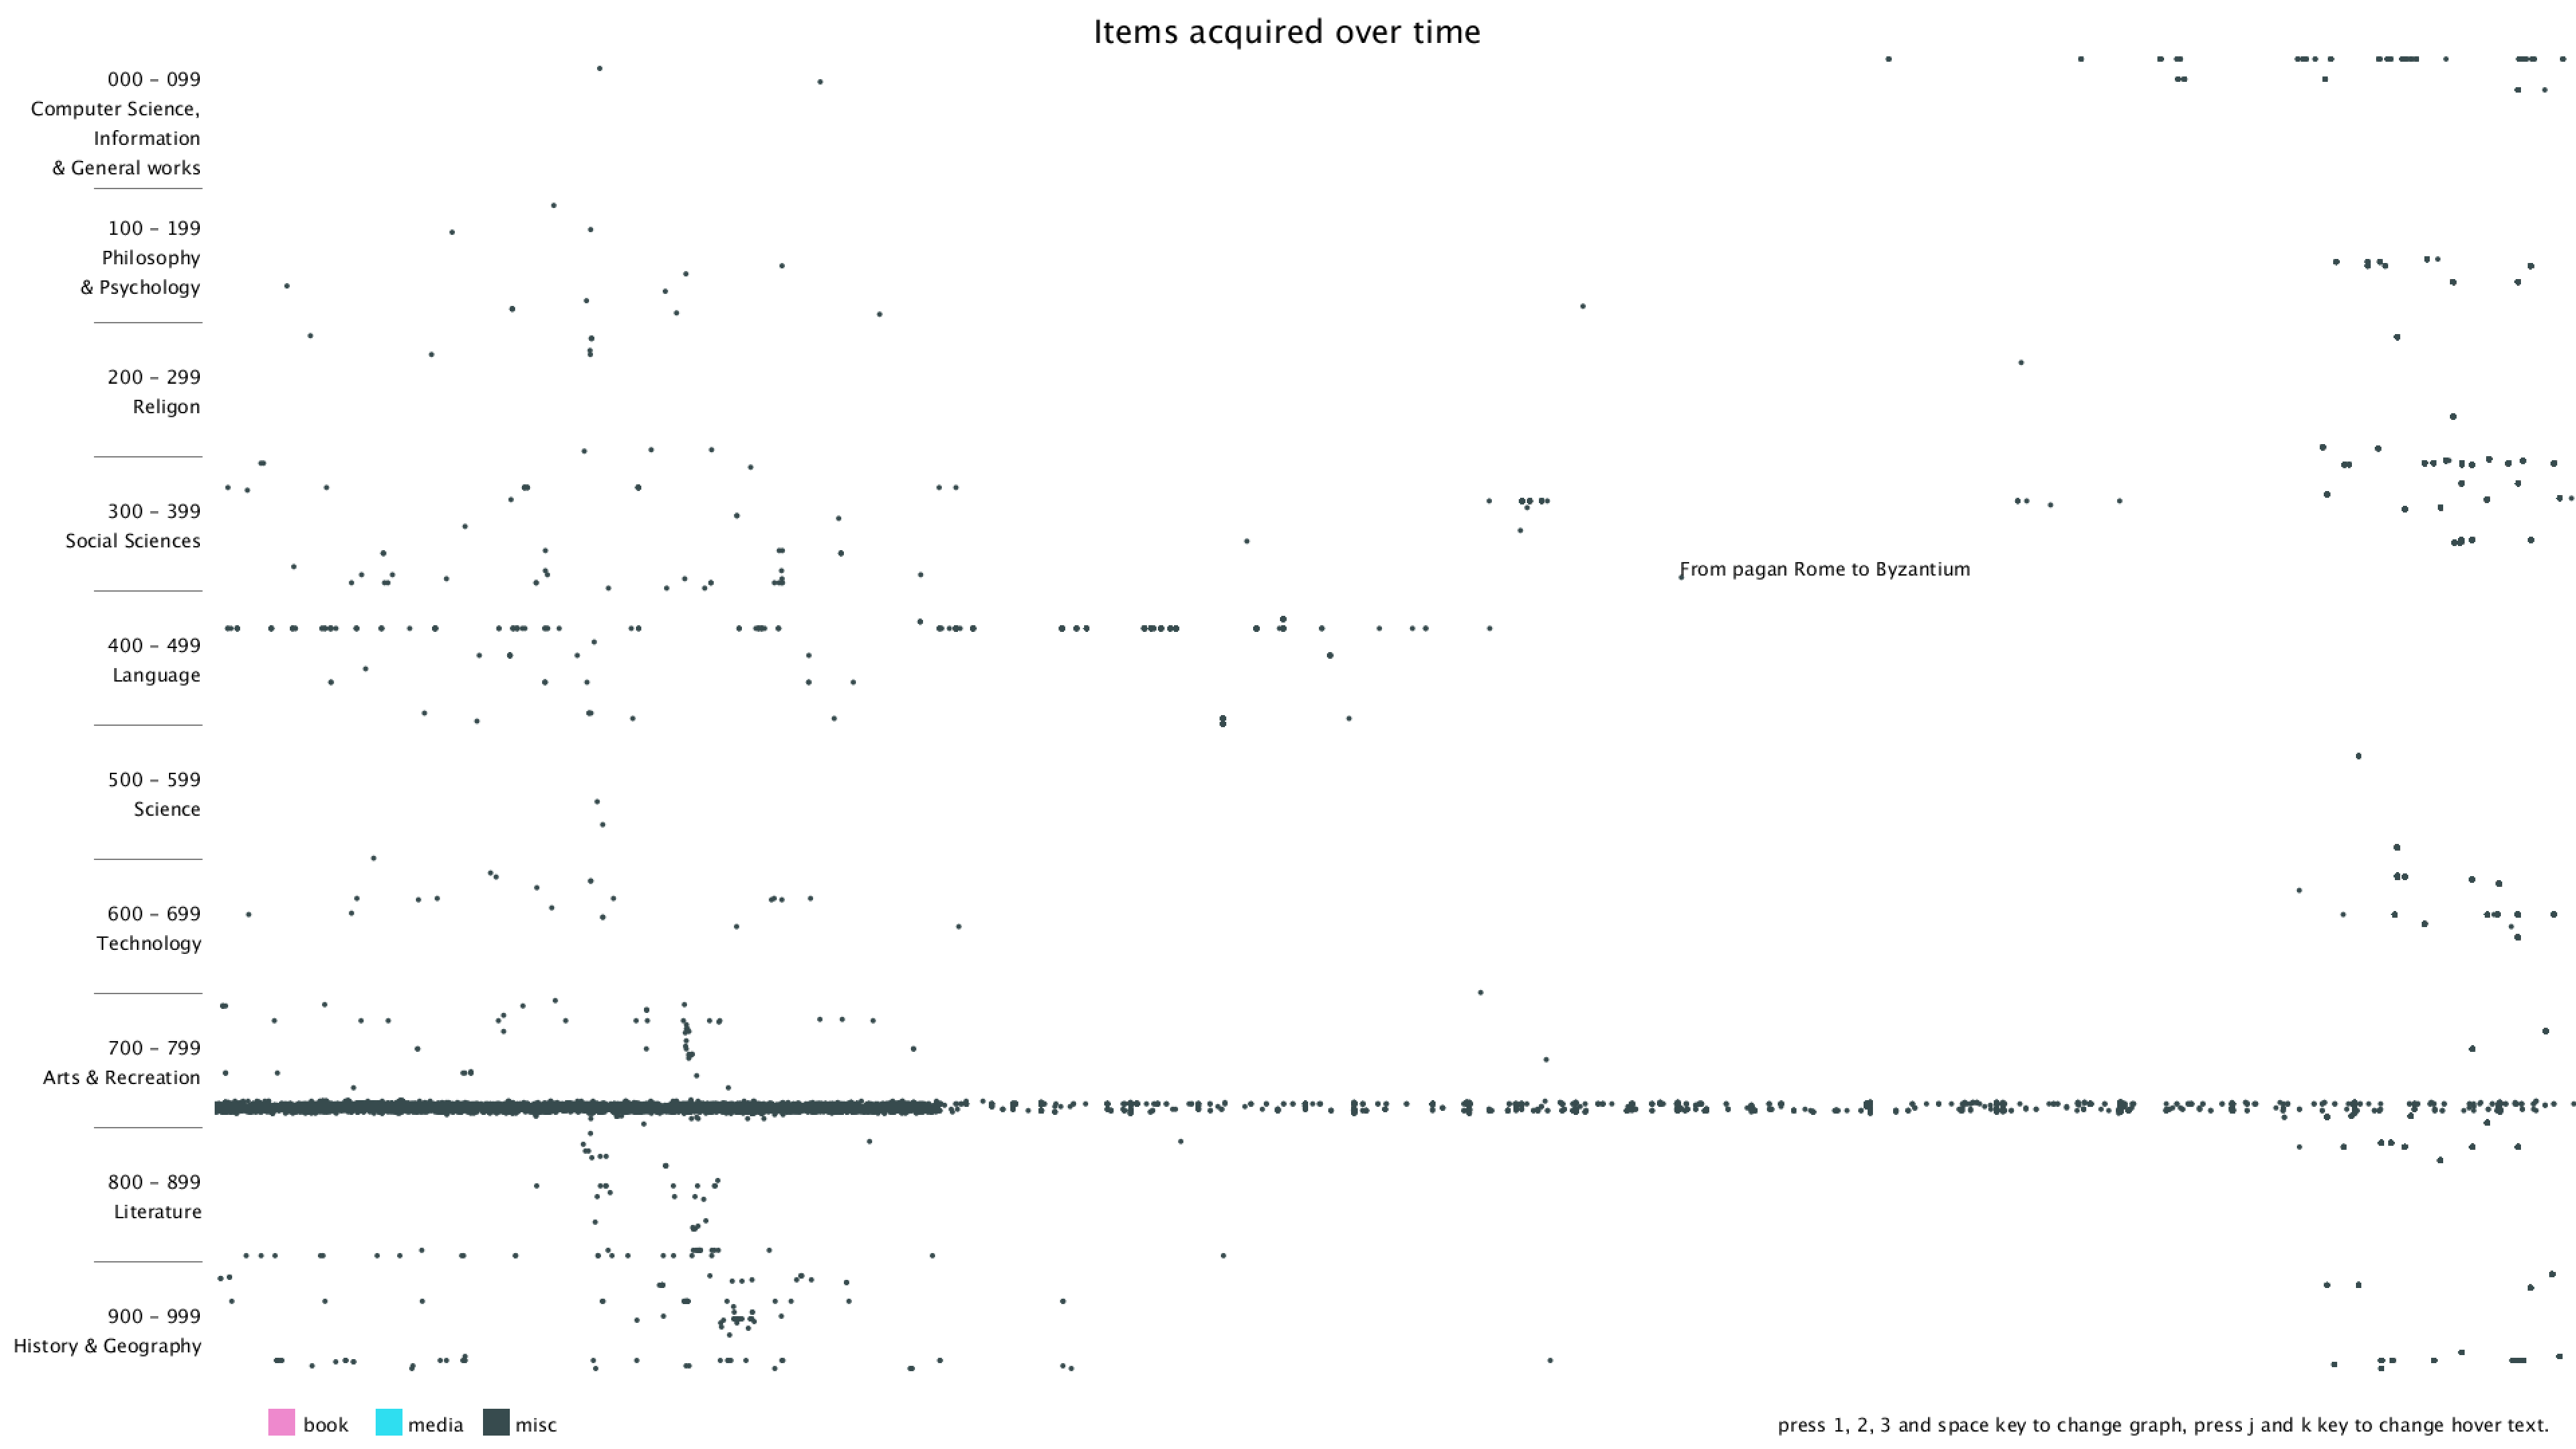
I started with a simple black background and plotting on x-y plane with deweyClass on the y-axis and item number on the x-axis. Since the item number is merely a number that gets incremented over time, it's hard to get the exact time that the item was bought.
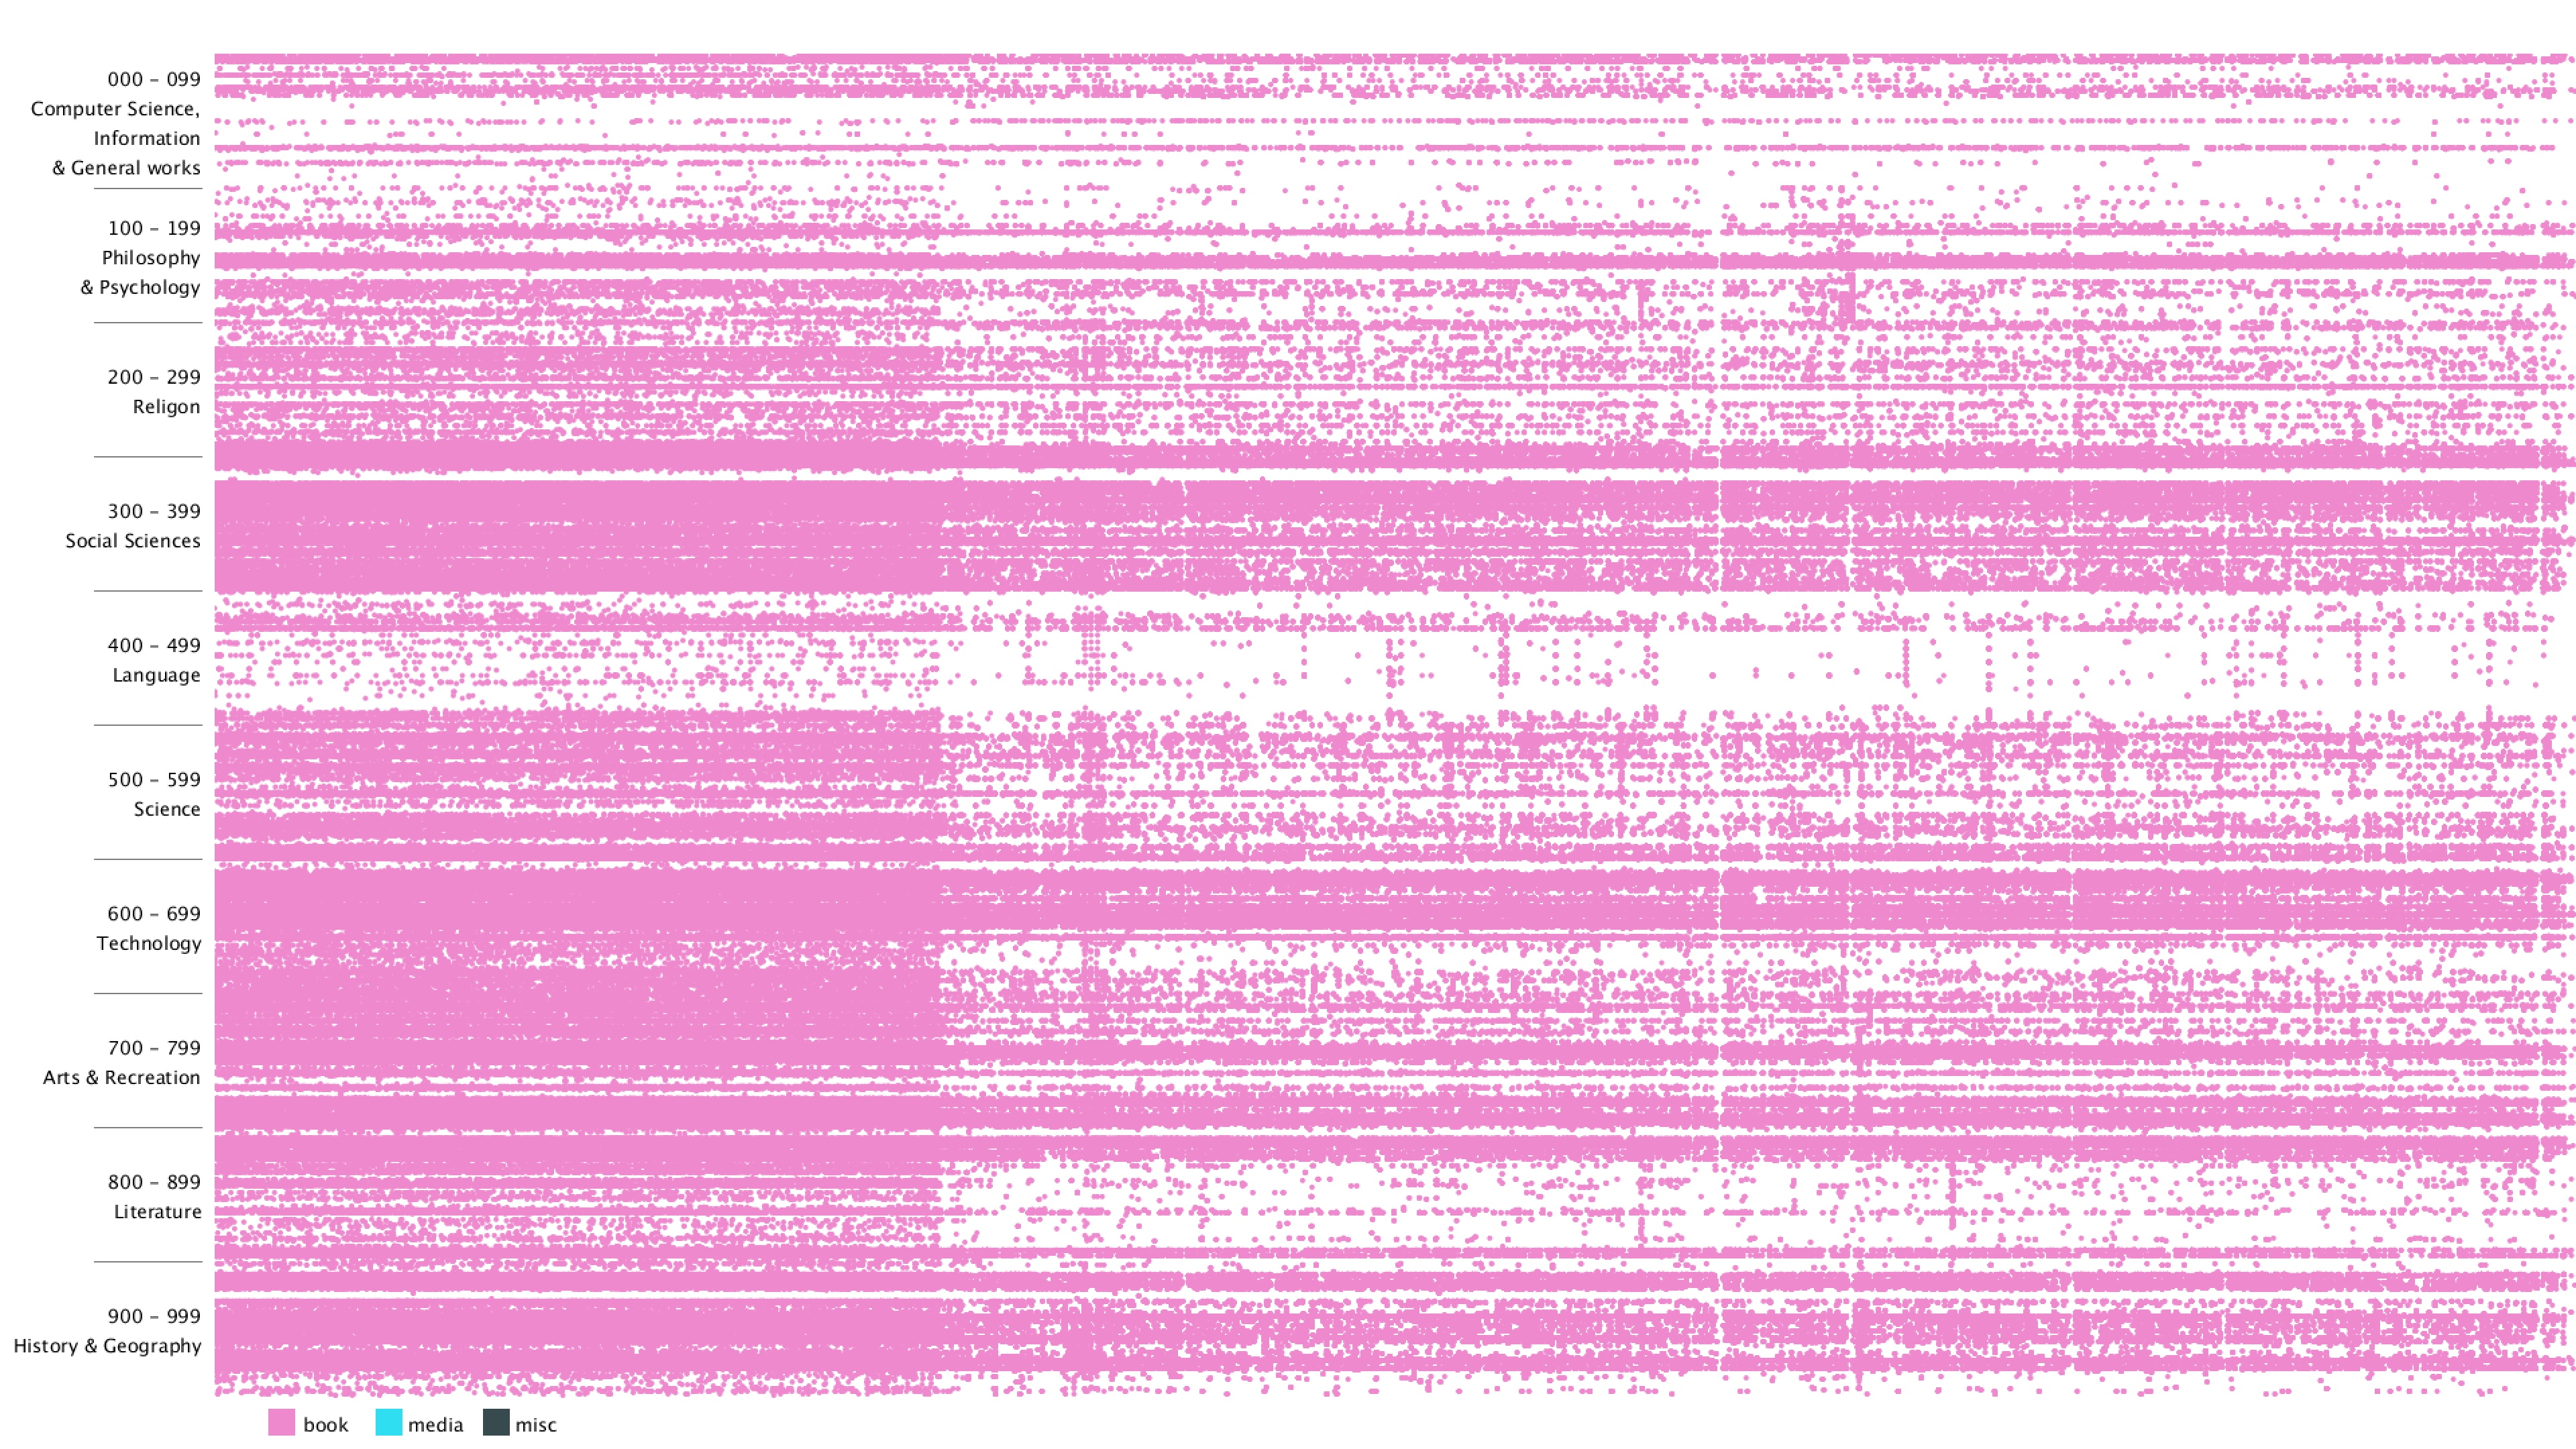
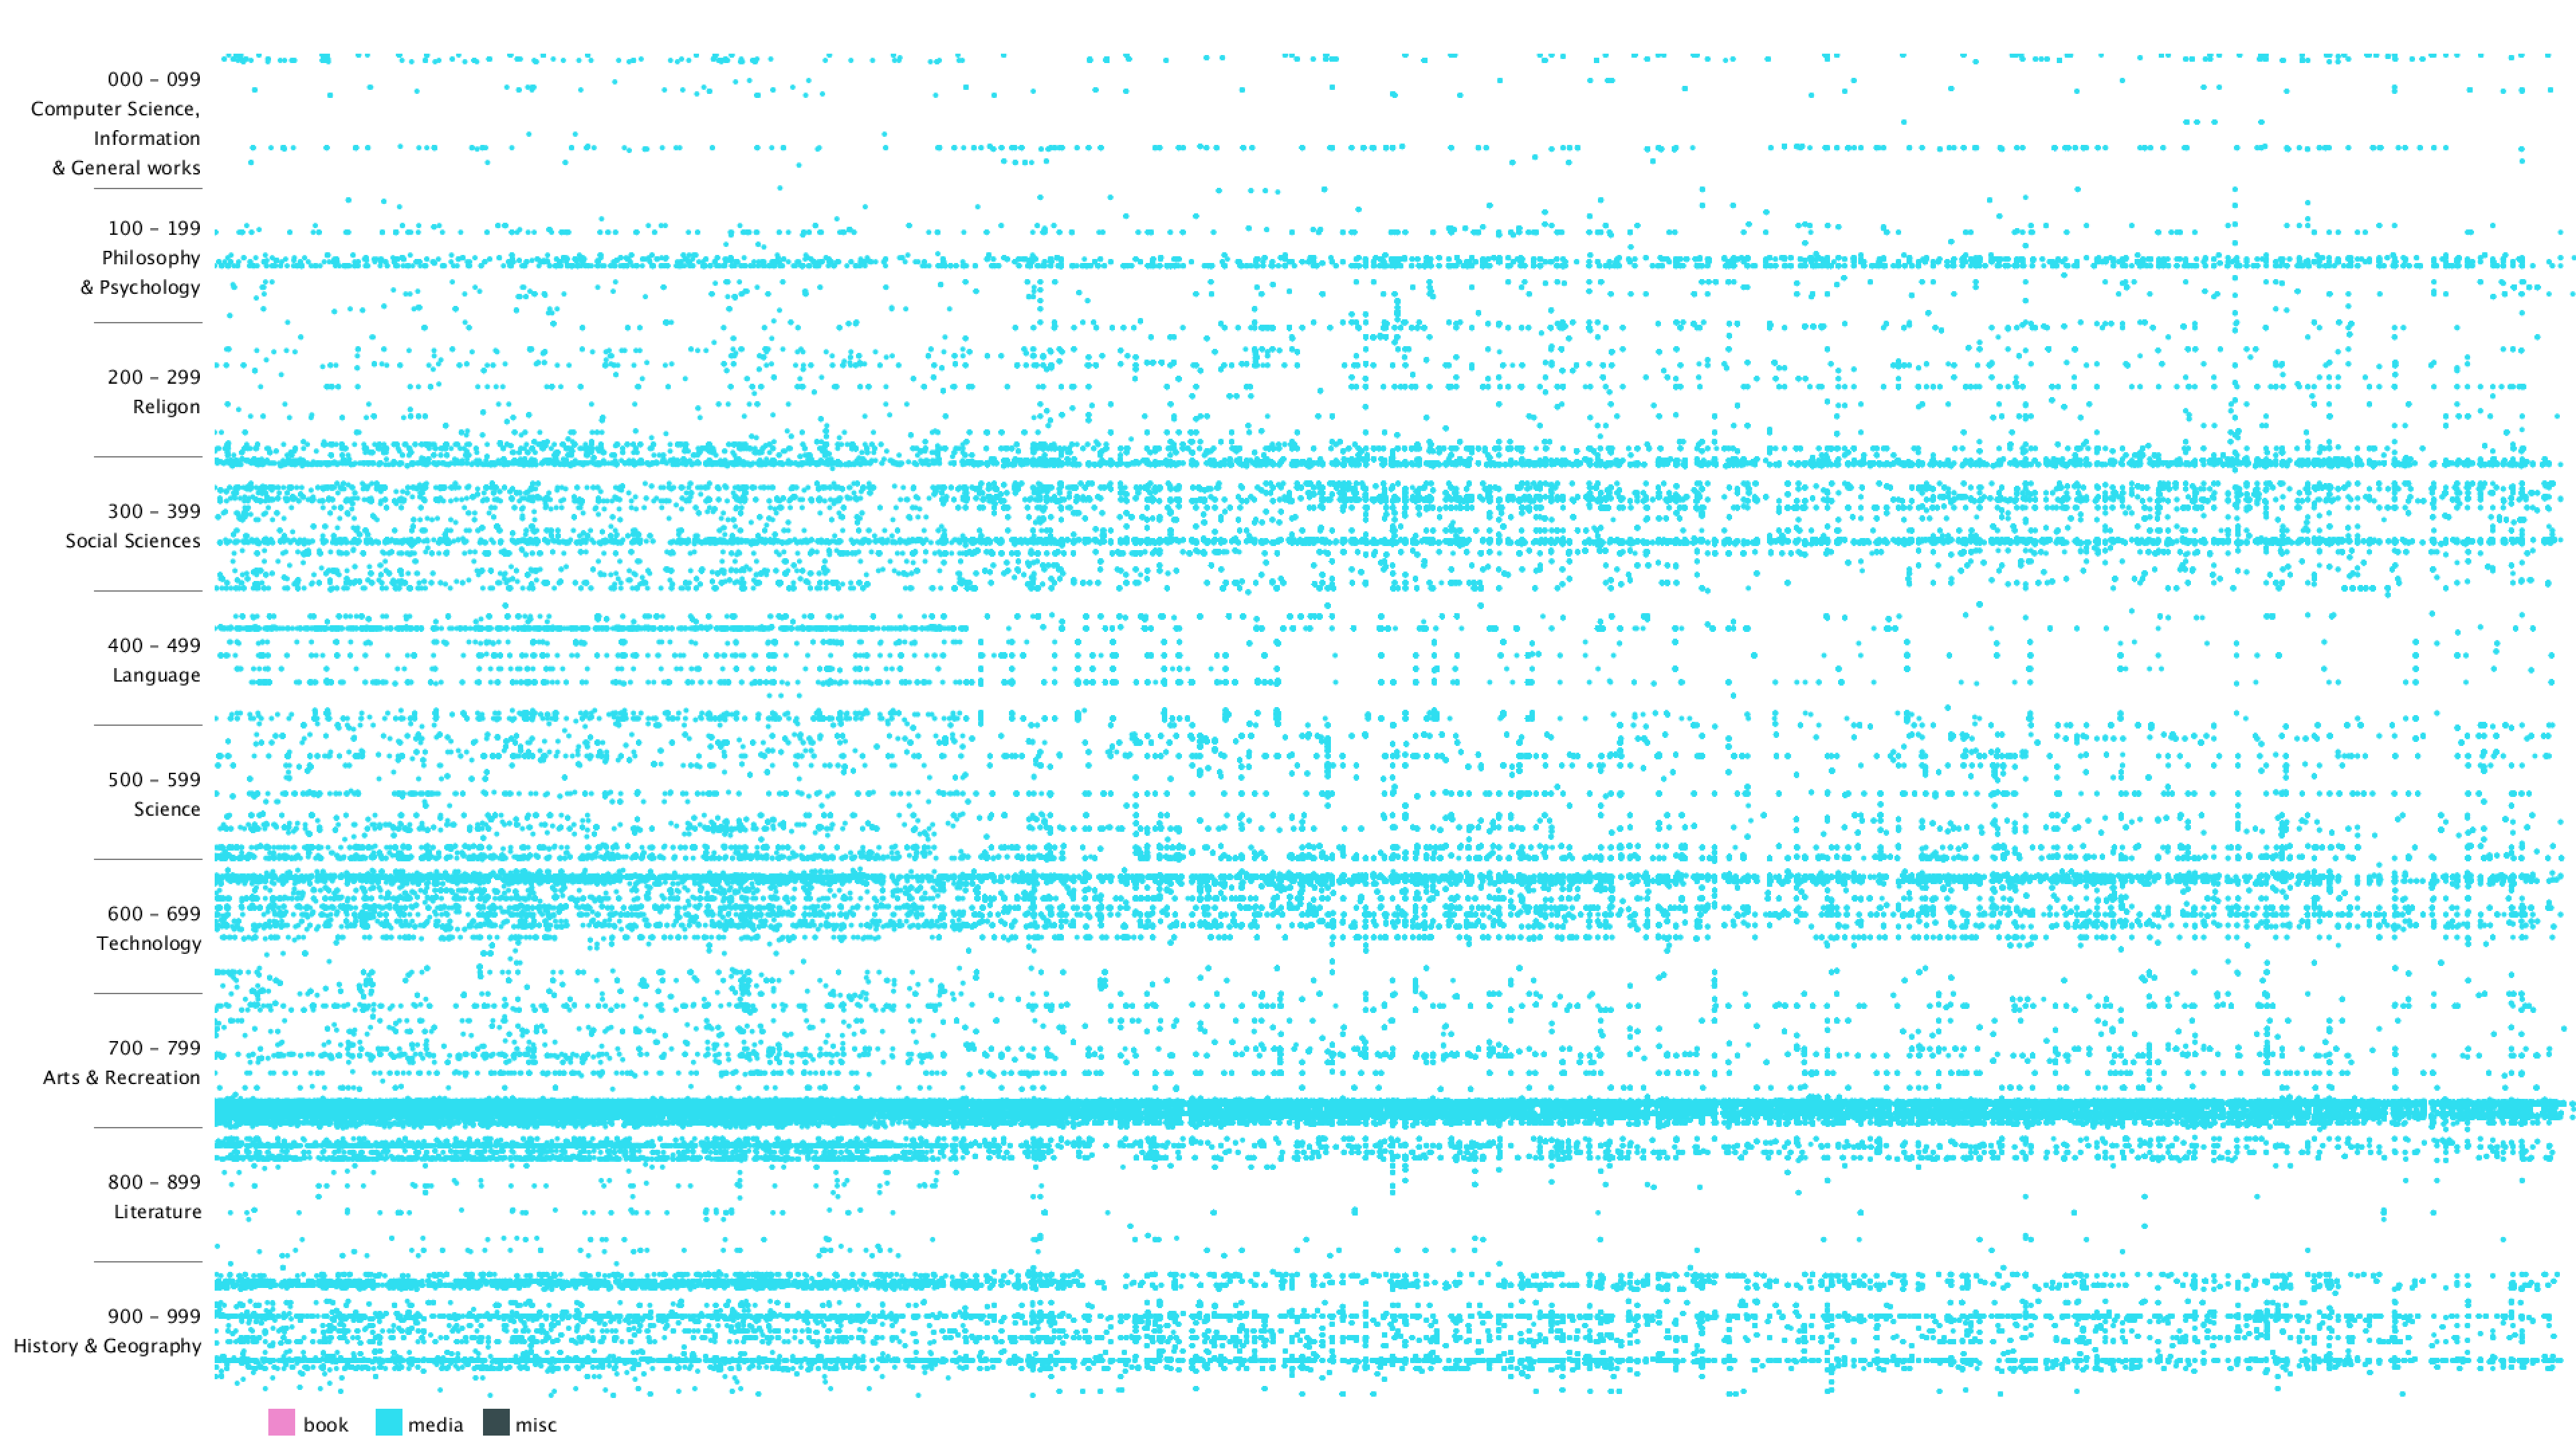
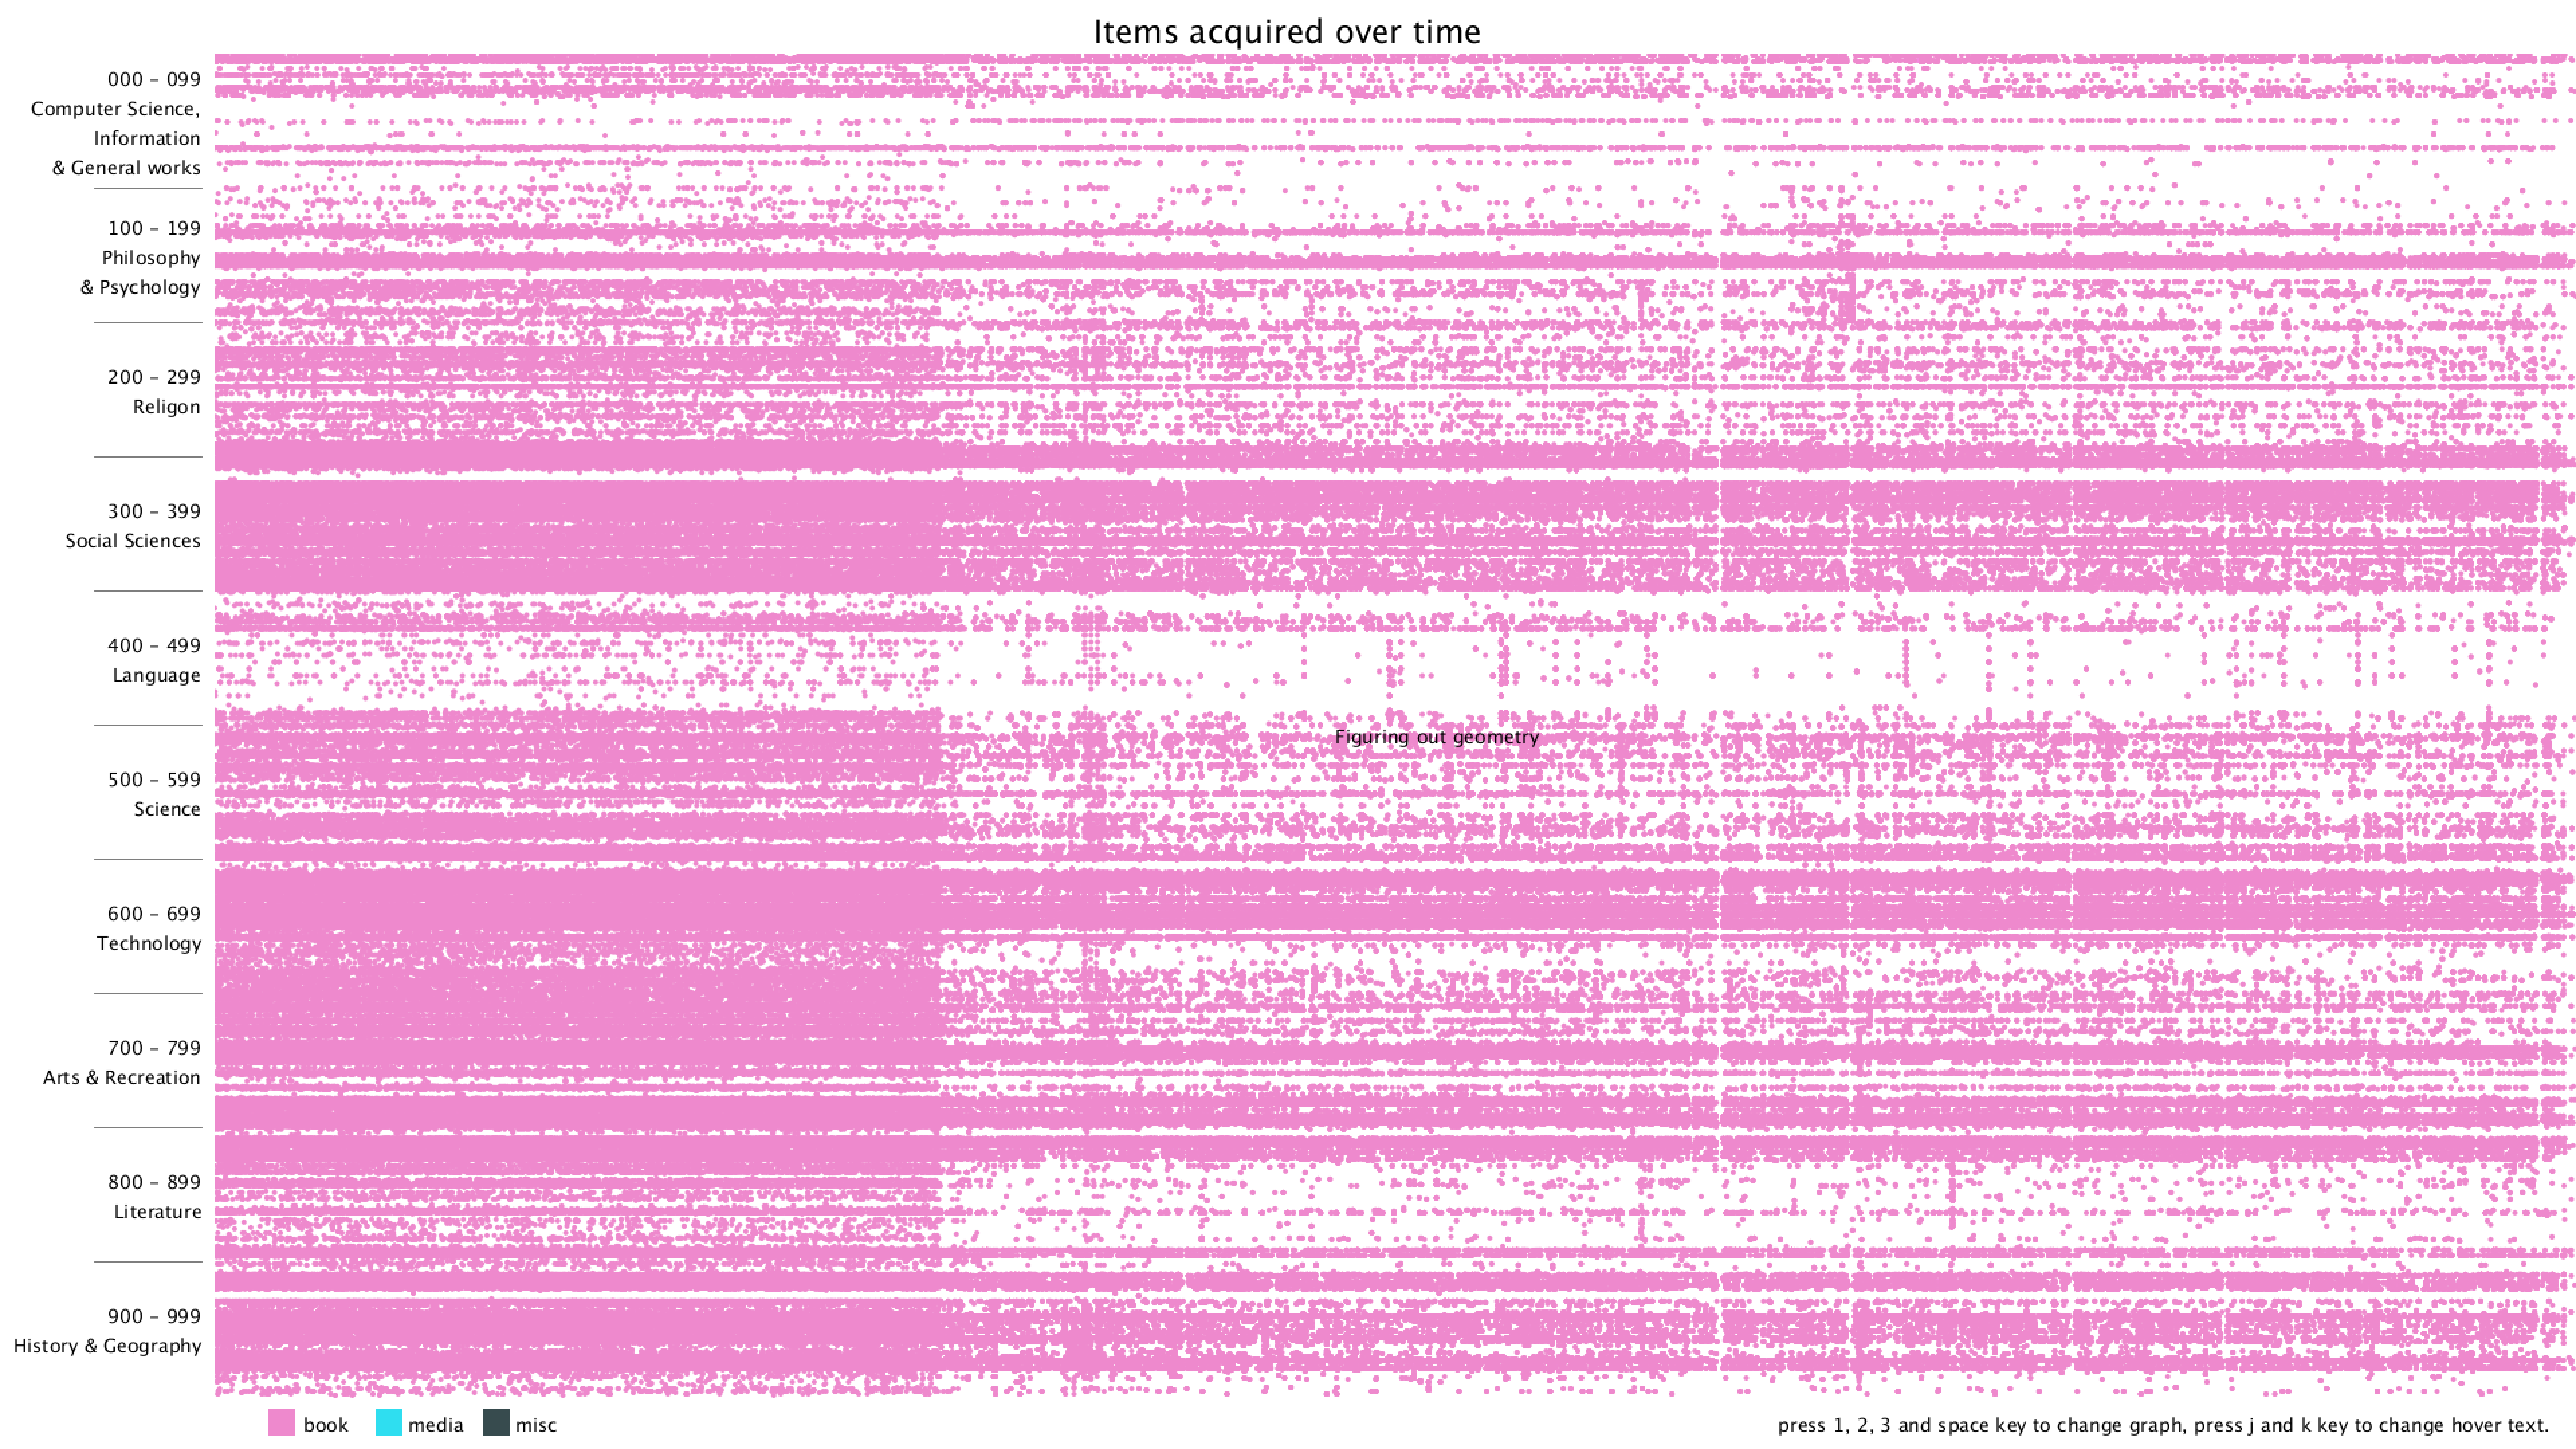
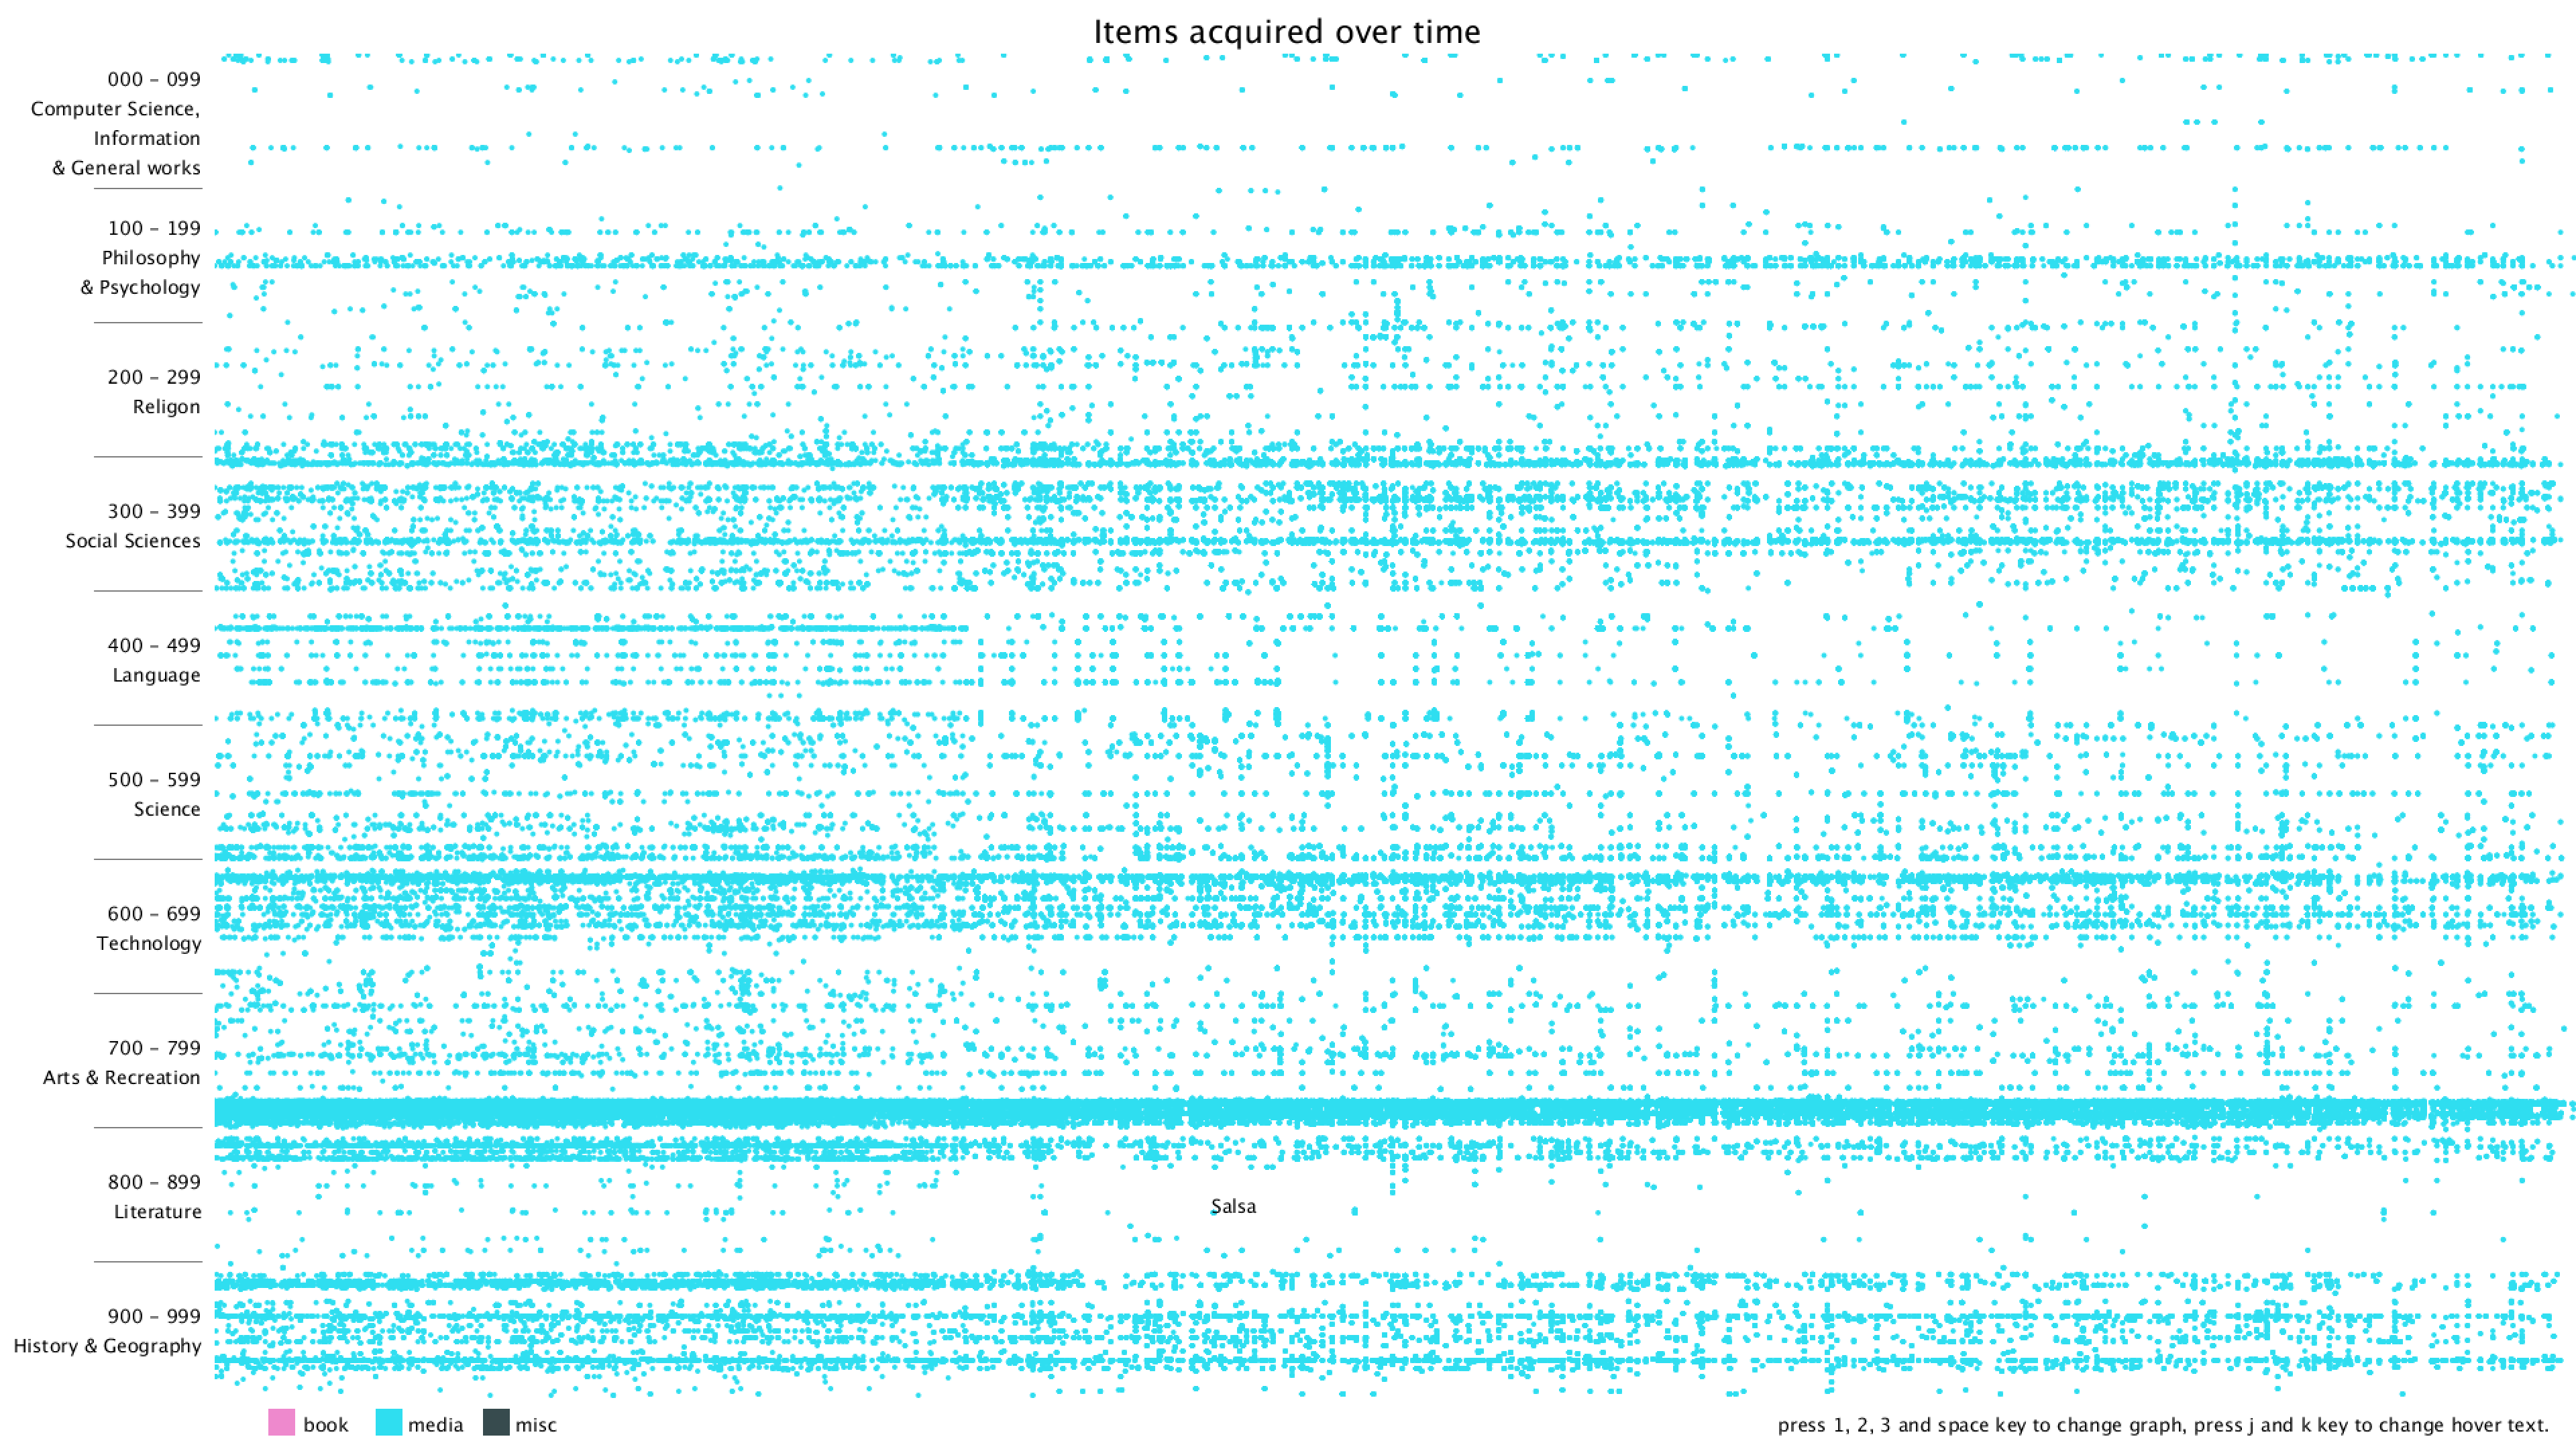
I then changed the background color to white and decided to use three different colors to represent three categories, book, media or misc. I used the color from Maroon 5's album cover "Red Pill Blues".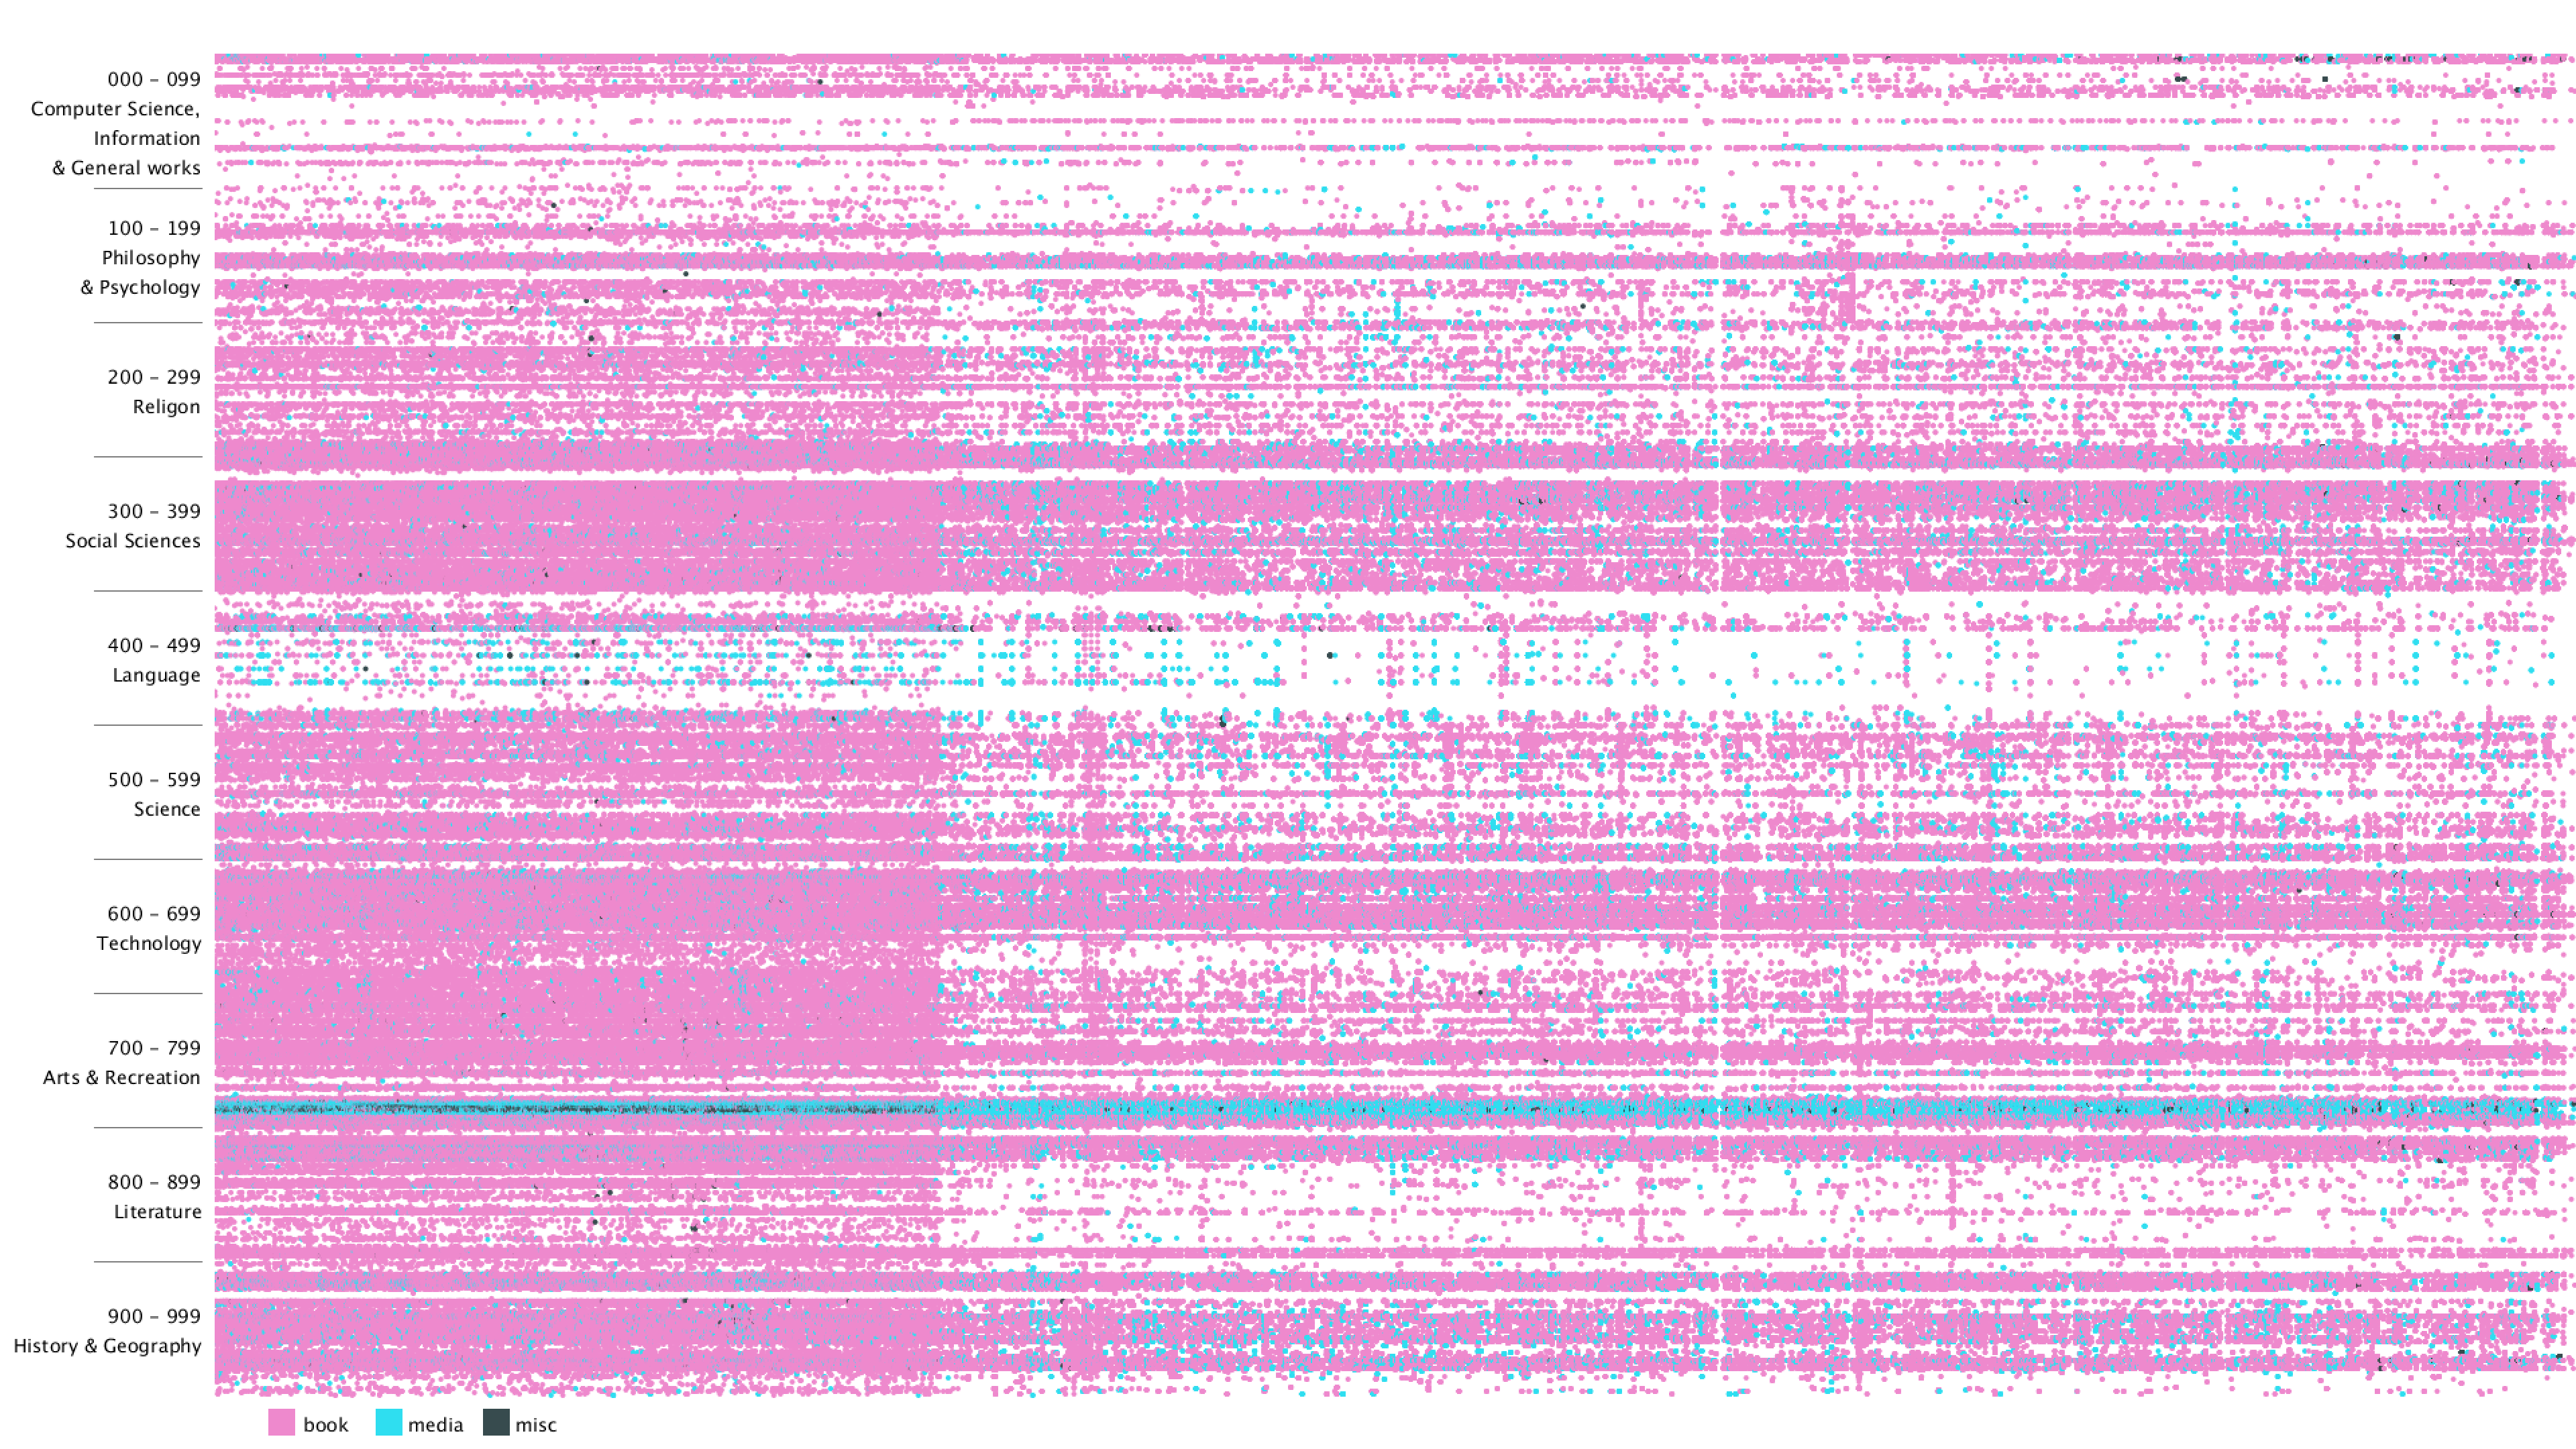
Lastly, I added a title, some instructions on how to use the program, and hover text when moving the mouse over a dot. The hover text can be switched between showing the current dot's Dewey class or showing its title.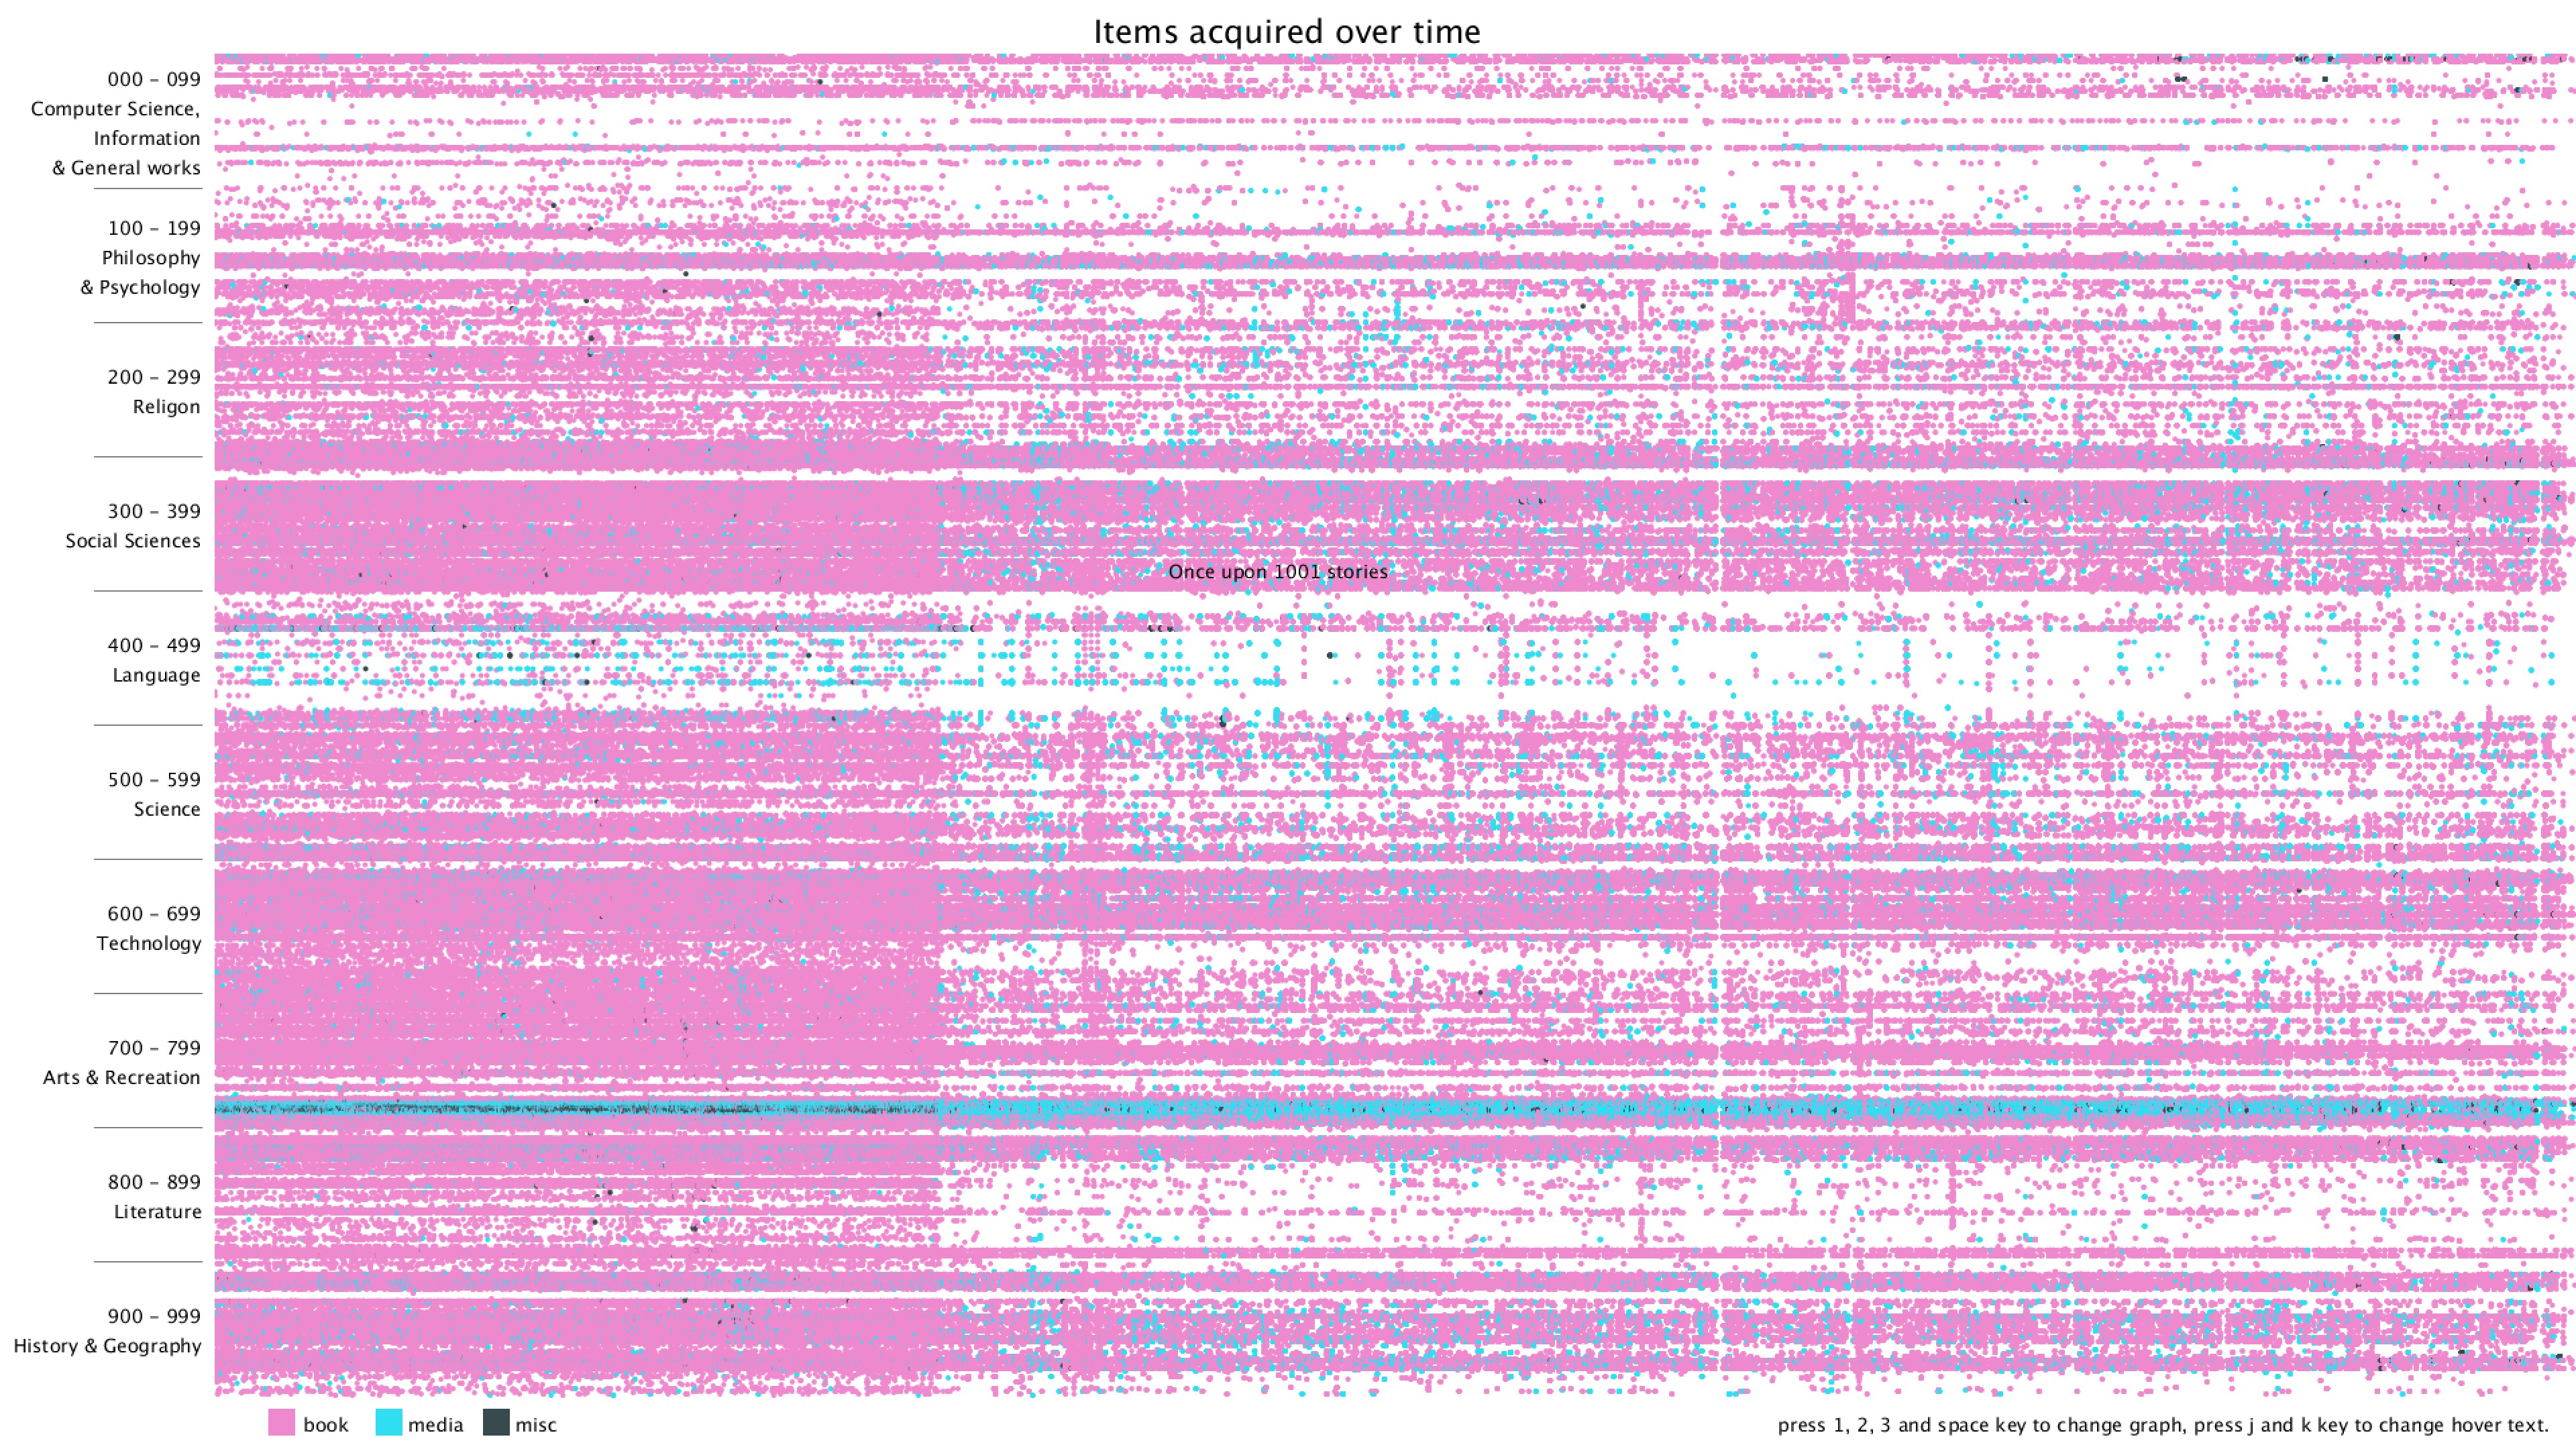

I started with a simple black background and plotting on x-y plane with deweyClass on the y-axis and item number on the x-axis. Since the item number is merely a number that gets incremented over time, it's hard to get the exact time that the item was bought.
I then changed the background color to white and decided to use three different colors to represent three categories, book, media or misc. I used the color from Maroon 5's album cover "Red Pill Blues".
Lastly, I added a title, some instructions on how to use the program, and hover text when moving the mouse over a dot. The hover text can be switched between showing the current dot's Dewey class or showing its title.
Final result
I've made a few updates to make the visualization clearer and the program more user-friendly. Changes include:
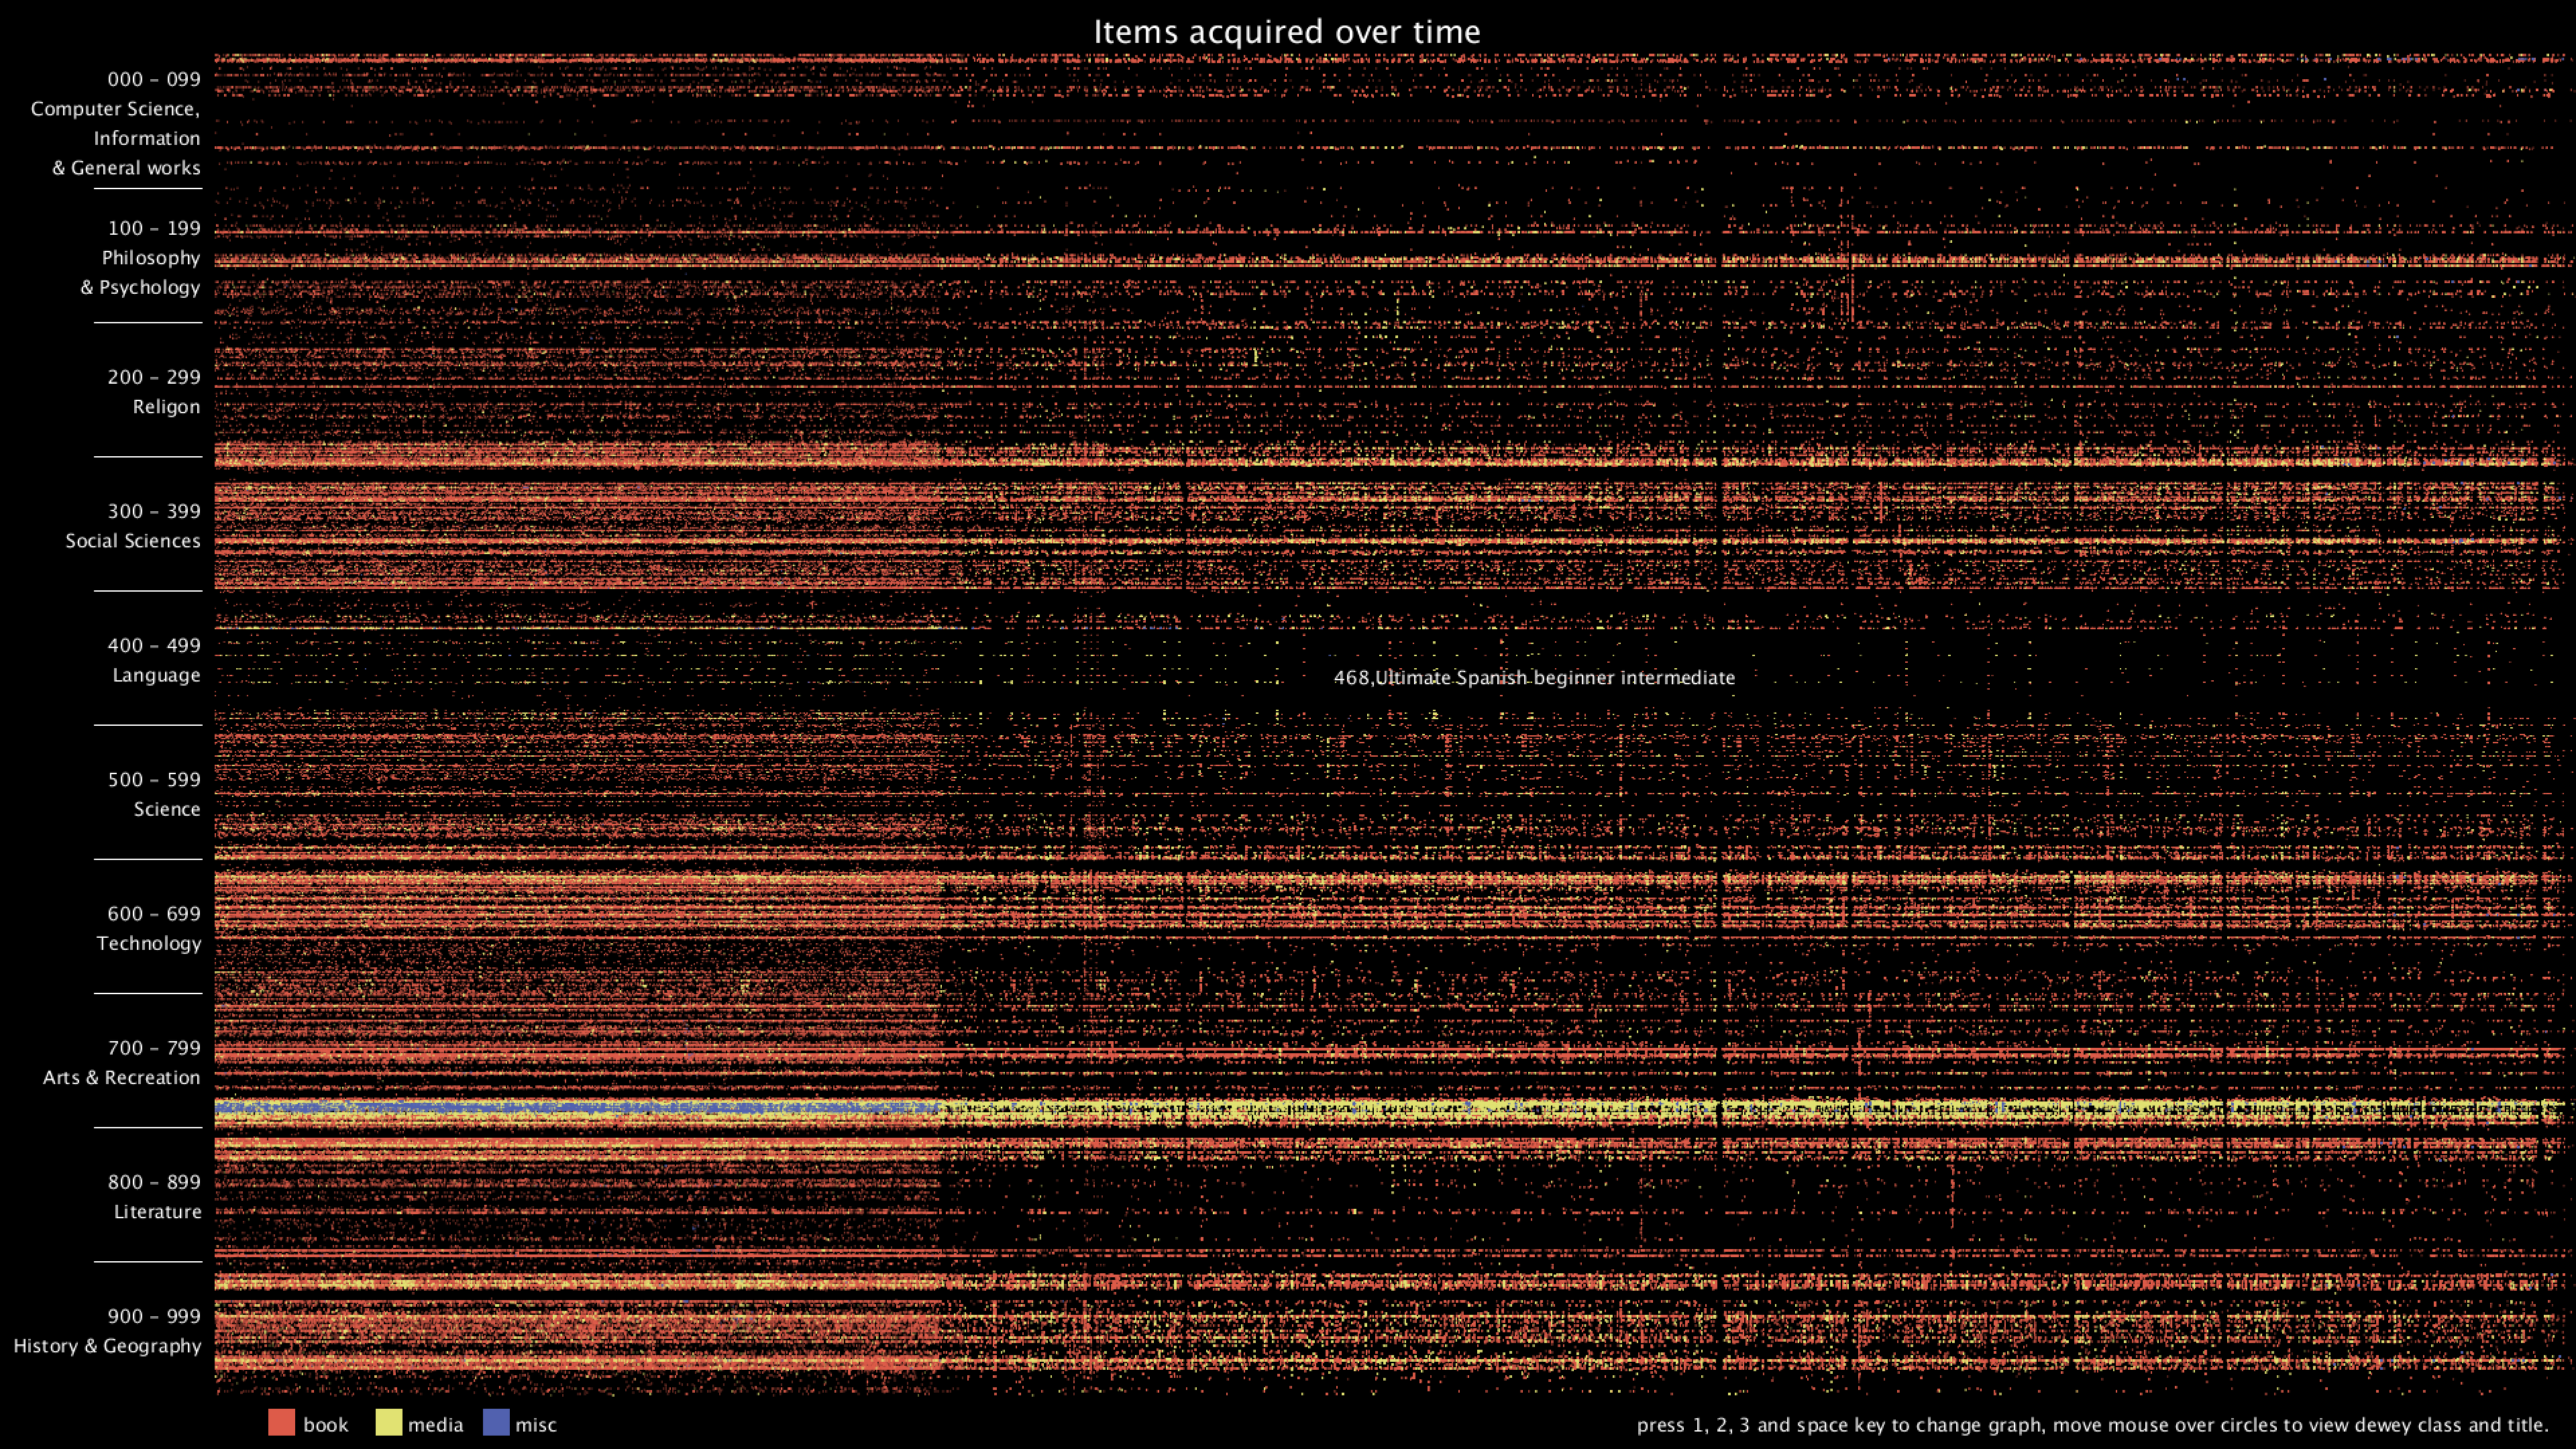
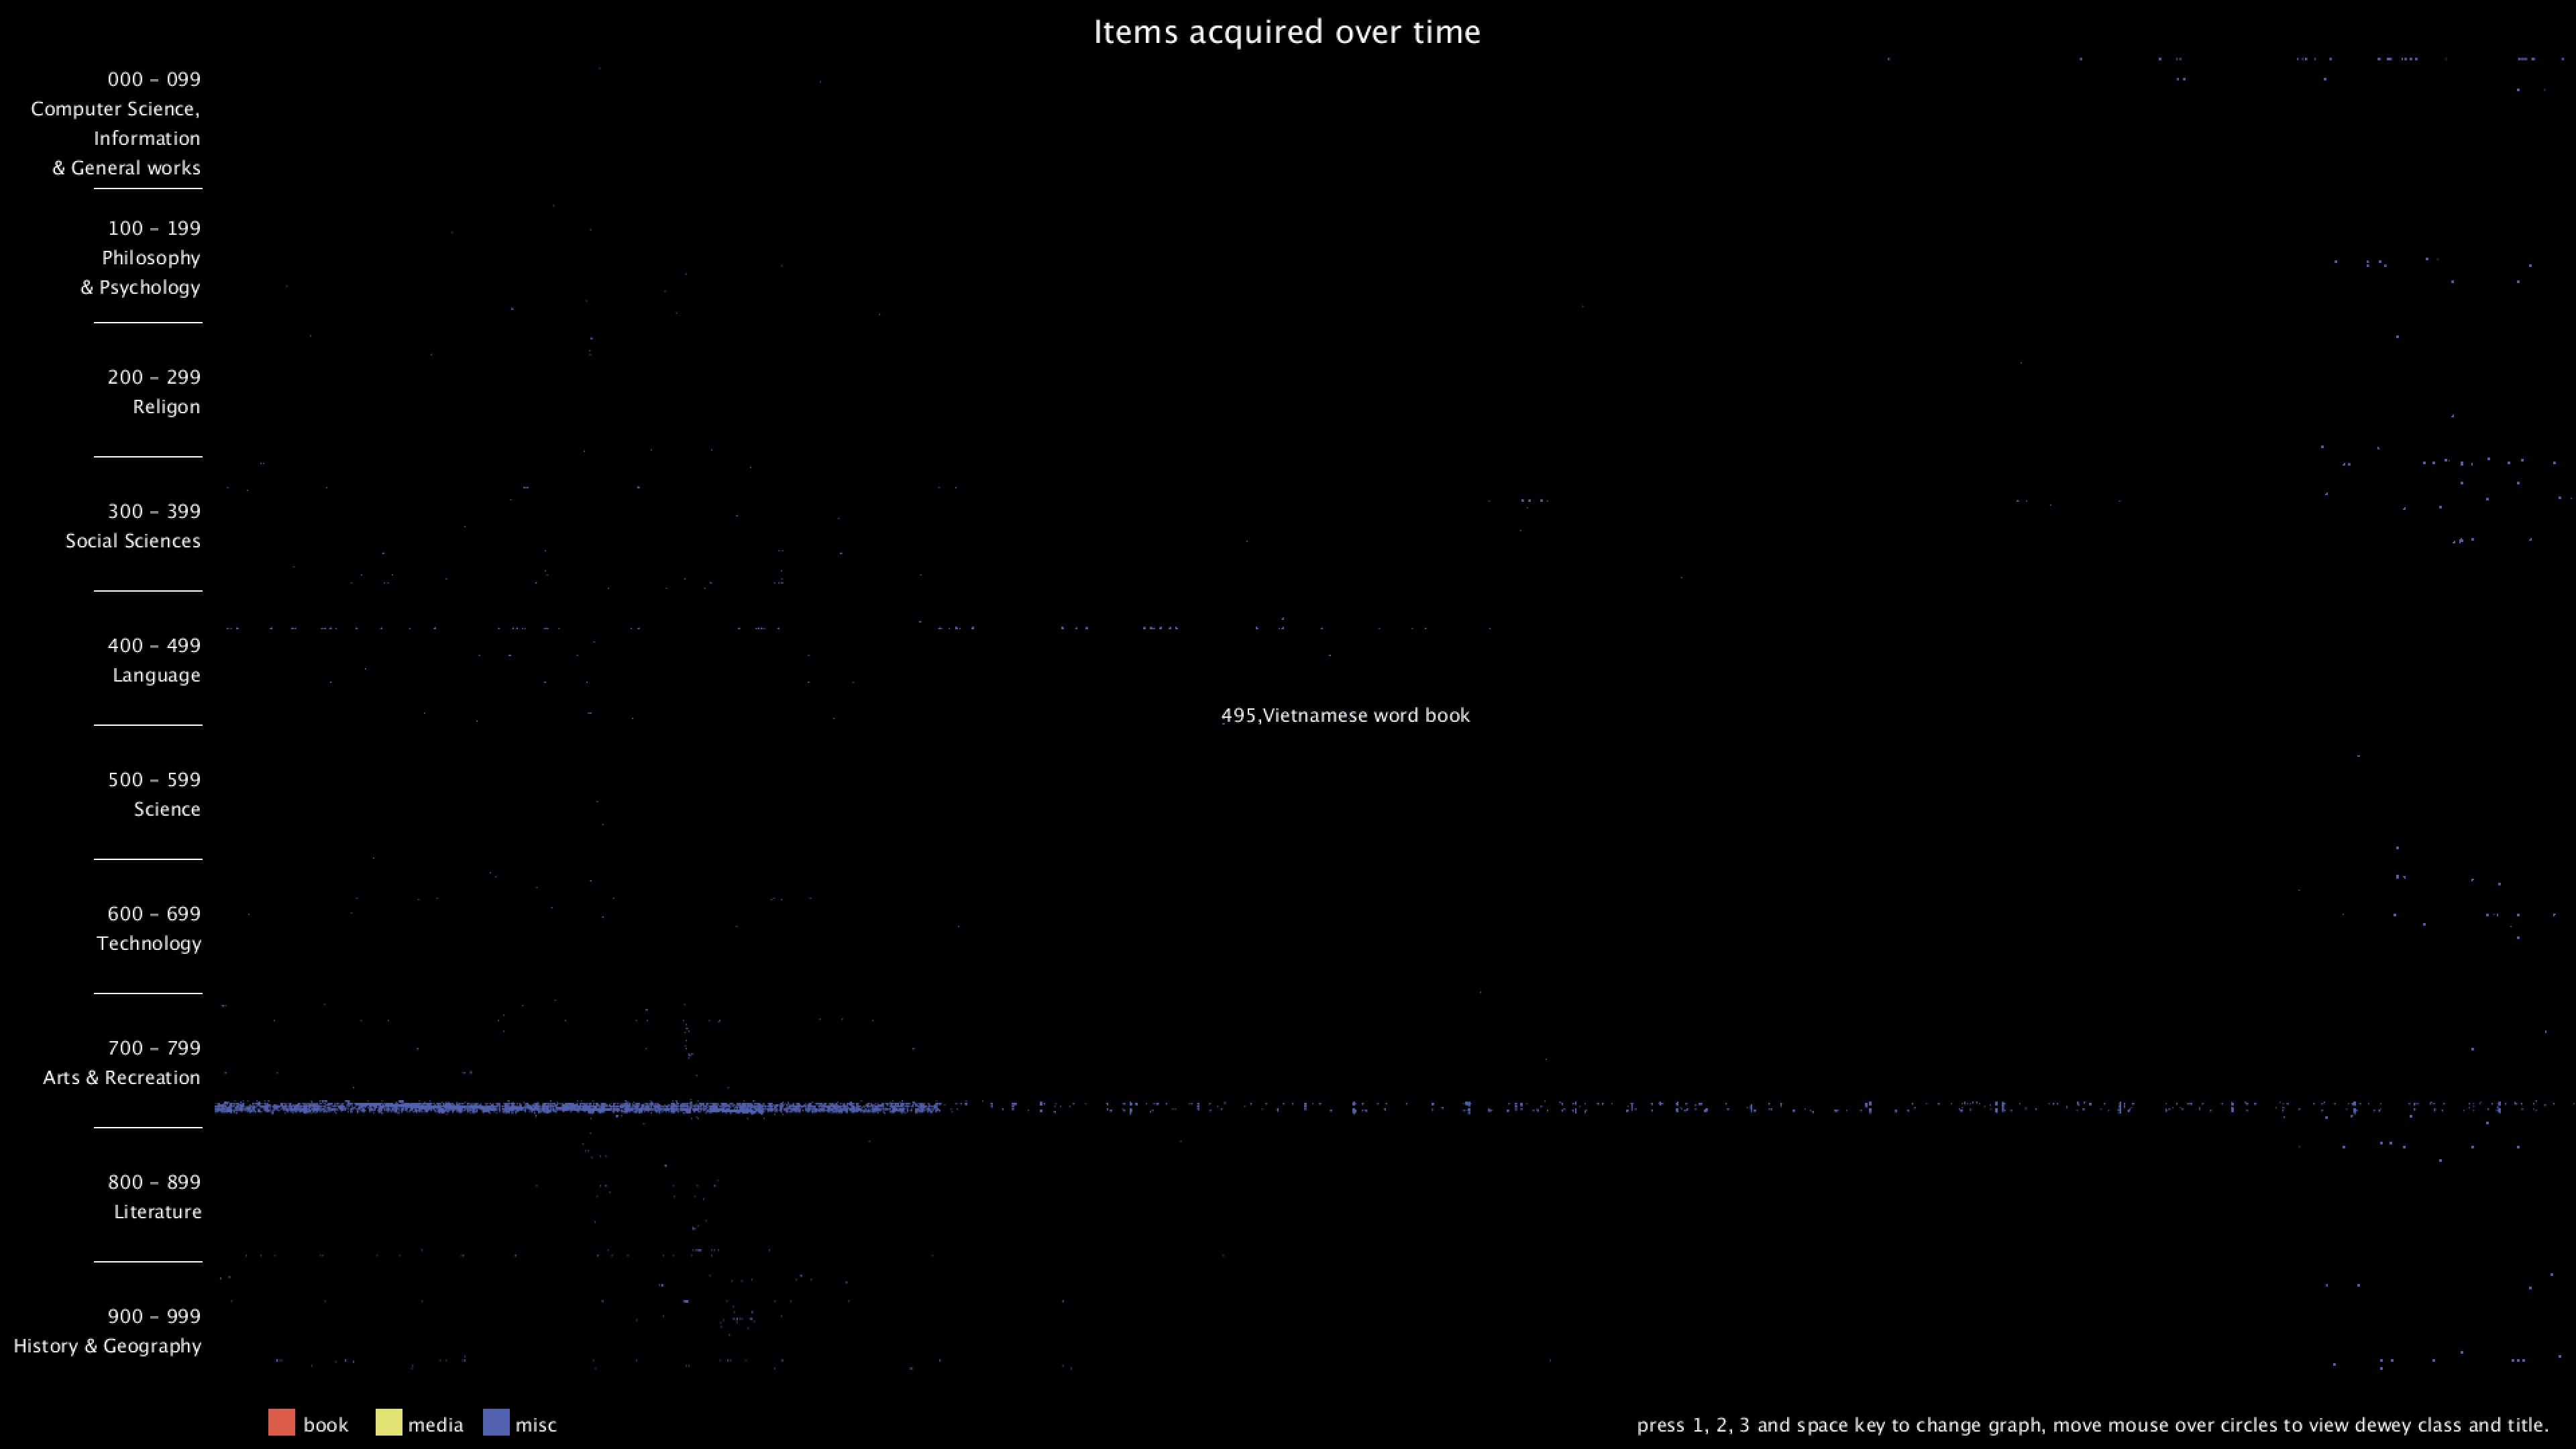
From the graph, we can clearly see that there are distinct vertical and horizontal lines that are missing the dots. Horizontal lines mean that some particular Dewey classes are never bought, in this case, 28 - 50 in Computer Science, 134 - 154 in Philosophy, 302 - 307 in Social Sciences, 917 - 929 are some of the examples. Vertical lines mean that there are some item numbers that are missing. However, it's really hard to find the exact purchase date of the item, since I wasn't even sure if the item number is evenly distributed. Therefore, I added the hover text function, so that when the mouse is over some dot, it will show the title of that item. I think this can give more information about the items and we can use the title to get the publish date of the item.
- hover text shows dewey class and title together
- hover text now adjusts according to position and won't be out of canvas
- change background and legend colors
- make the circle smaller
- add comment section and more comments
From the graph, we can clearly see that there are distinct vertical and horizontal lines that are missing the dots. Horizontal lines mean that some particular Dewey classes are never bought, in this case, 28 - 50 in Computer Science, 134 - 154 in Philosophy, 302 - 307 in Social Sciences, 917 - 929 are some of the examples. Vertical lines mean that there are some item numbers that are missing. However, it's really hard to find the exact purchase date of the item, since I wasn't even sure if the item number is evenly distributed. Therefore, I added the hover text function, so that when the mouse is over some dot, it will show the title of that item. I think this can give more information about the items and we can use the title to get the publish date of the item.
Optimization
I also really care about the performance of the program. After finishing the project, I spent some time to try to optimize my program further. Initially, I put my drawing function inside draw(), which runs in a loop. Because there are about 2.3 million circles that need to be drawn on the canvas, it takes about 30 seconds to redraw each time, and it makes keyboard and mouse interaction practically impossible since all the time are spent on drawing. After some research, I came up with using PGraphics. It allows me to draw to a buffer and save it, and later I can just use the content from the buffer without needing to redraw the frame. Therefore I used 4 PGraphics, to save the full, the book, the media, and the misc graph individually when the application starts up. I also put each of the drawing function in separate threads so that the operation can be done in parallel. This really improved the performance of my application. Currently, it takes about 30 seconds on startup to draw the four graphs, and then it takes no time to redraw and switch between them. Of course, I can further divide the drawing area into smaller ones and use more threads to further accelerate if I feel the need to.
Future Improvements
I thought about adding the checkout time of each item, for example, if I can get the first checkout time of each item, I can then use that as an indication of approximately when the item is purchased. I wrote two versions of the query to do that, as shown below. However, they are all too slow to run, and I couldn't finish running them in time. I'm hoping to find new ways to go about it.
Code