Dewey Classification and number of checkout times
MAT 259, 2018
Ming-Yu Lin
Concept
I used the same data from the last assignment which contained the number of checkout time for ten categories books in ten years.
The aim for the final project is to make visualization more clear that people can get information from the plot at first peek.
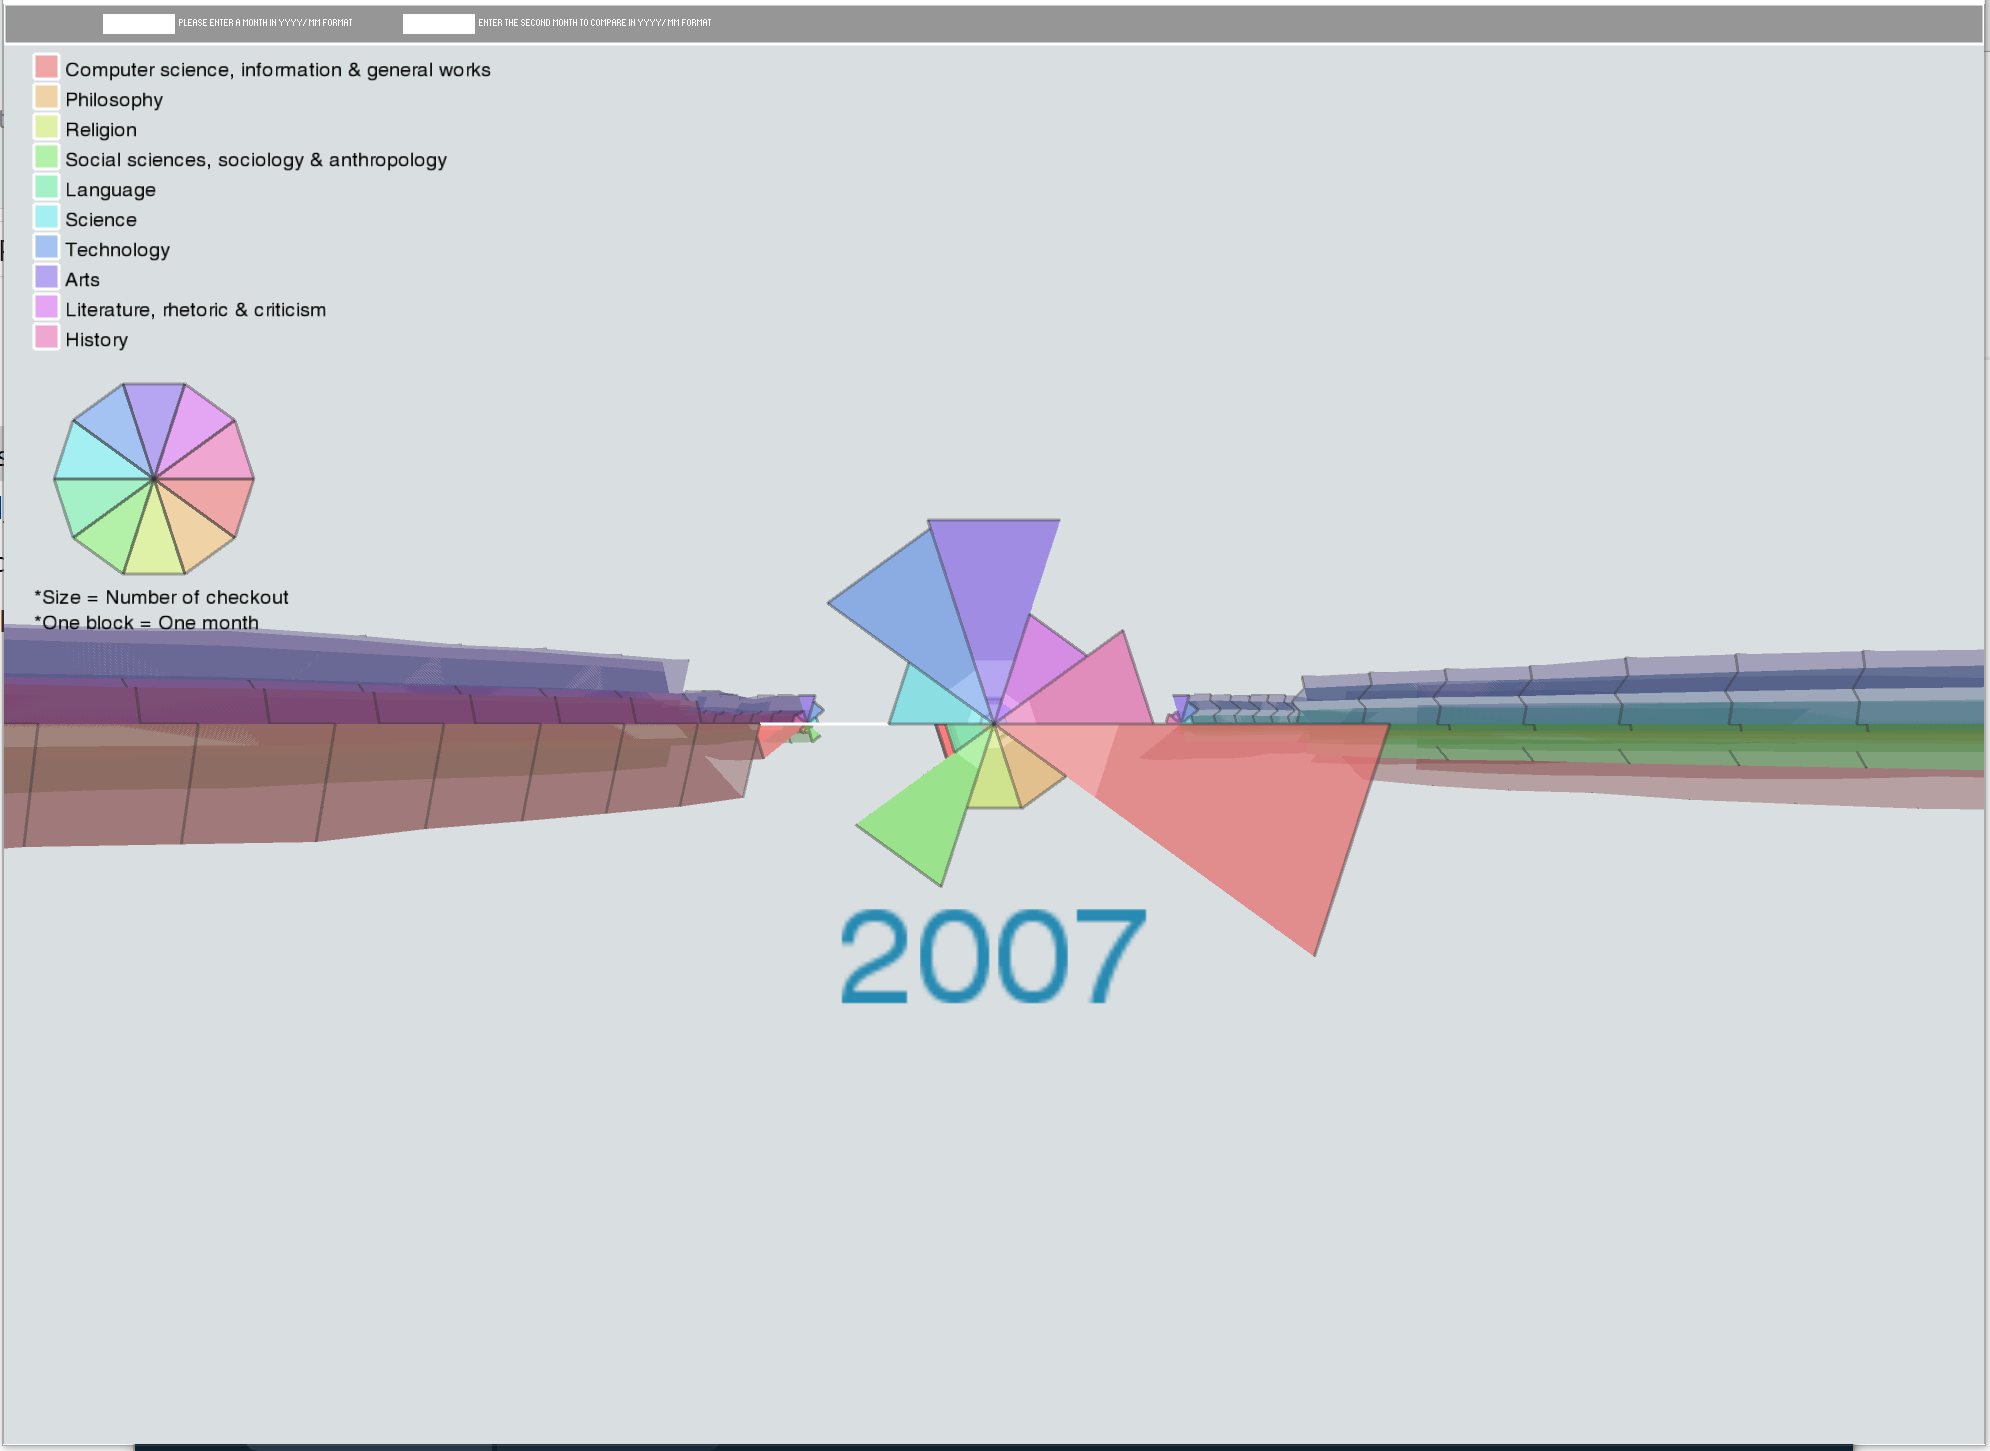
The basic shape was not changed but the arrangement became different.
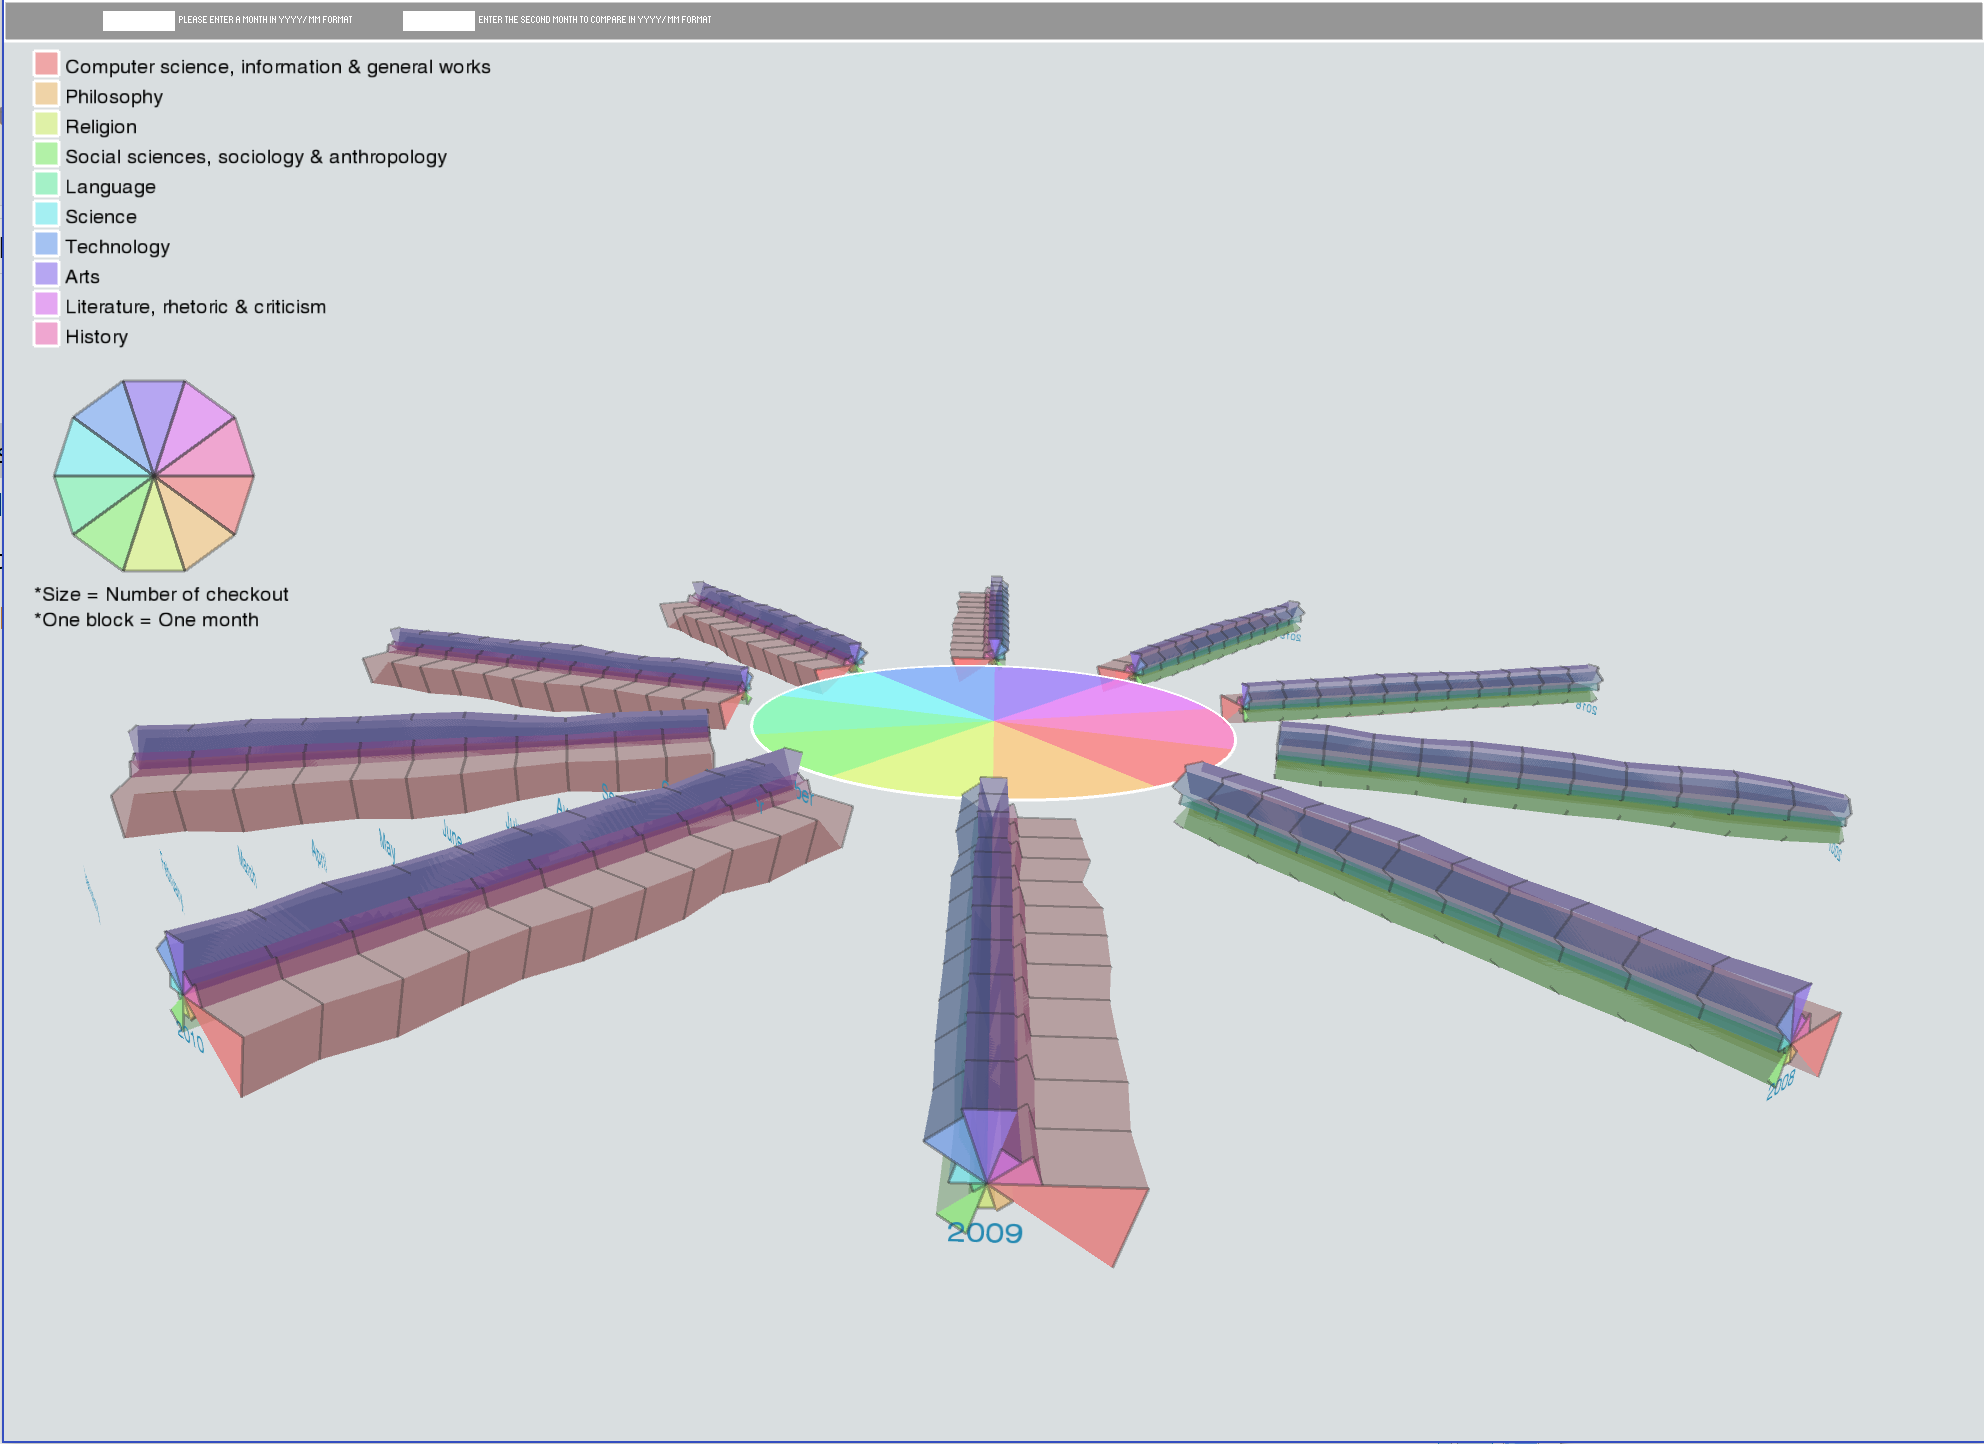
Since there were exactly ten years and ten categories, I divided a circle into ten parts and made ten years data along the direction of split lines.
Compared to the last assignment, this project showed clearer comparison between each month in same year.
However, the trade-off was that user could not make comparison between different years.
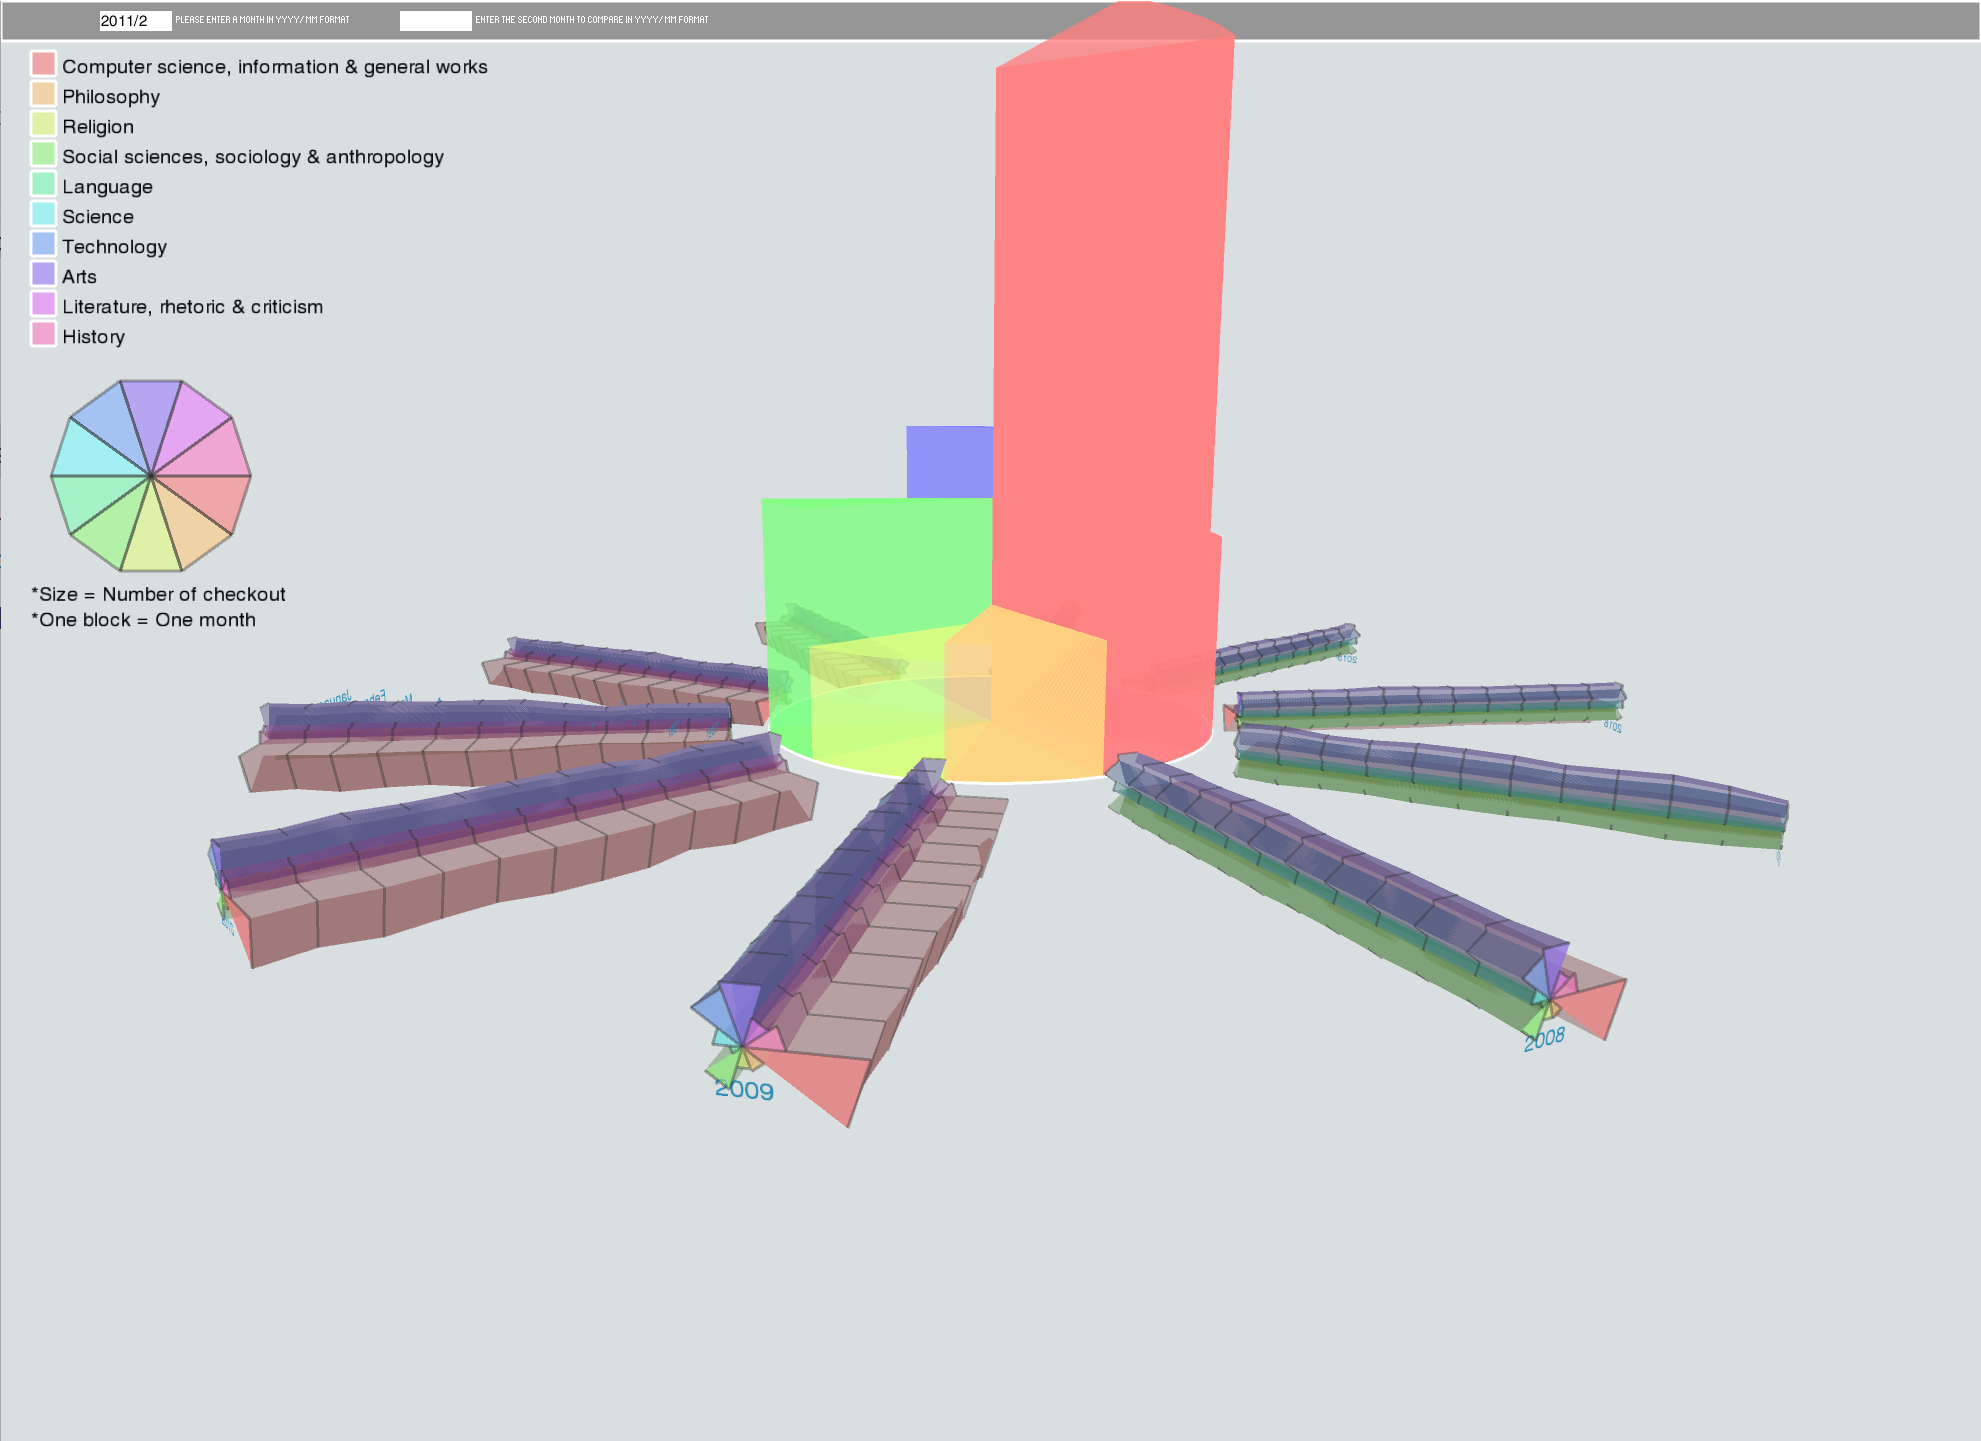
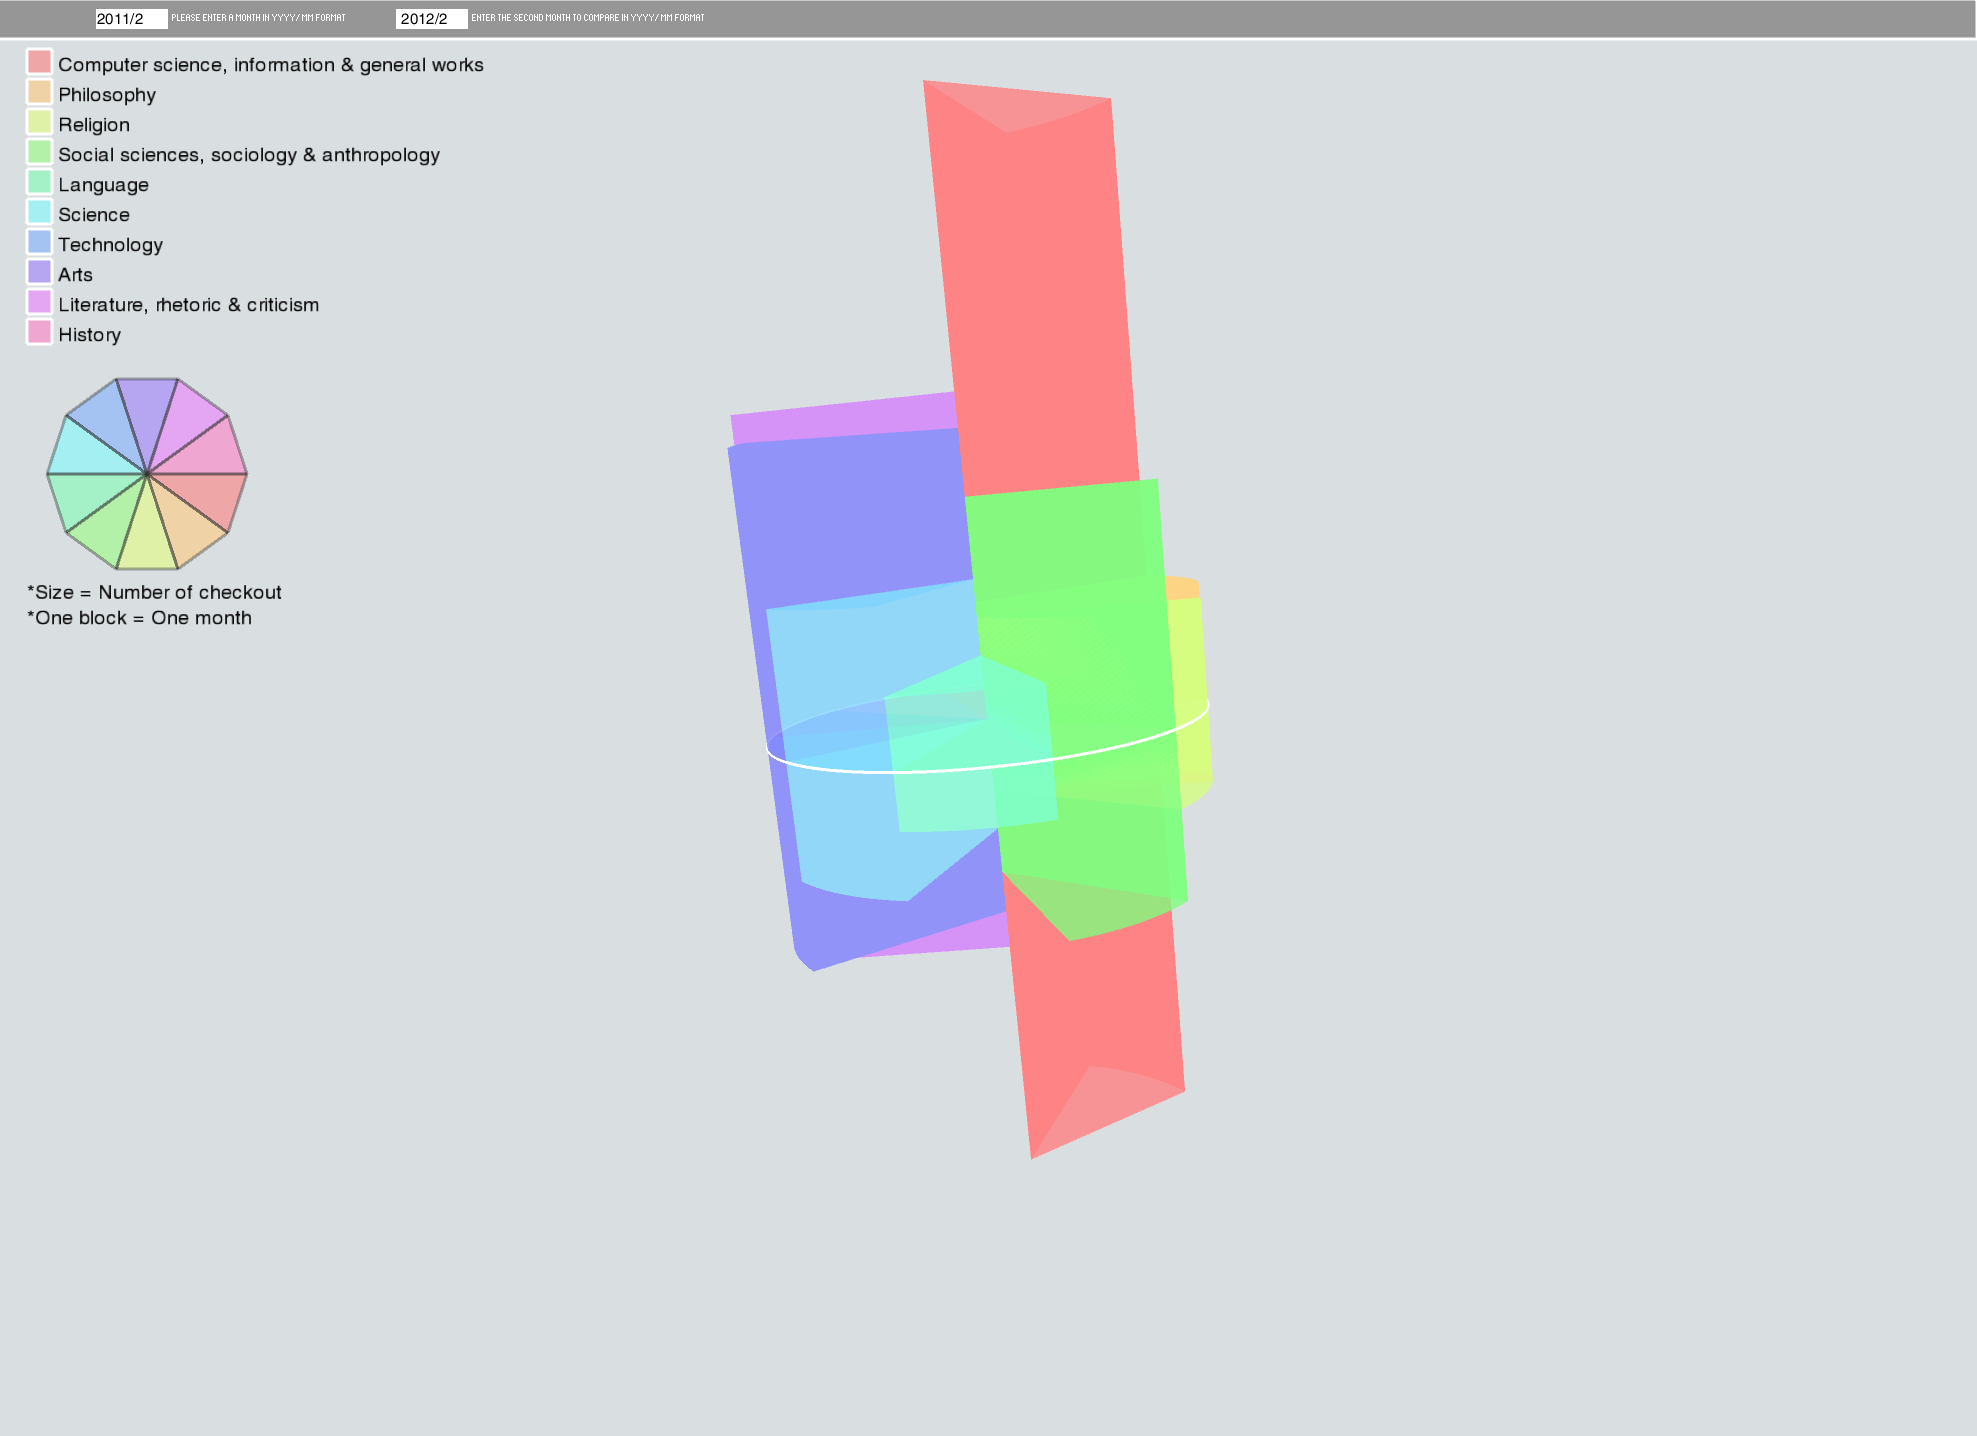
As a result, I add a feature for user to check the data in specific month.
I designed two text field for month comparsion.
If user only enter one month, sectoral cylinders would show above the center circular plane.
If user types in another month in second textfield, the other sectoral cylinders would show in opposite direction.
*The height and size do not represent the true number of original data due to the high ratio between the maximum and the minimum.
*The height and size do not represent the true number of original data due to the high ratio between the maximum and the minimum.
Query
Inspiration
The original concept was from the travel website.

However, I did not find suitable data for this shape. Moreover, the curve shape in 3D was hard to implement. Finally, it became more like a satellite.

However, I did not find suitable data for this shape. Moreover, the curve shape in 3D was hard to implement. Finally, it became more like a satellite.
Final result
Please put your final images or screen shots here with some explanations.
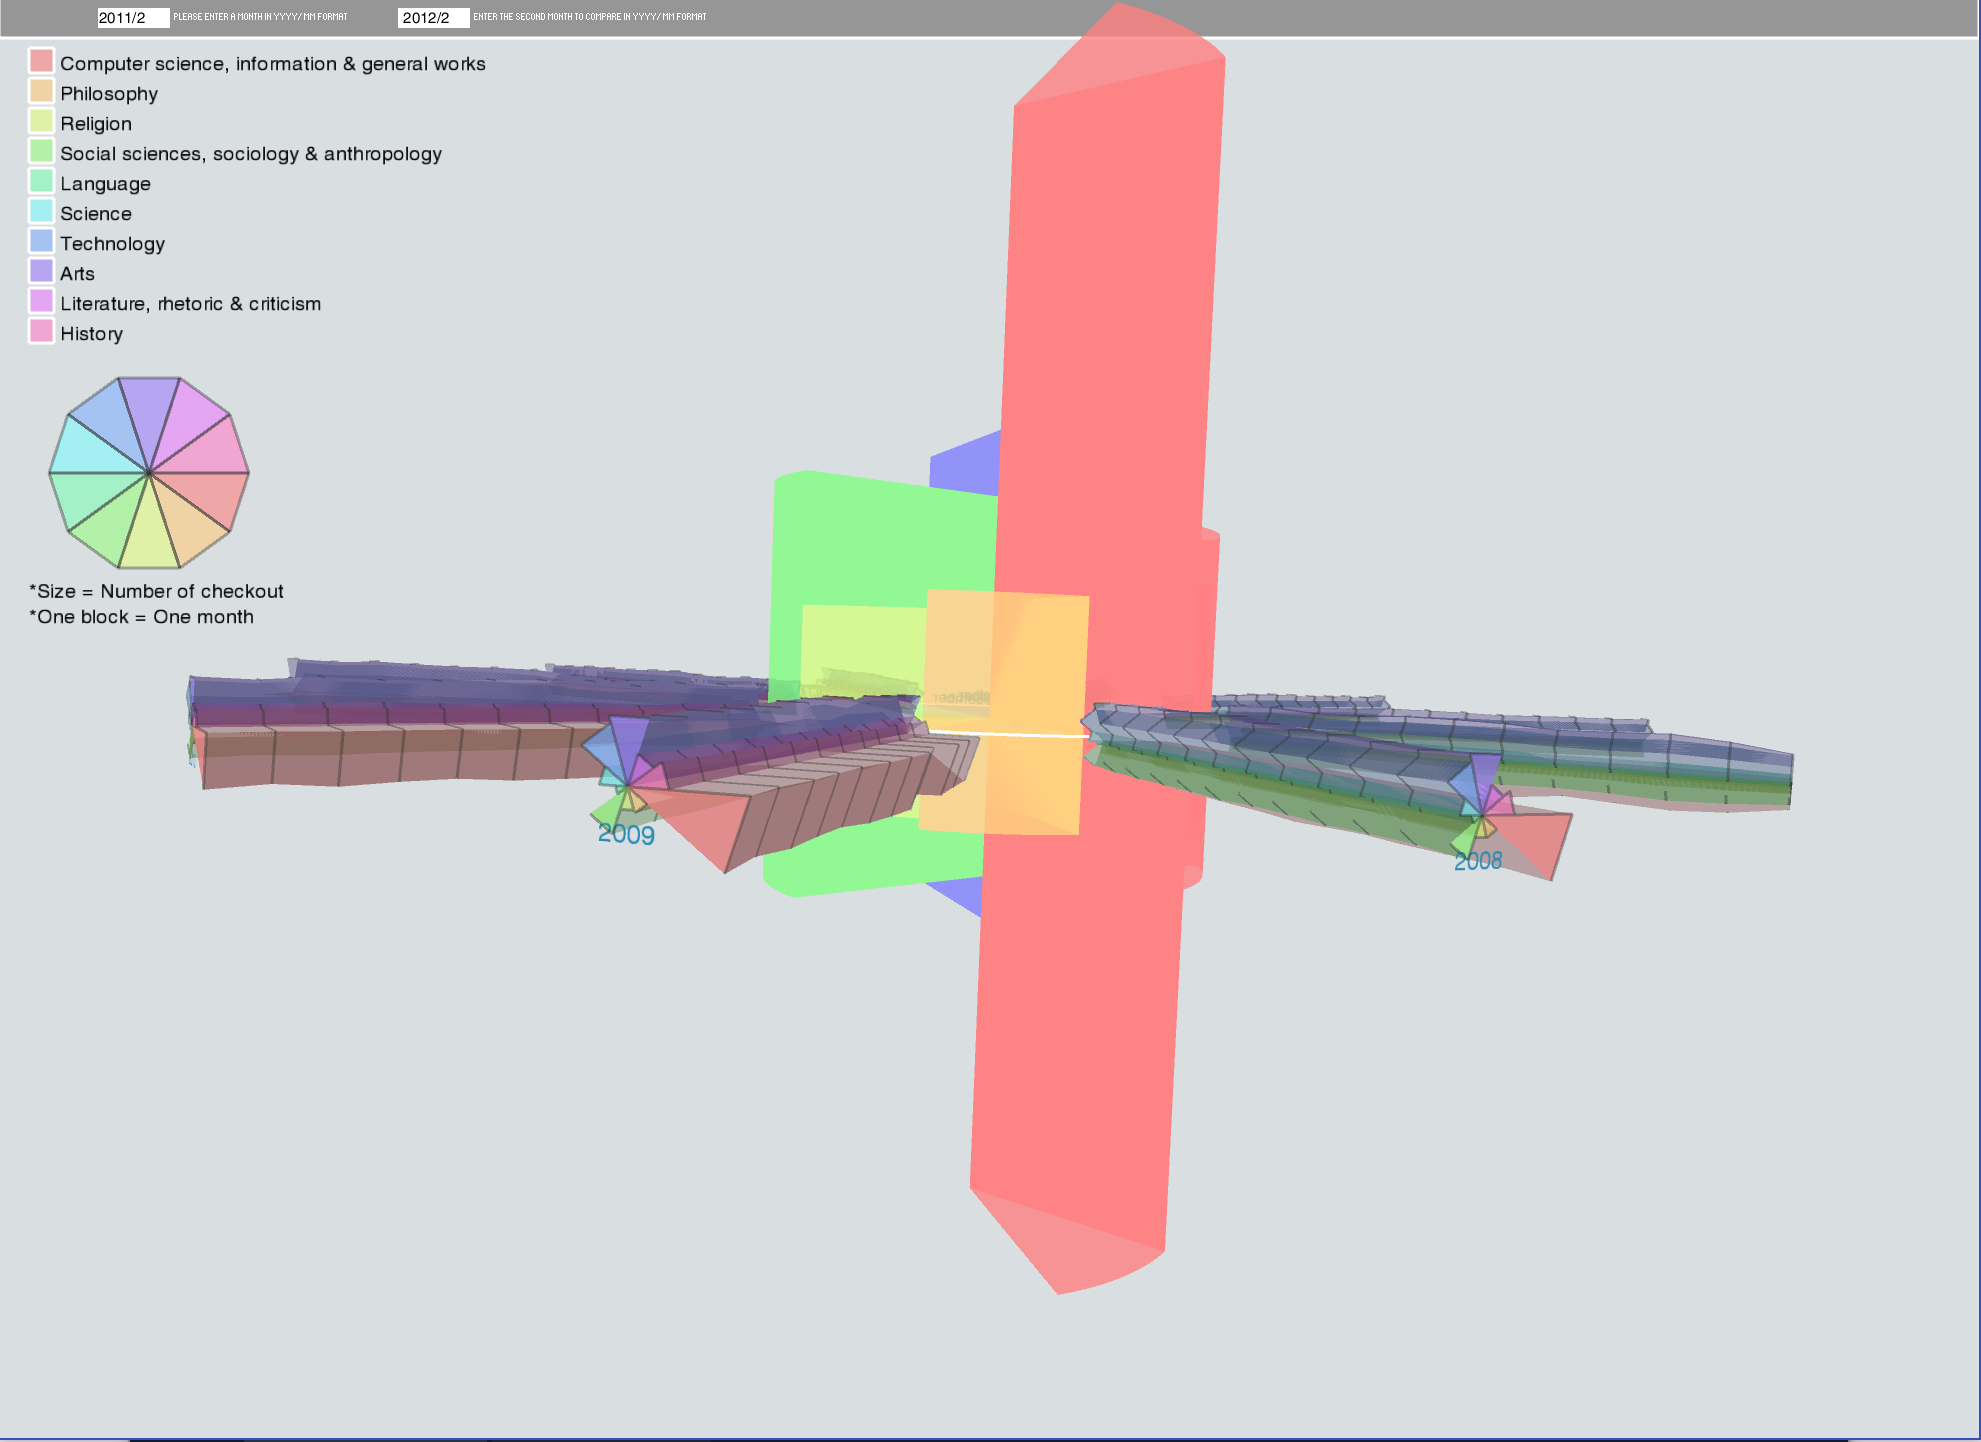
The scaling methods for the height of cylinder and the size of triangle shape are different. Considering the contrast between different shapes in whole 3D graph, it was not appropriate to use same method. However, users could still tell huge difference between categories. The main purpose of this project is to show the data intuitively. I would consider if it is necessary that the real number should be shown in the plot in the future. For the future work, I would like to turn this Processing version into p5.js or other javascript frame work(e.g d3.js deck.gl).
The scaling methods for the height of cylinder and the size of triangle shape are different. Considering the contrast between different shapes in whole 3D graph, it was not appropriate to use same method. However, users could still tell huge difference between categories. The main purpose of this project is to show the data intuitively. I would consider if it is necessary that the real number should be shown in the plot in the future. For the future work, I would like to turn this Processing version into p5.js or other javascript frame work(e.g d3.js deck.gl).
Code