Caltivation of Energy
MAT 259, 2018
Junxiang Yao
Concept
In this project, my inspiration is a theory from the book: A Brief History of Humankind. The theory suggested that it seems more like we were domesticated by the wheat
rather than we domesticated the wheat. I am curious about the data which can illustrate the density of the grops. What are their population looks like?
I used data from EXIOBase dataset suggested by professor Marko Peljhan. The dataset provided me the supply and consumption data of 6 main kinds of crops from 42 countries.
In fact, there are data from categories like “rest of Asia”, which I decided not to use at last since there is no applicable geographical data.
Query
I pasted the code I used to get all the supply data from the table I found at EXIOBase.
The code used for processing other kinds of data are similar.
void setup() {
table_source = loadTable("mrSupply.csv", "header");
table_names = loadTable("country_information.csv", "header");
output = new Table();
//Define all the columns
output.addColumn("country code");
output.addColumn("supply");
for (int i = 0; i < 43; i++) {
TableRow newRow = output.addRow();
newRow.setString("country code", table_source.getString(5 + i * 8, 0));
newRow.setString("supply", table_source.getString(5 + i * 8, 7 + 163 * i));
}
saveTable(output, "data/oil_supply.csv");
}
Preliminary sketches
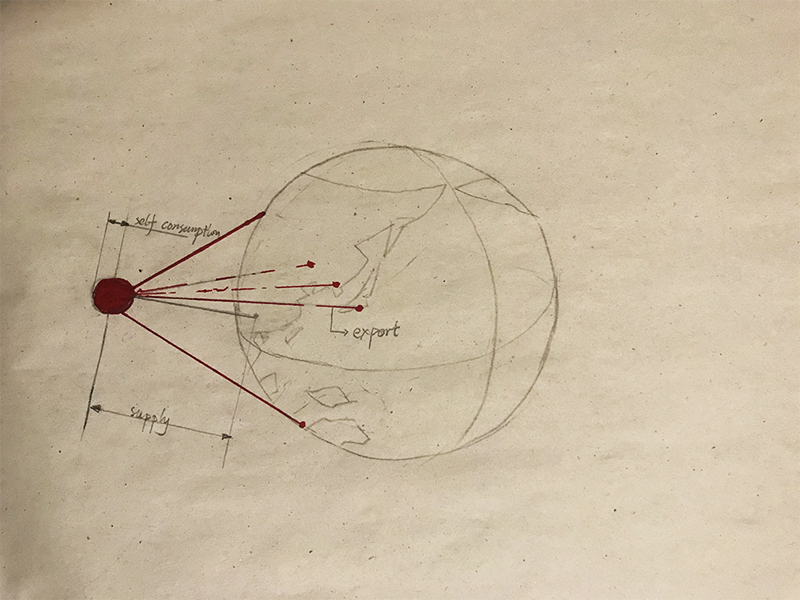
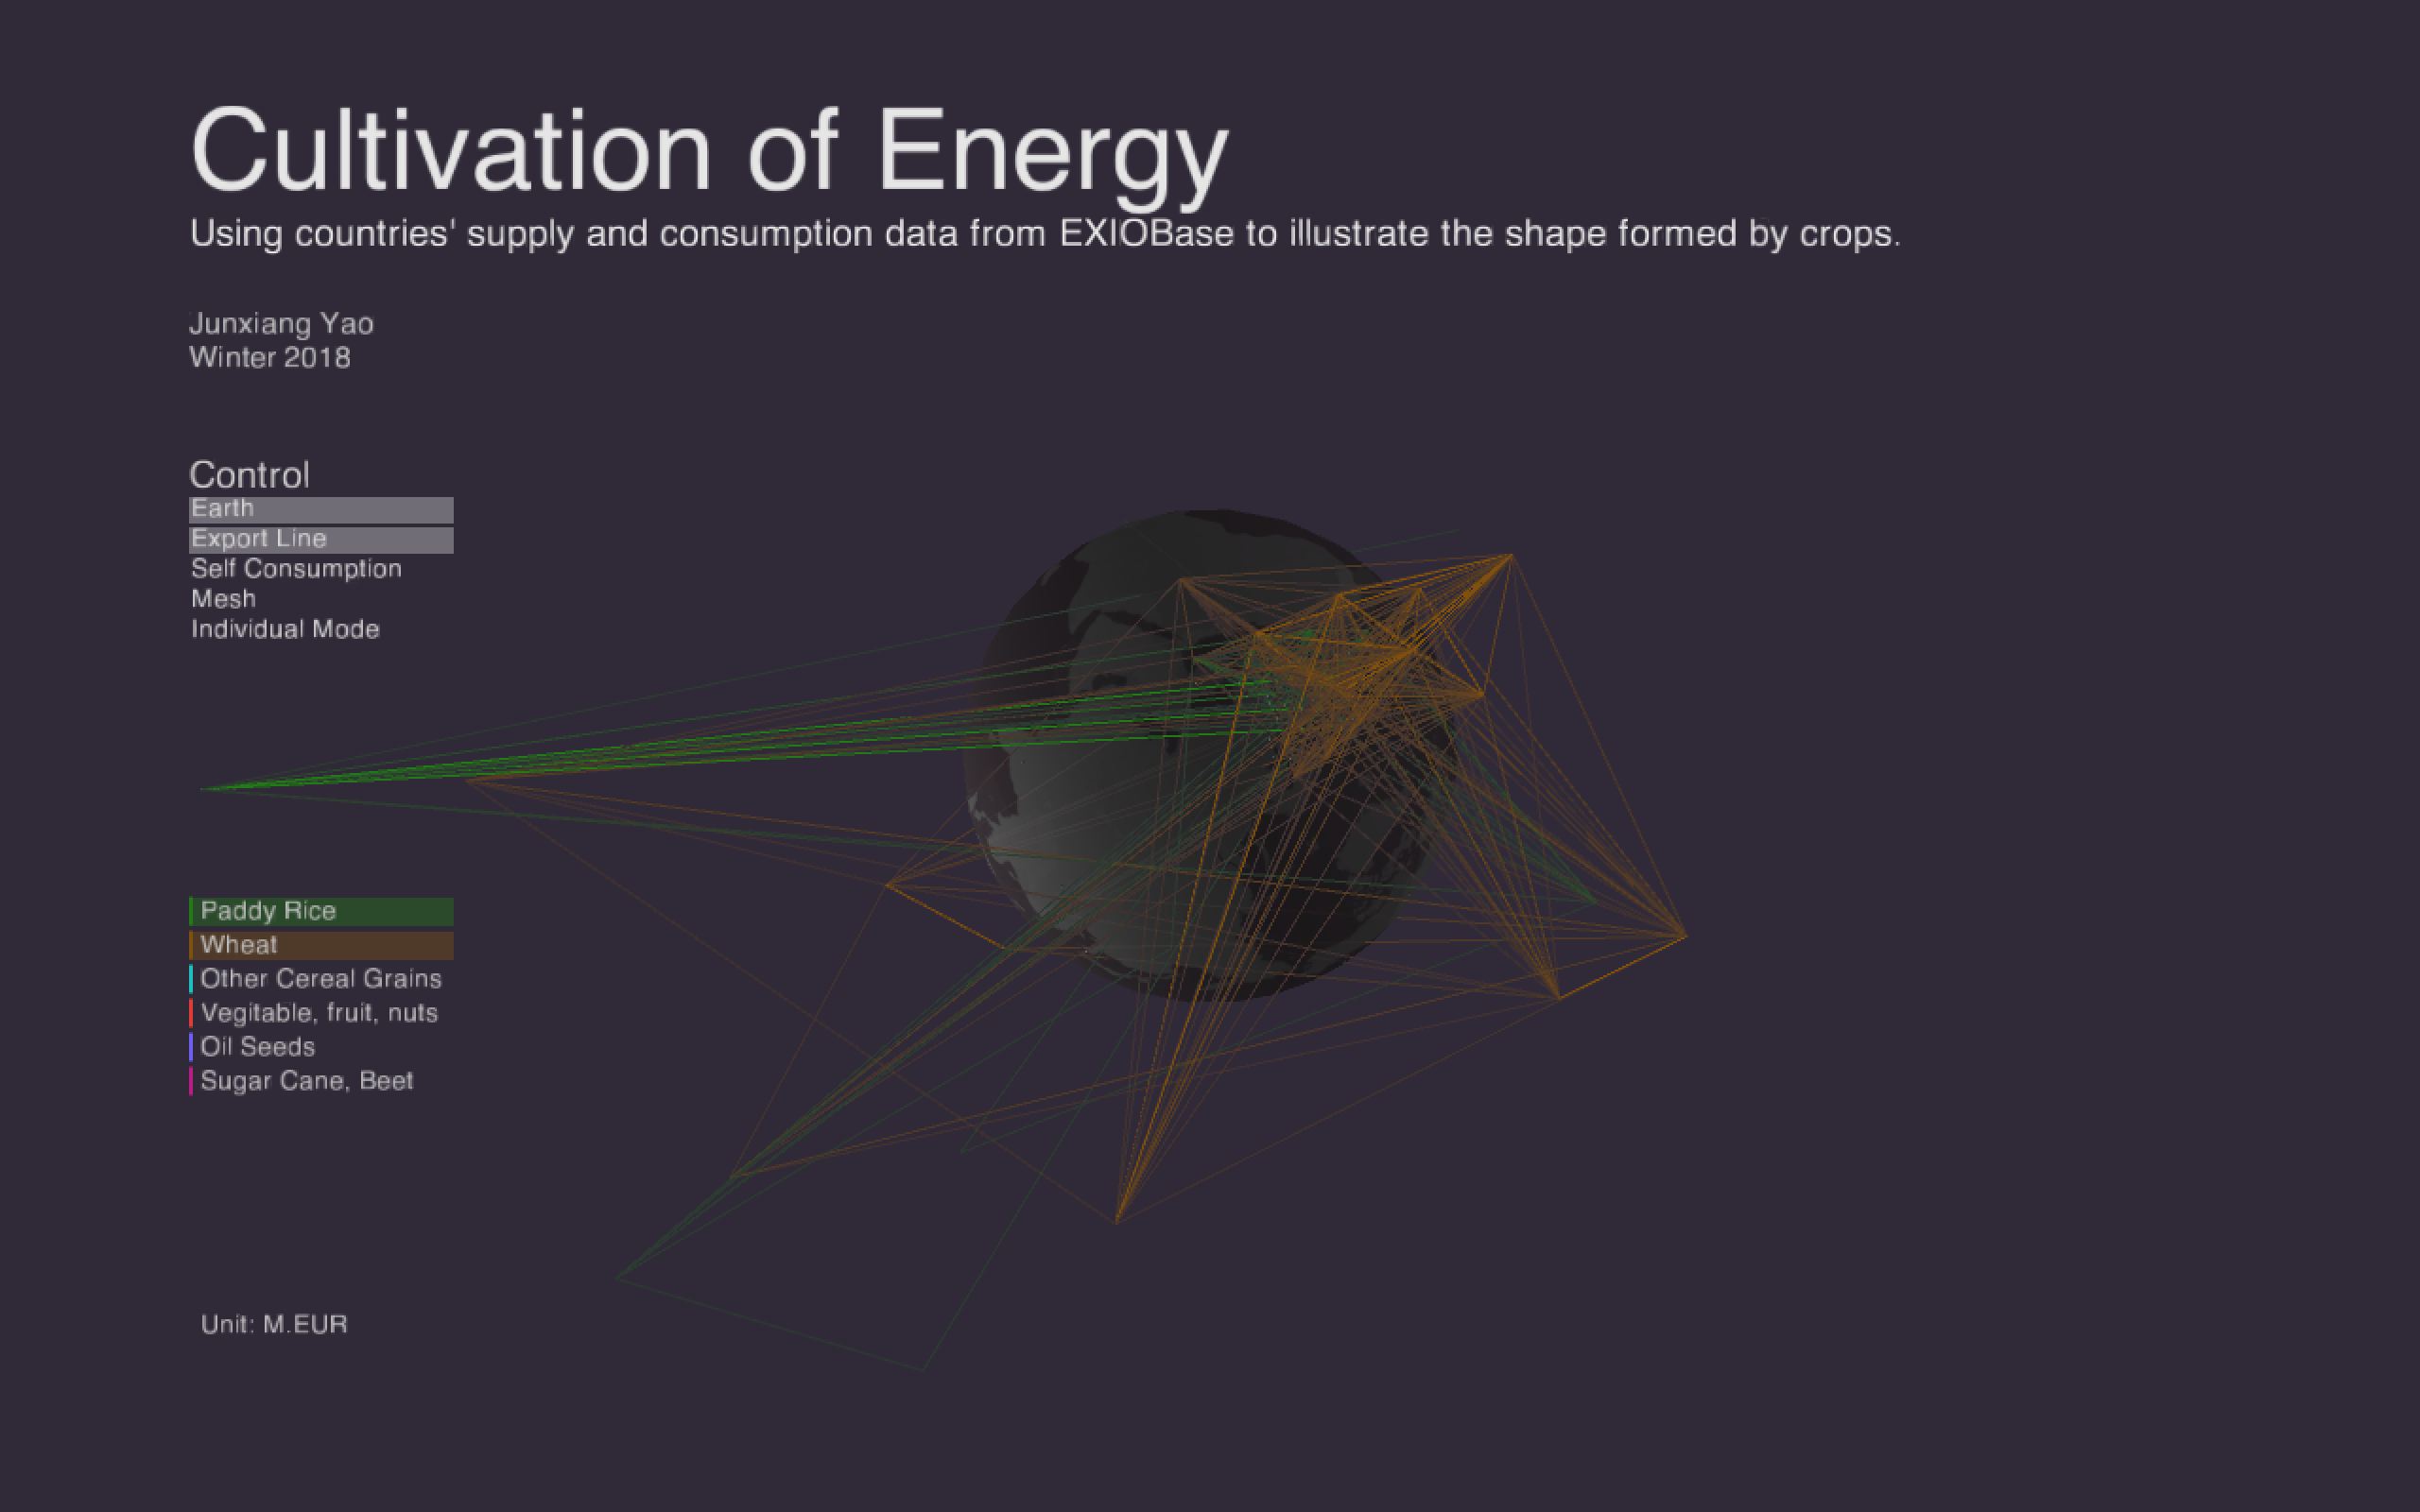
I am very interested in spherical cordinate system. I used it in Star Was Nebula. Locating a point in the spherical coordinate system requires 3 parameters,
which is a redius and two angles, which are longitude and latitude. In Star Wars Nebula, the redius was controled by data, whereas the two angles
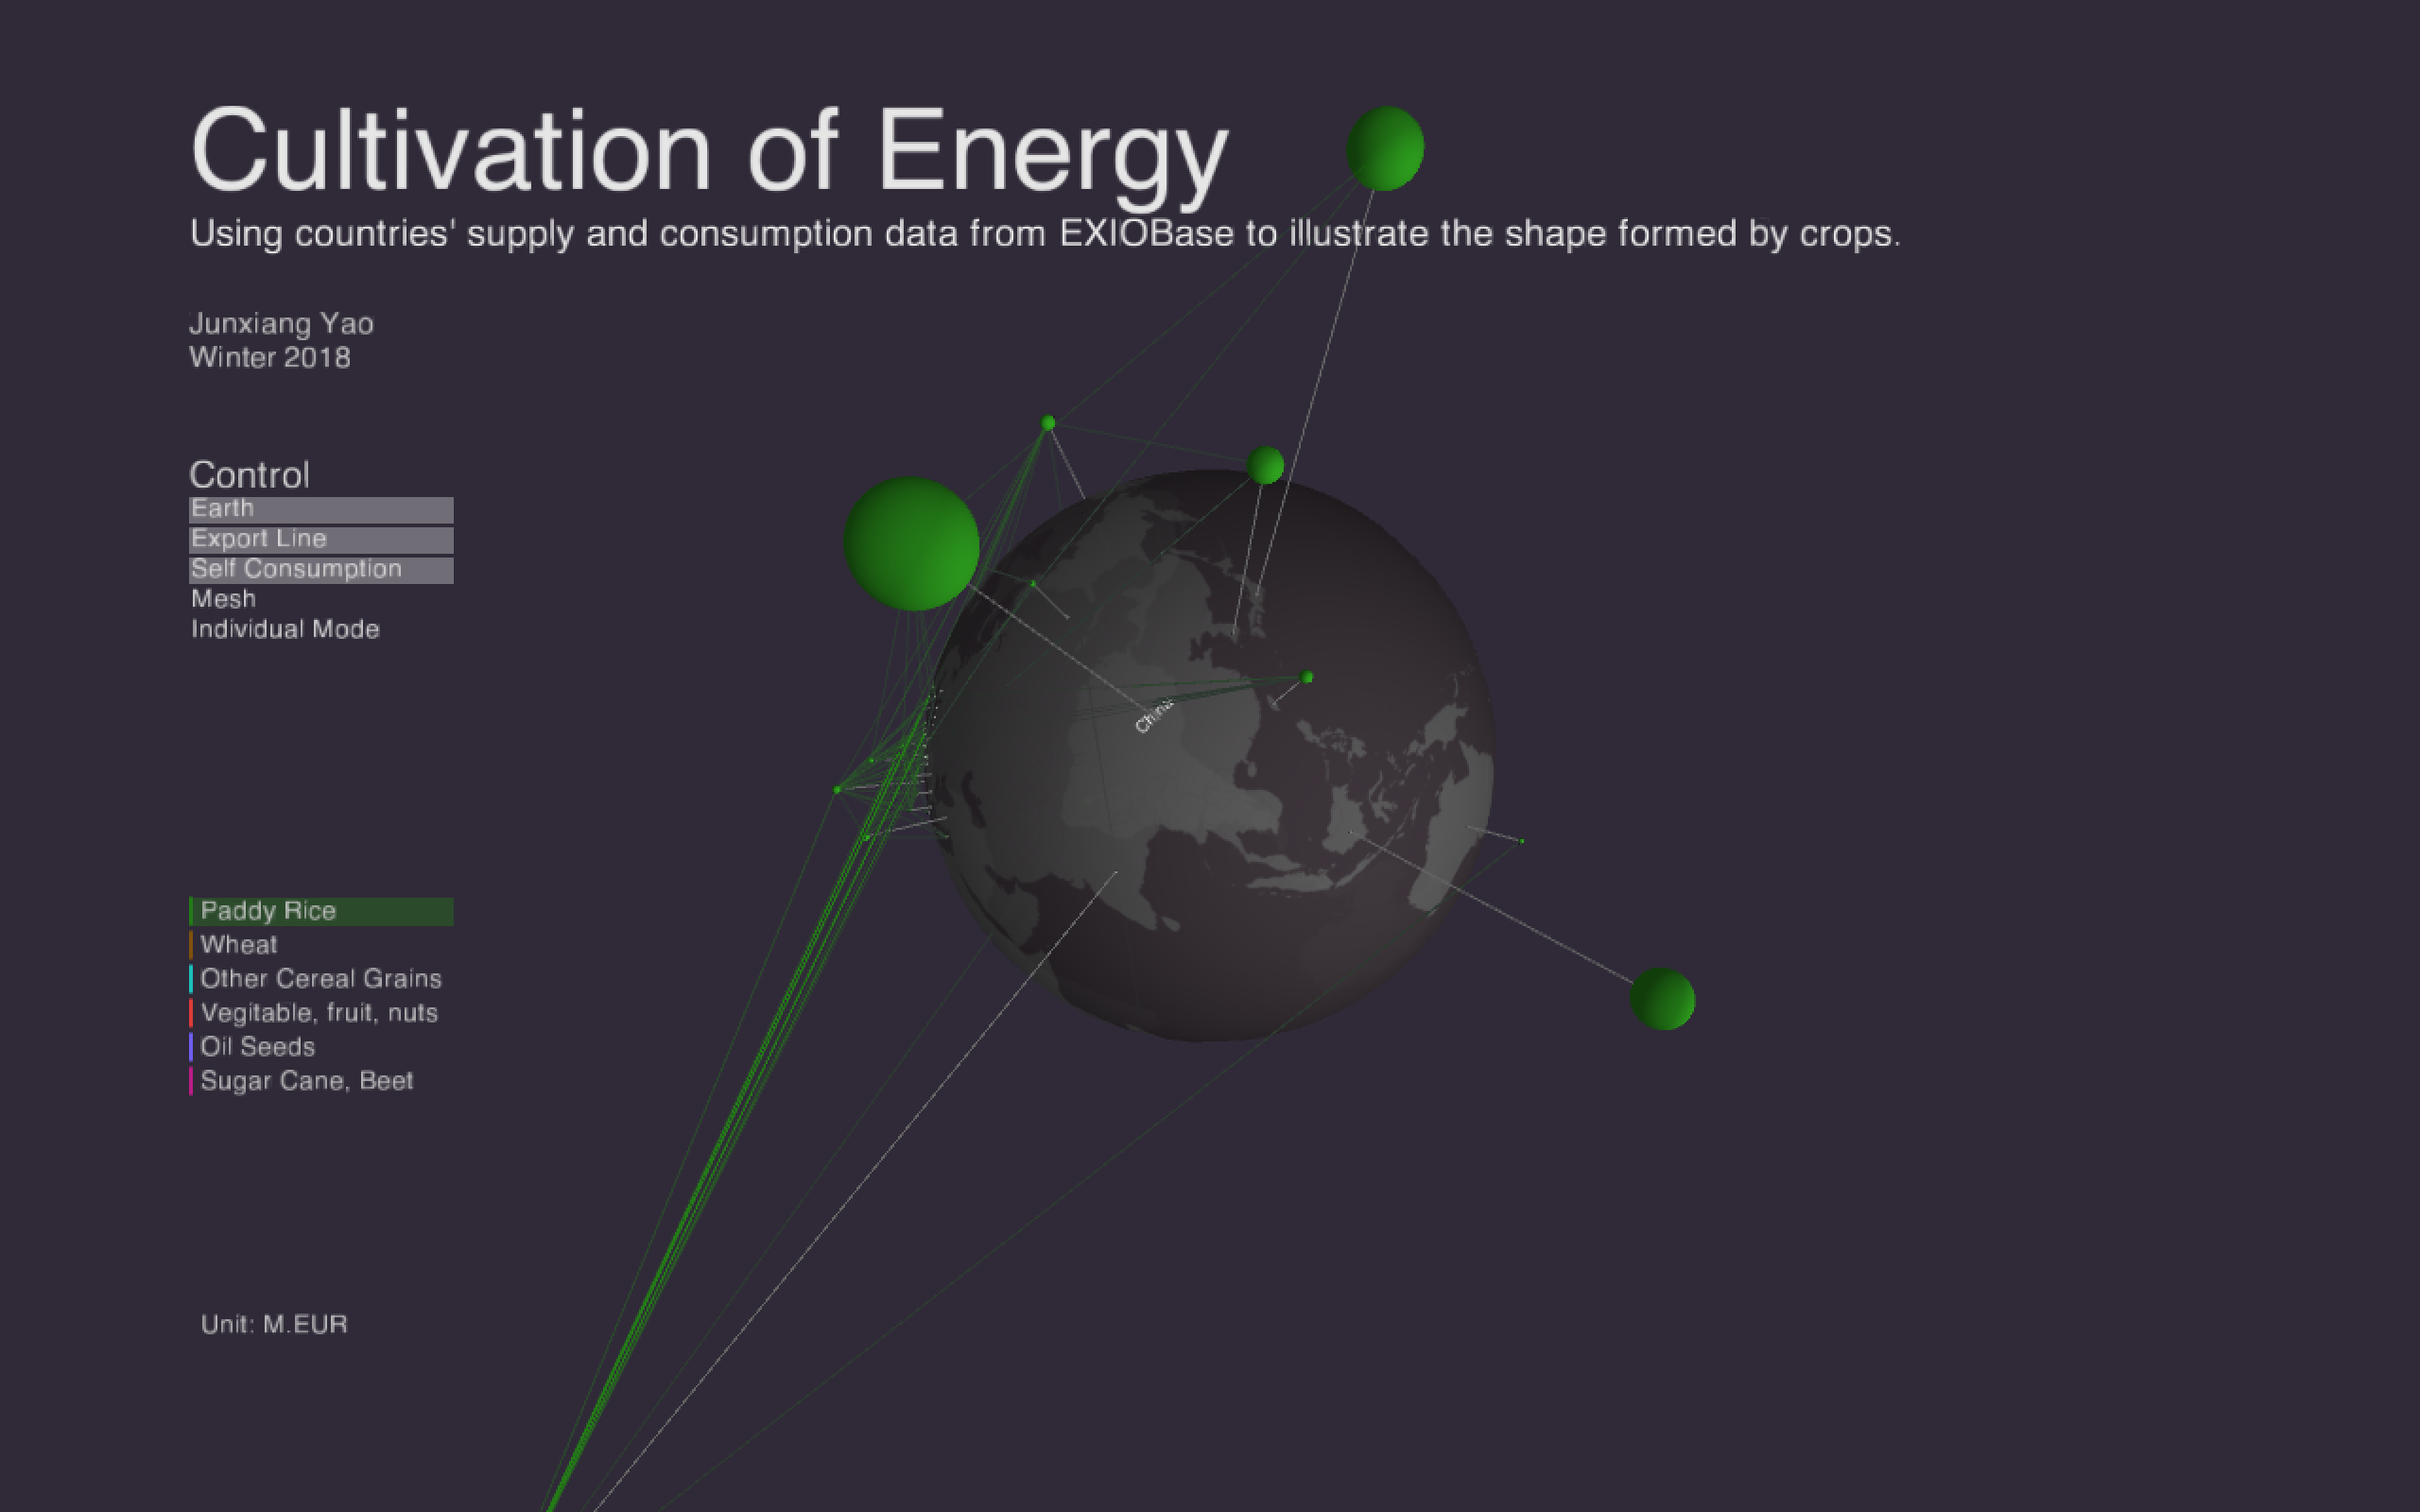
are evenly distruibuted respectively. This time, I used the geographical data to control the two angles and supply value to control redius to shape a mesh.
Besides, there will be a sphere at each vertex do present the self-coonsumption data. And each vertex are not going to connected to its neighbor in the line mode,
they will only connect to the point which represents the country they traded with.
Process
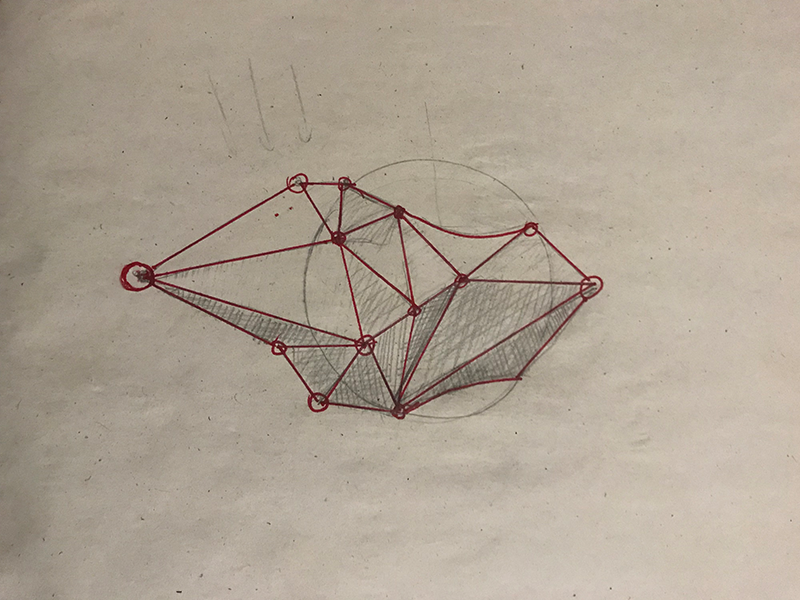
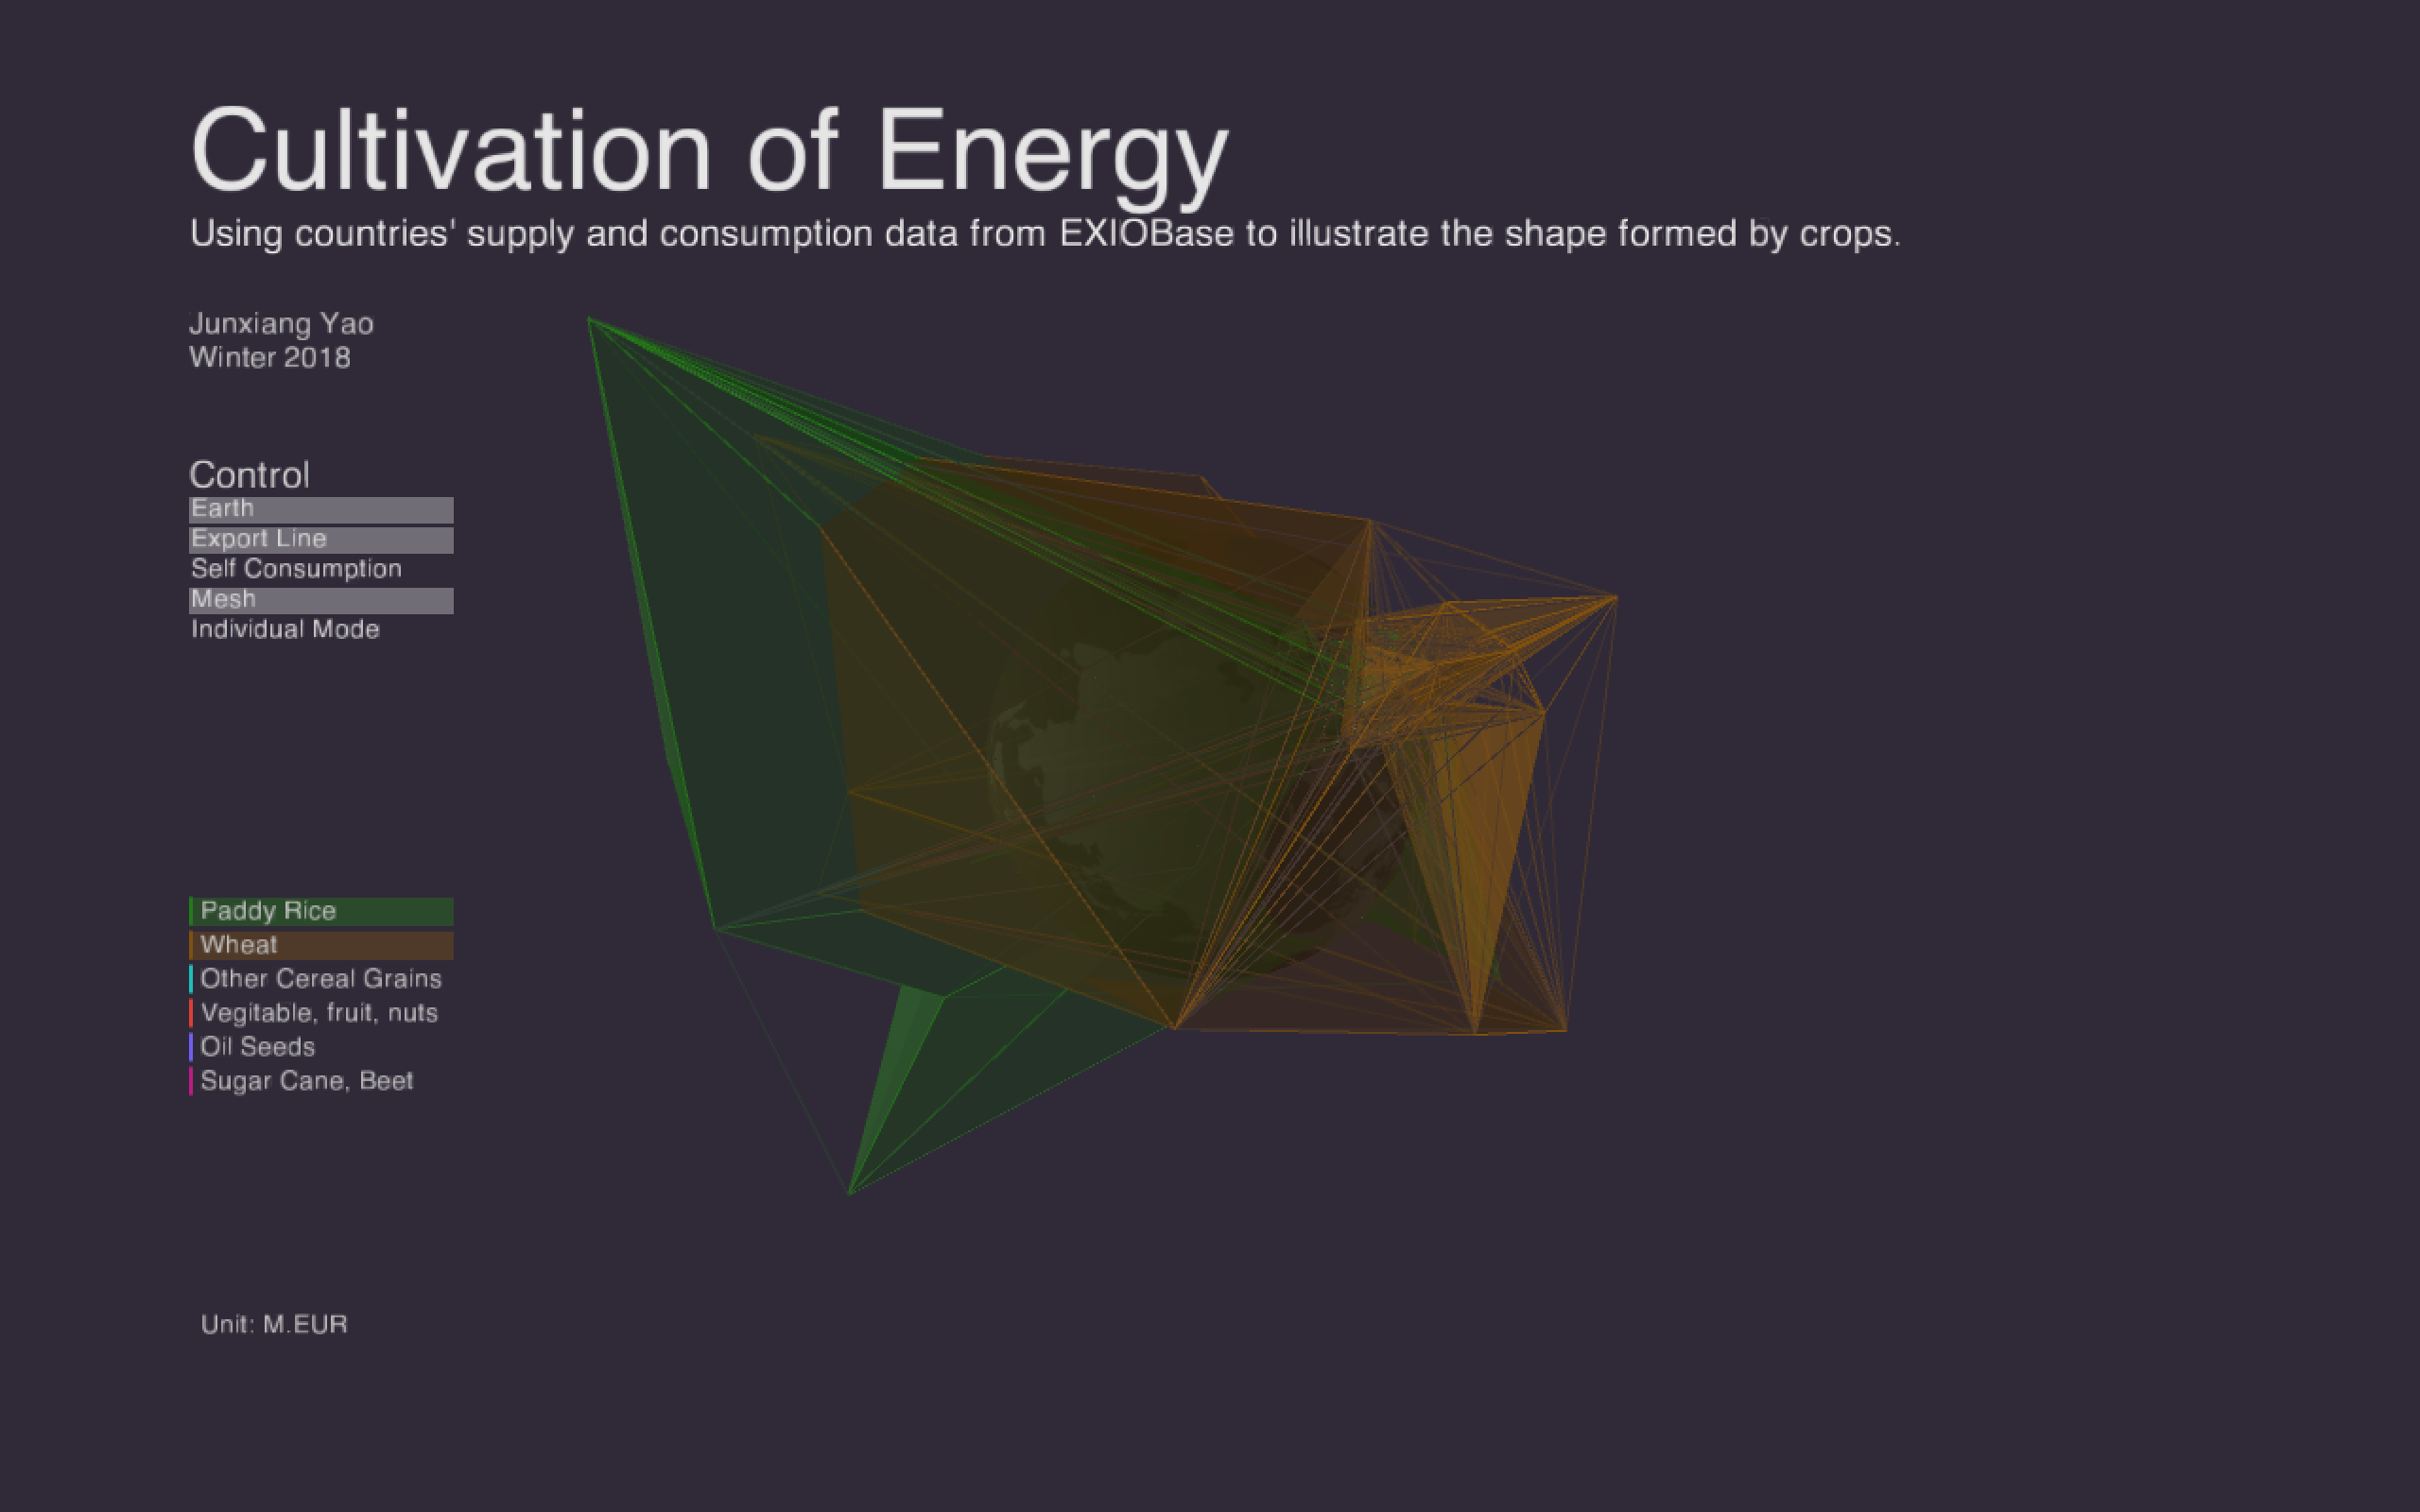
Before loading the data from EXIOBase, I connected every country using their latitude and longtitude data to generate a net first.
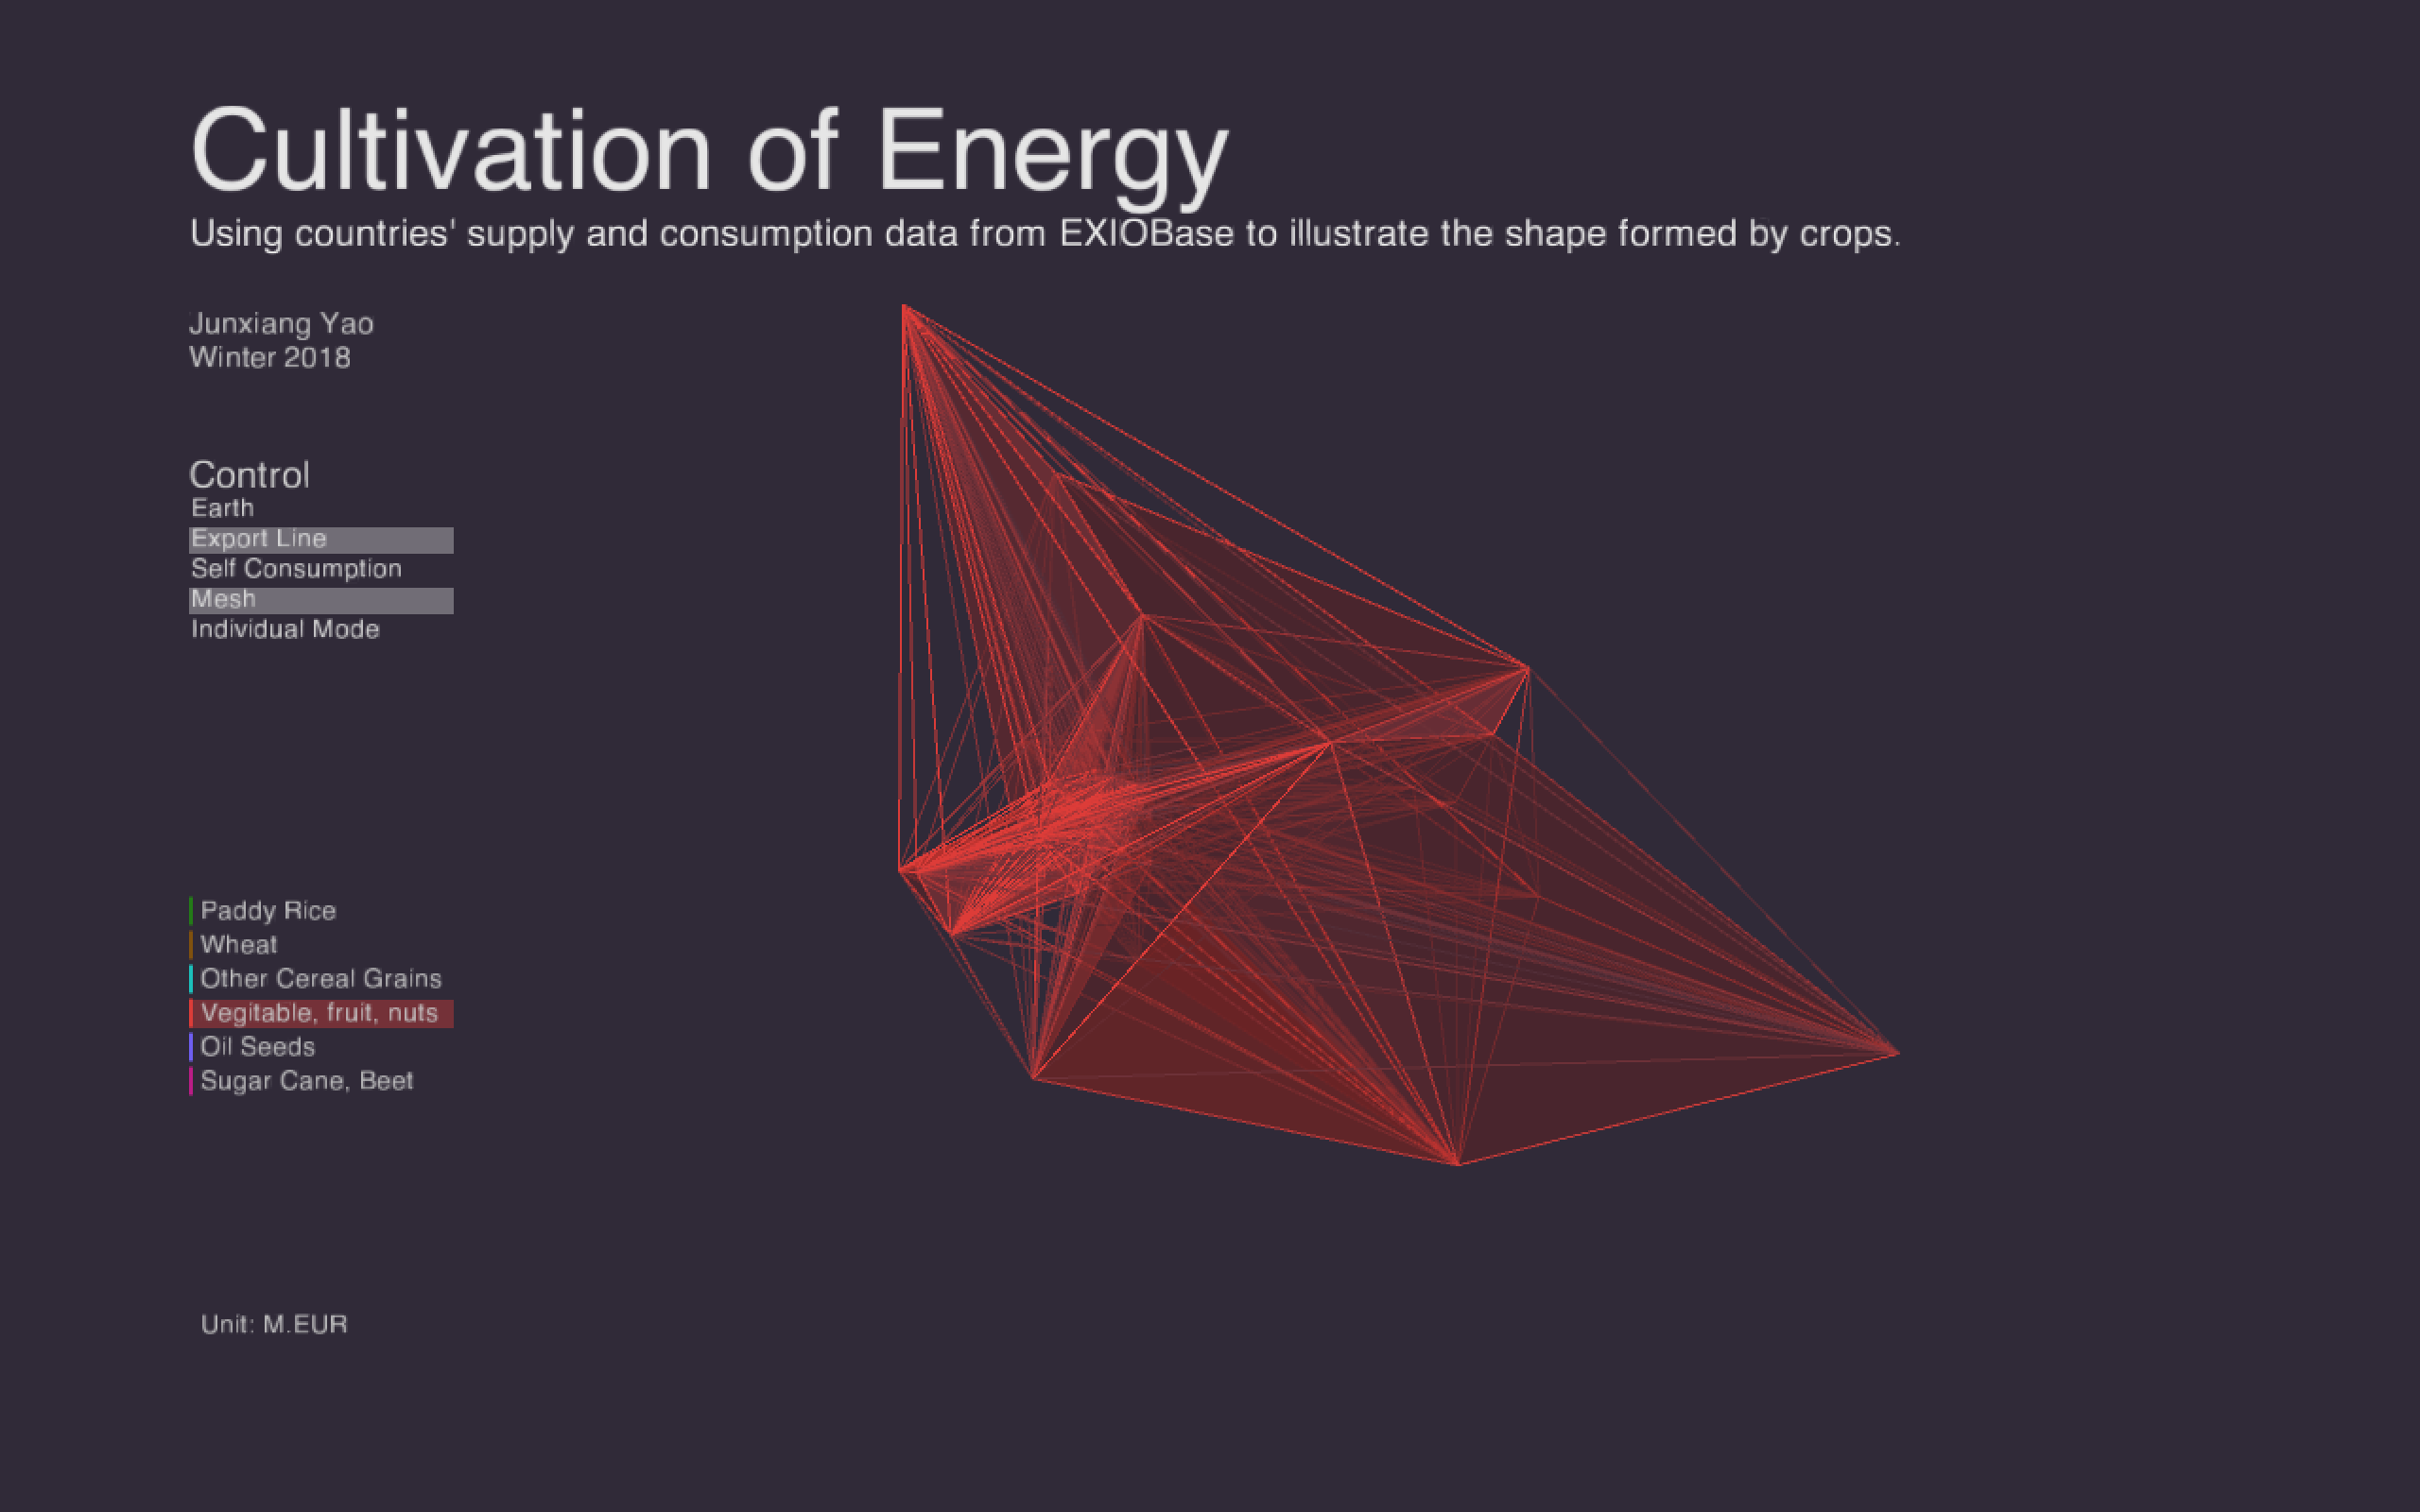
Next, I used a library named Computational Geometry to generate a convex hull. But after I loaded the supply data, I realize that I overlooked the resolution of this algorithm, which make the 3D shape a bit dull. Thus, I decided not to use this library and draw the country net myself.

Next, I used a library named Computational Geometry to generate a convex hull. But after I loaded the supply data, I realize that I overlooked the resolution of this algorithm, which make the 3D shape a bit dull. Thus, I decided not to use this library and draw the country net myself.
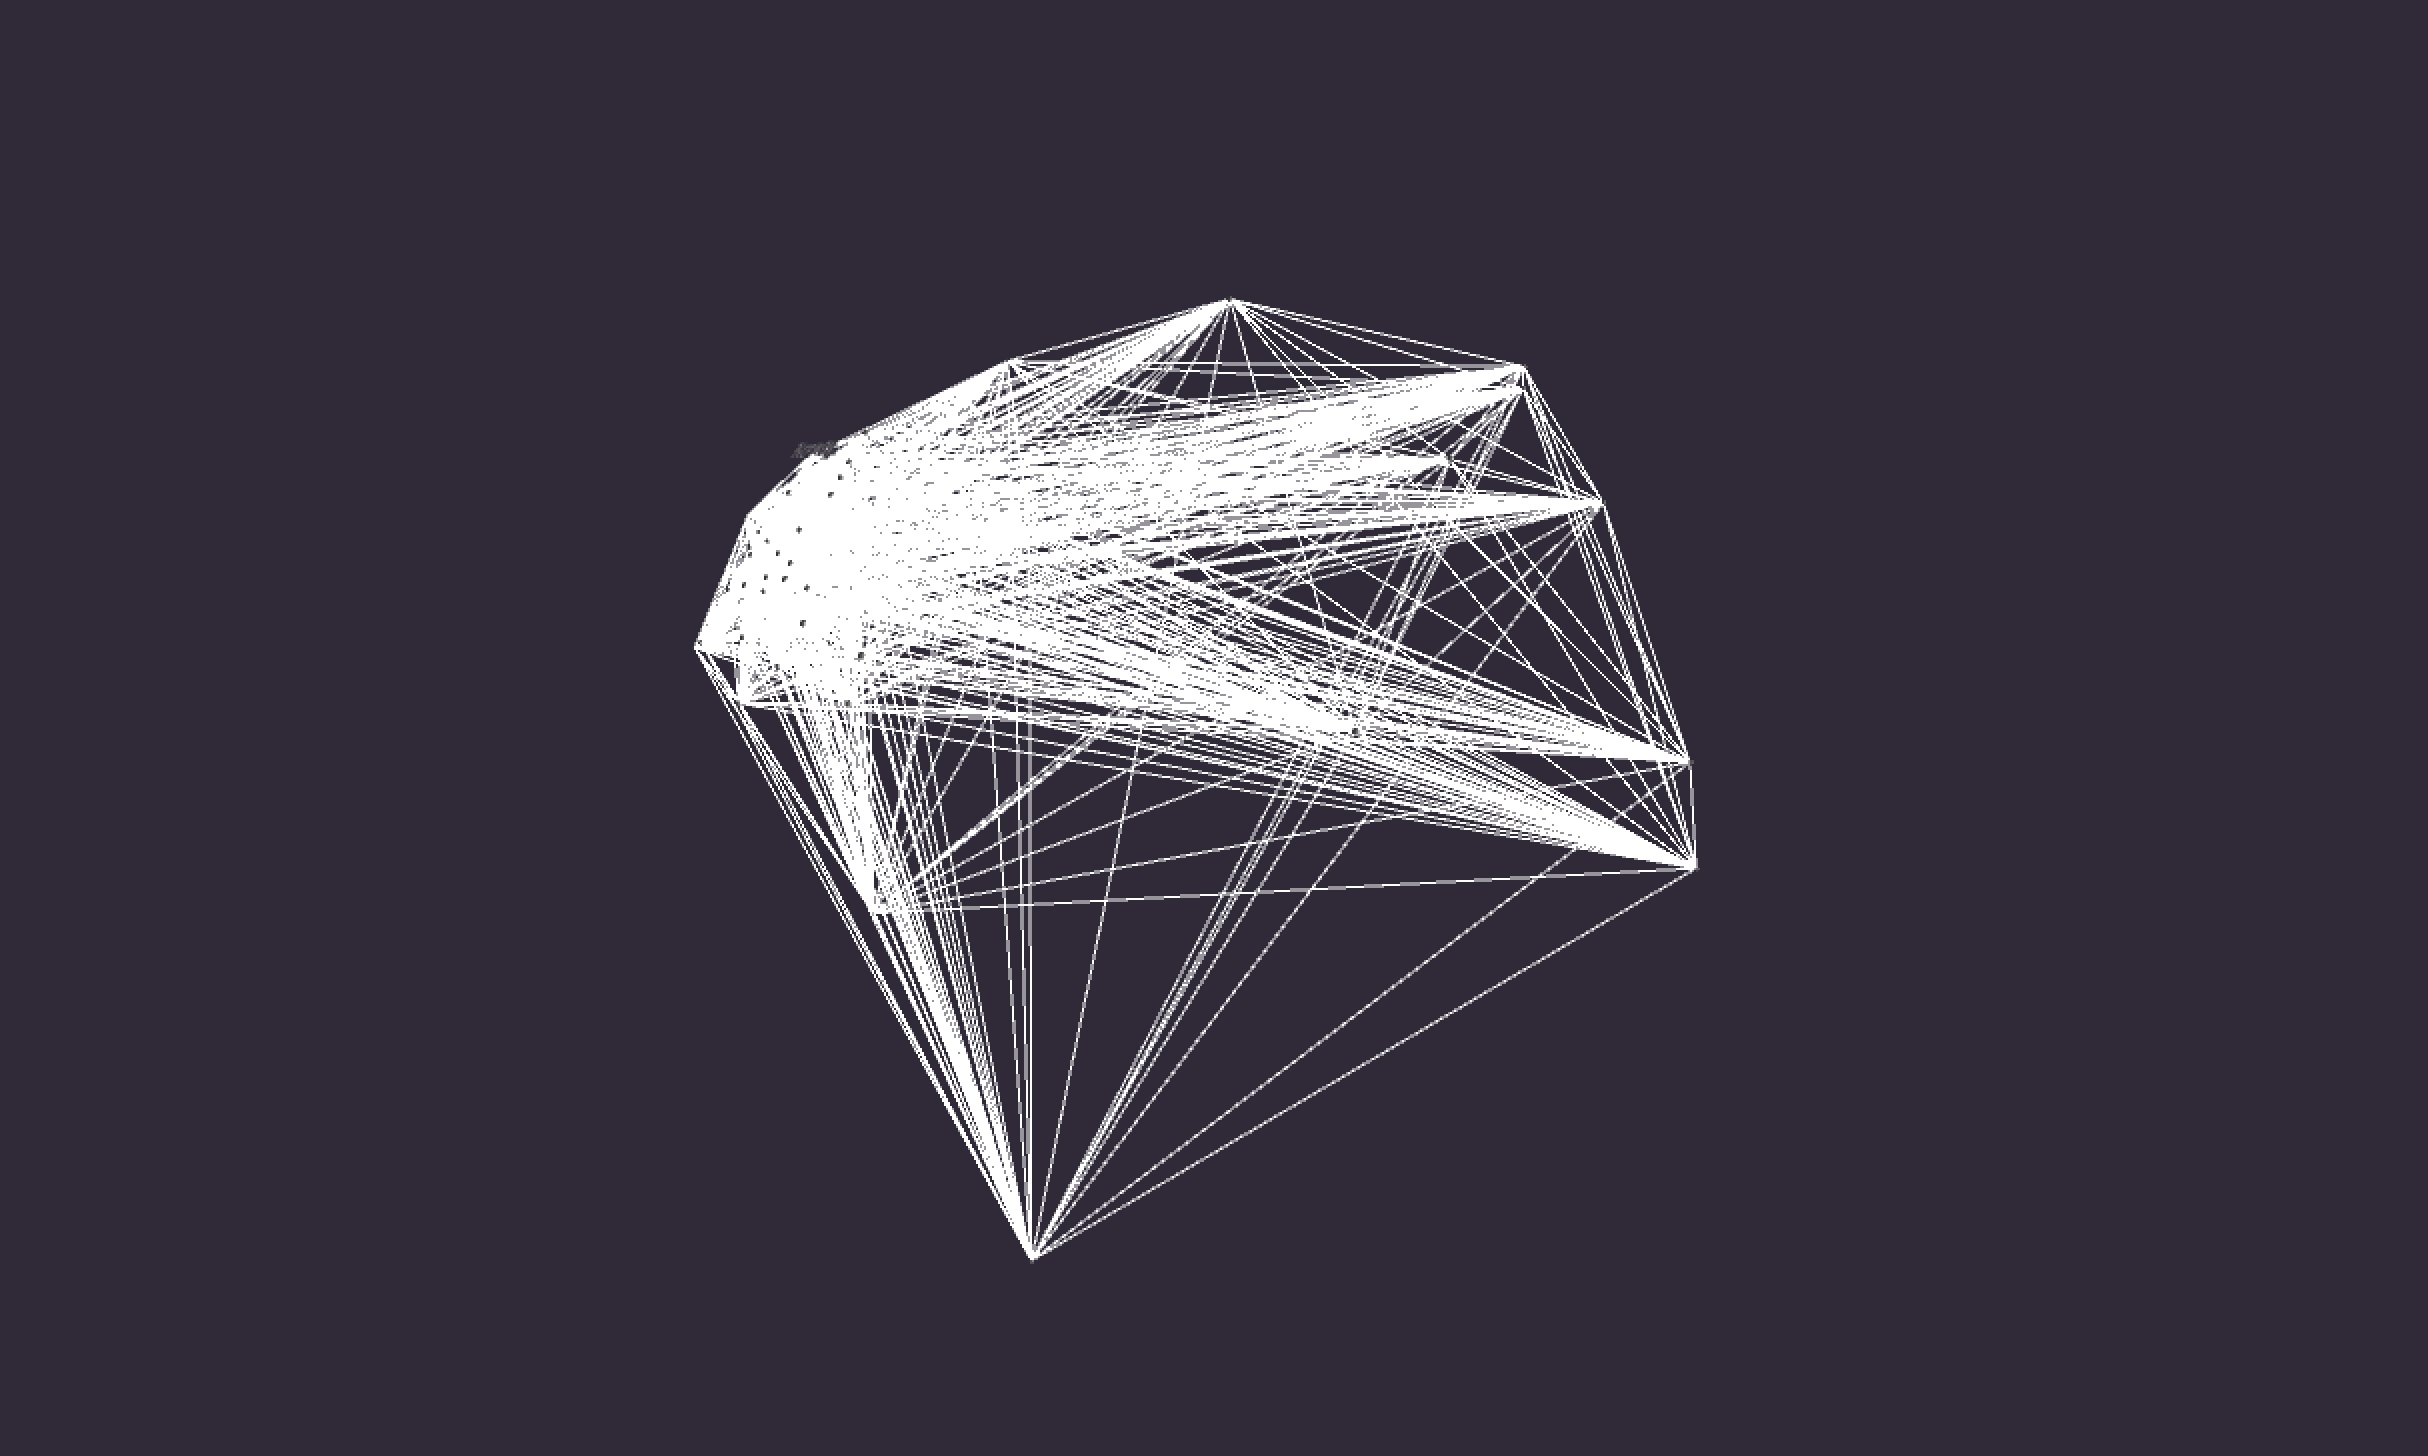
Final result
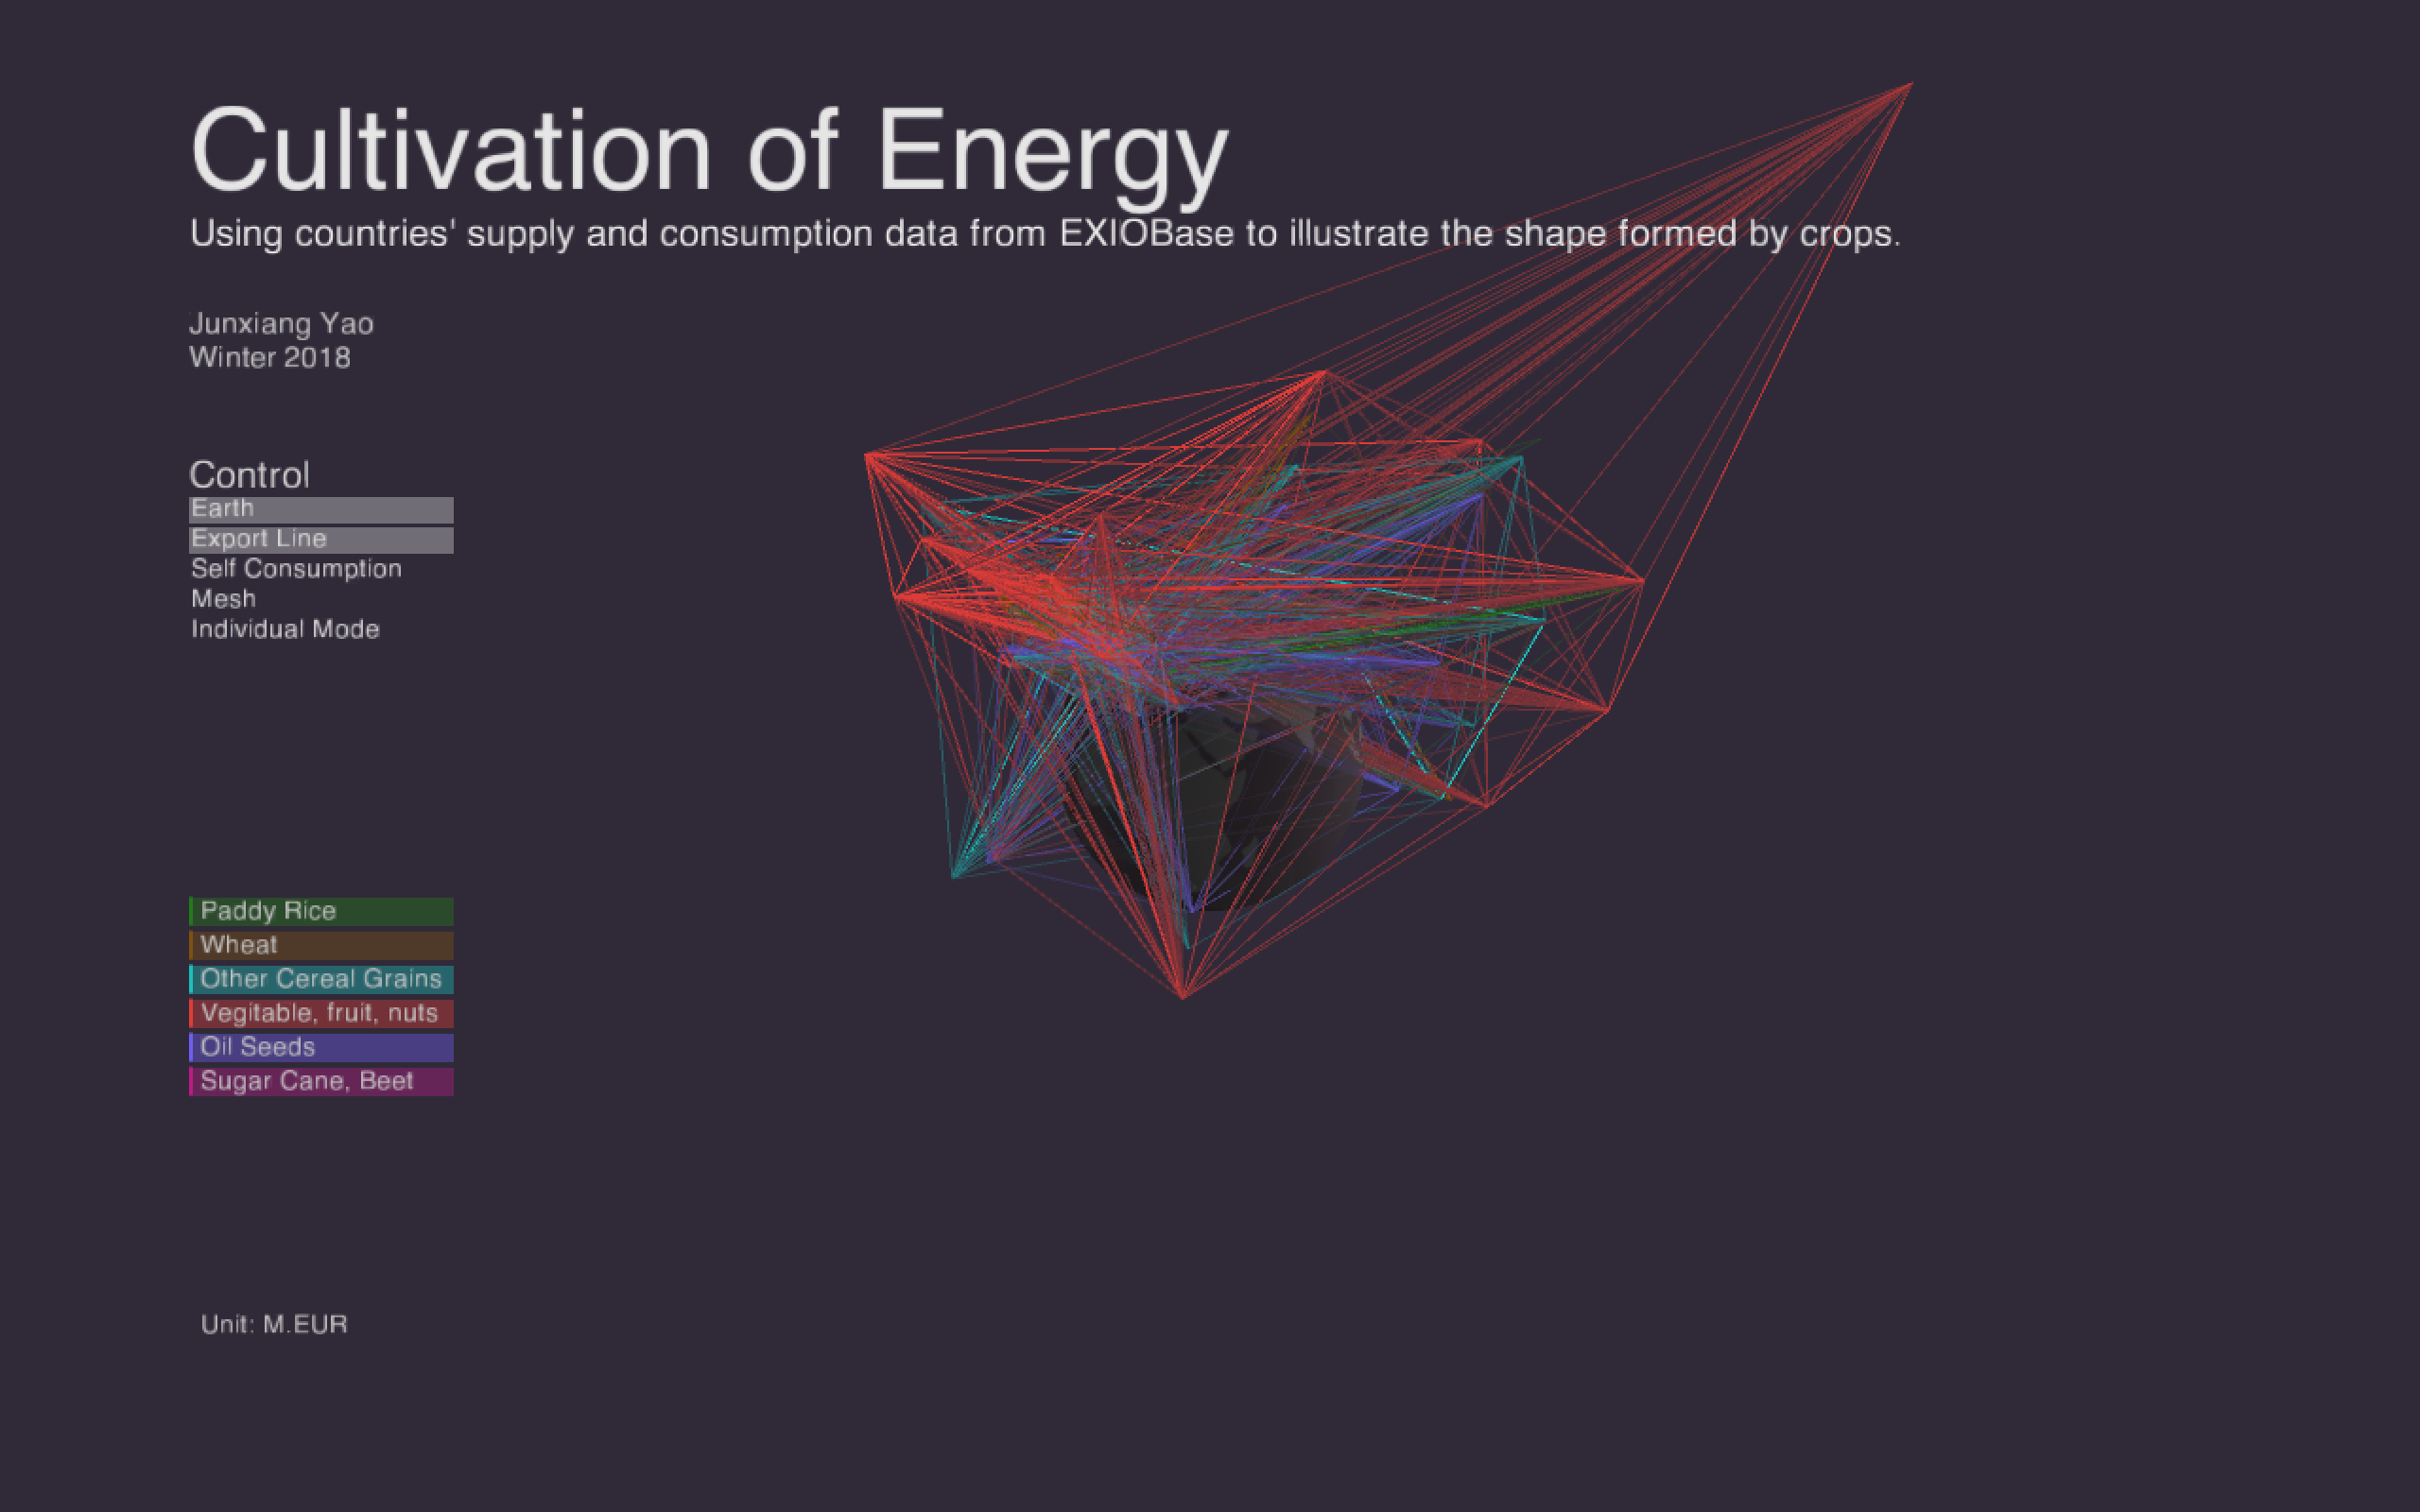
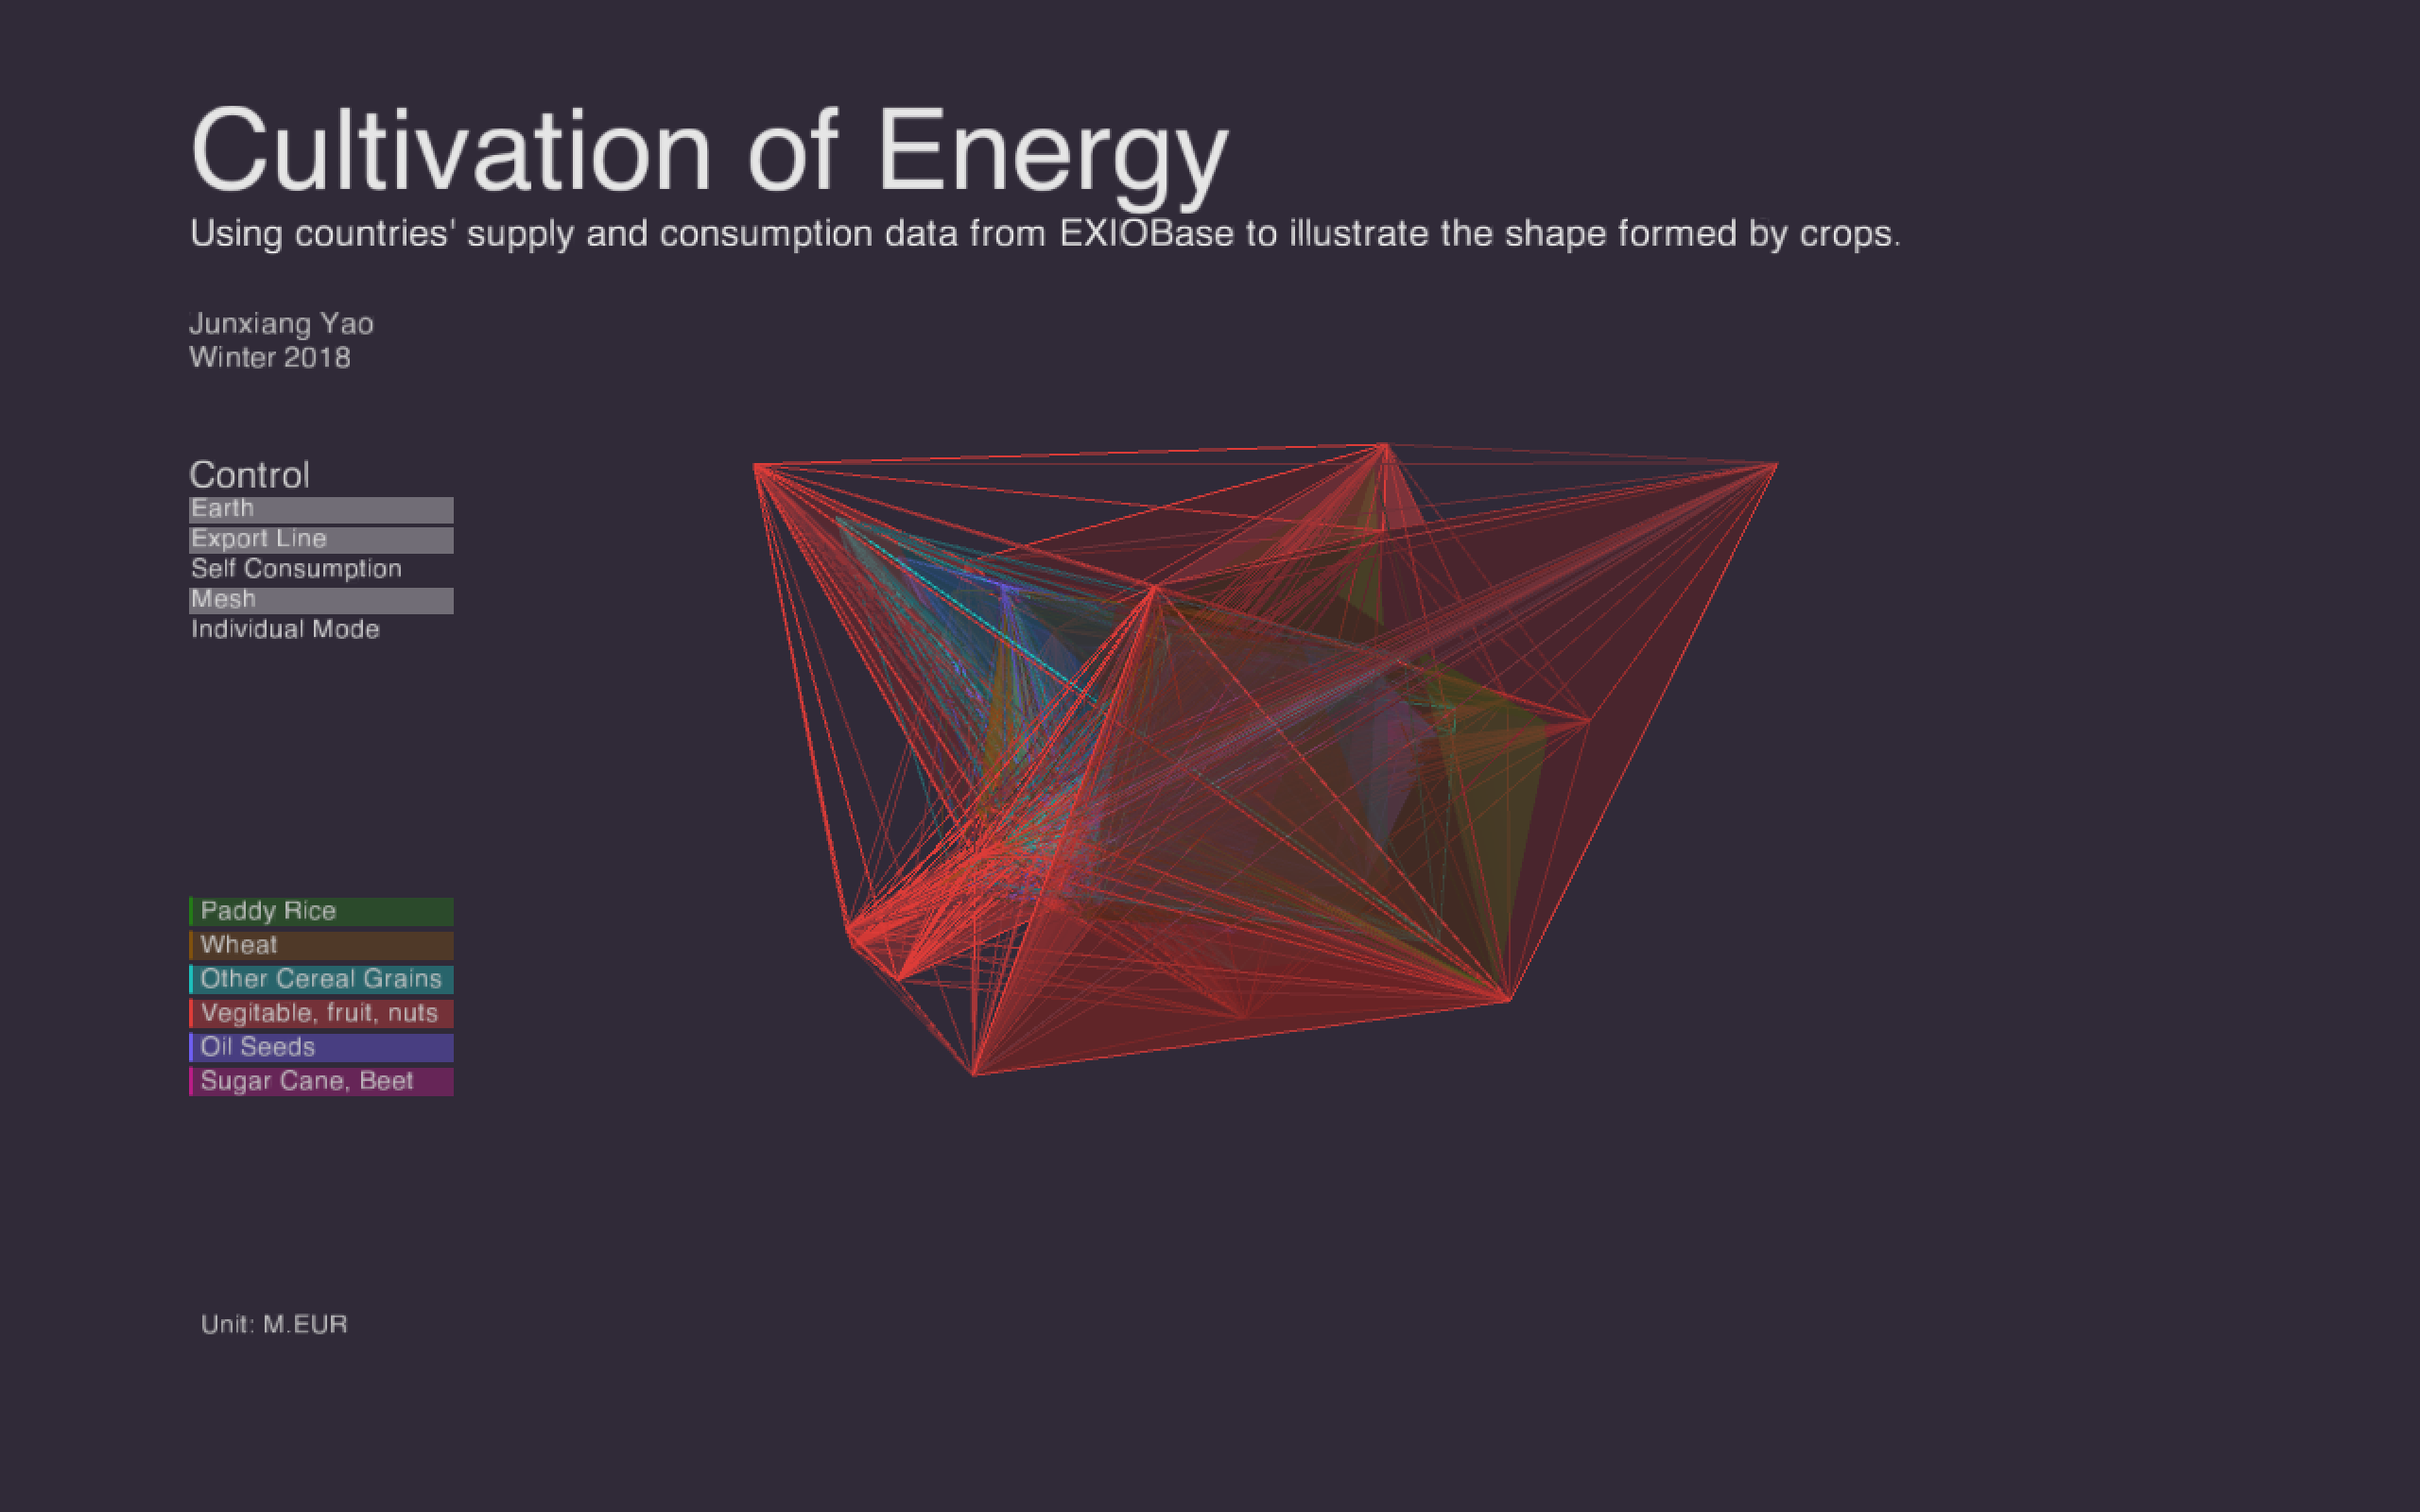
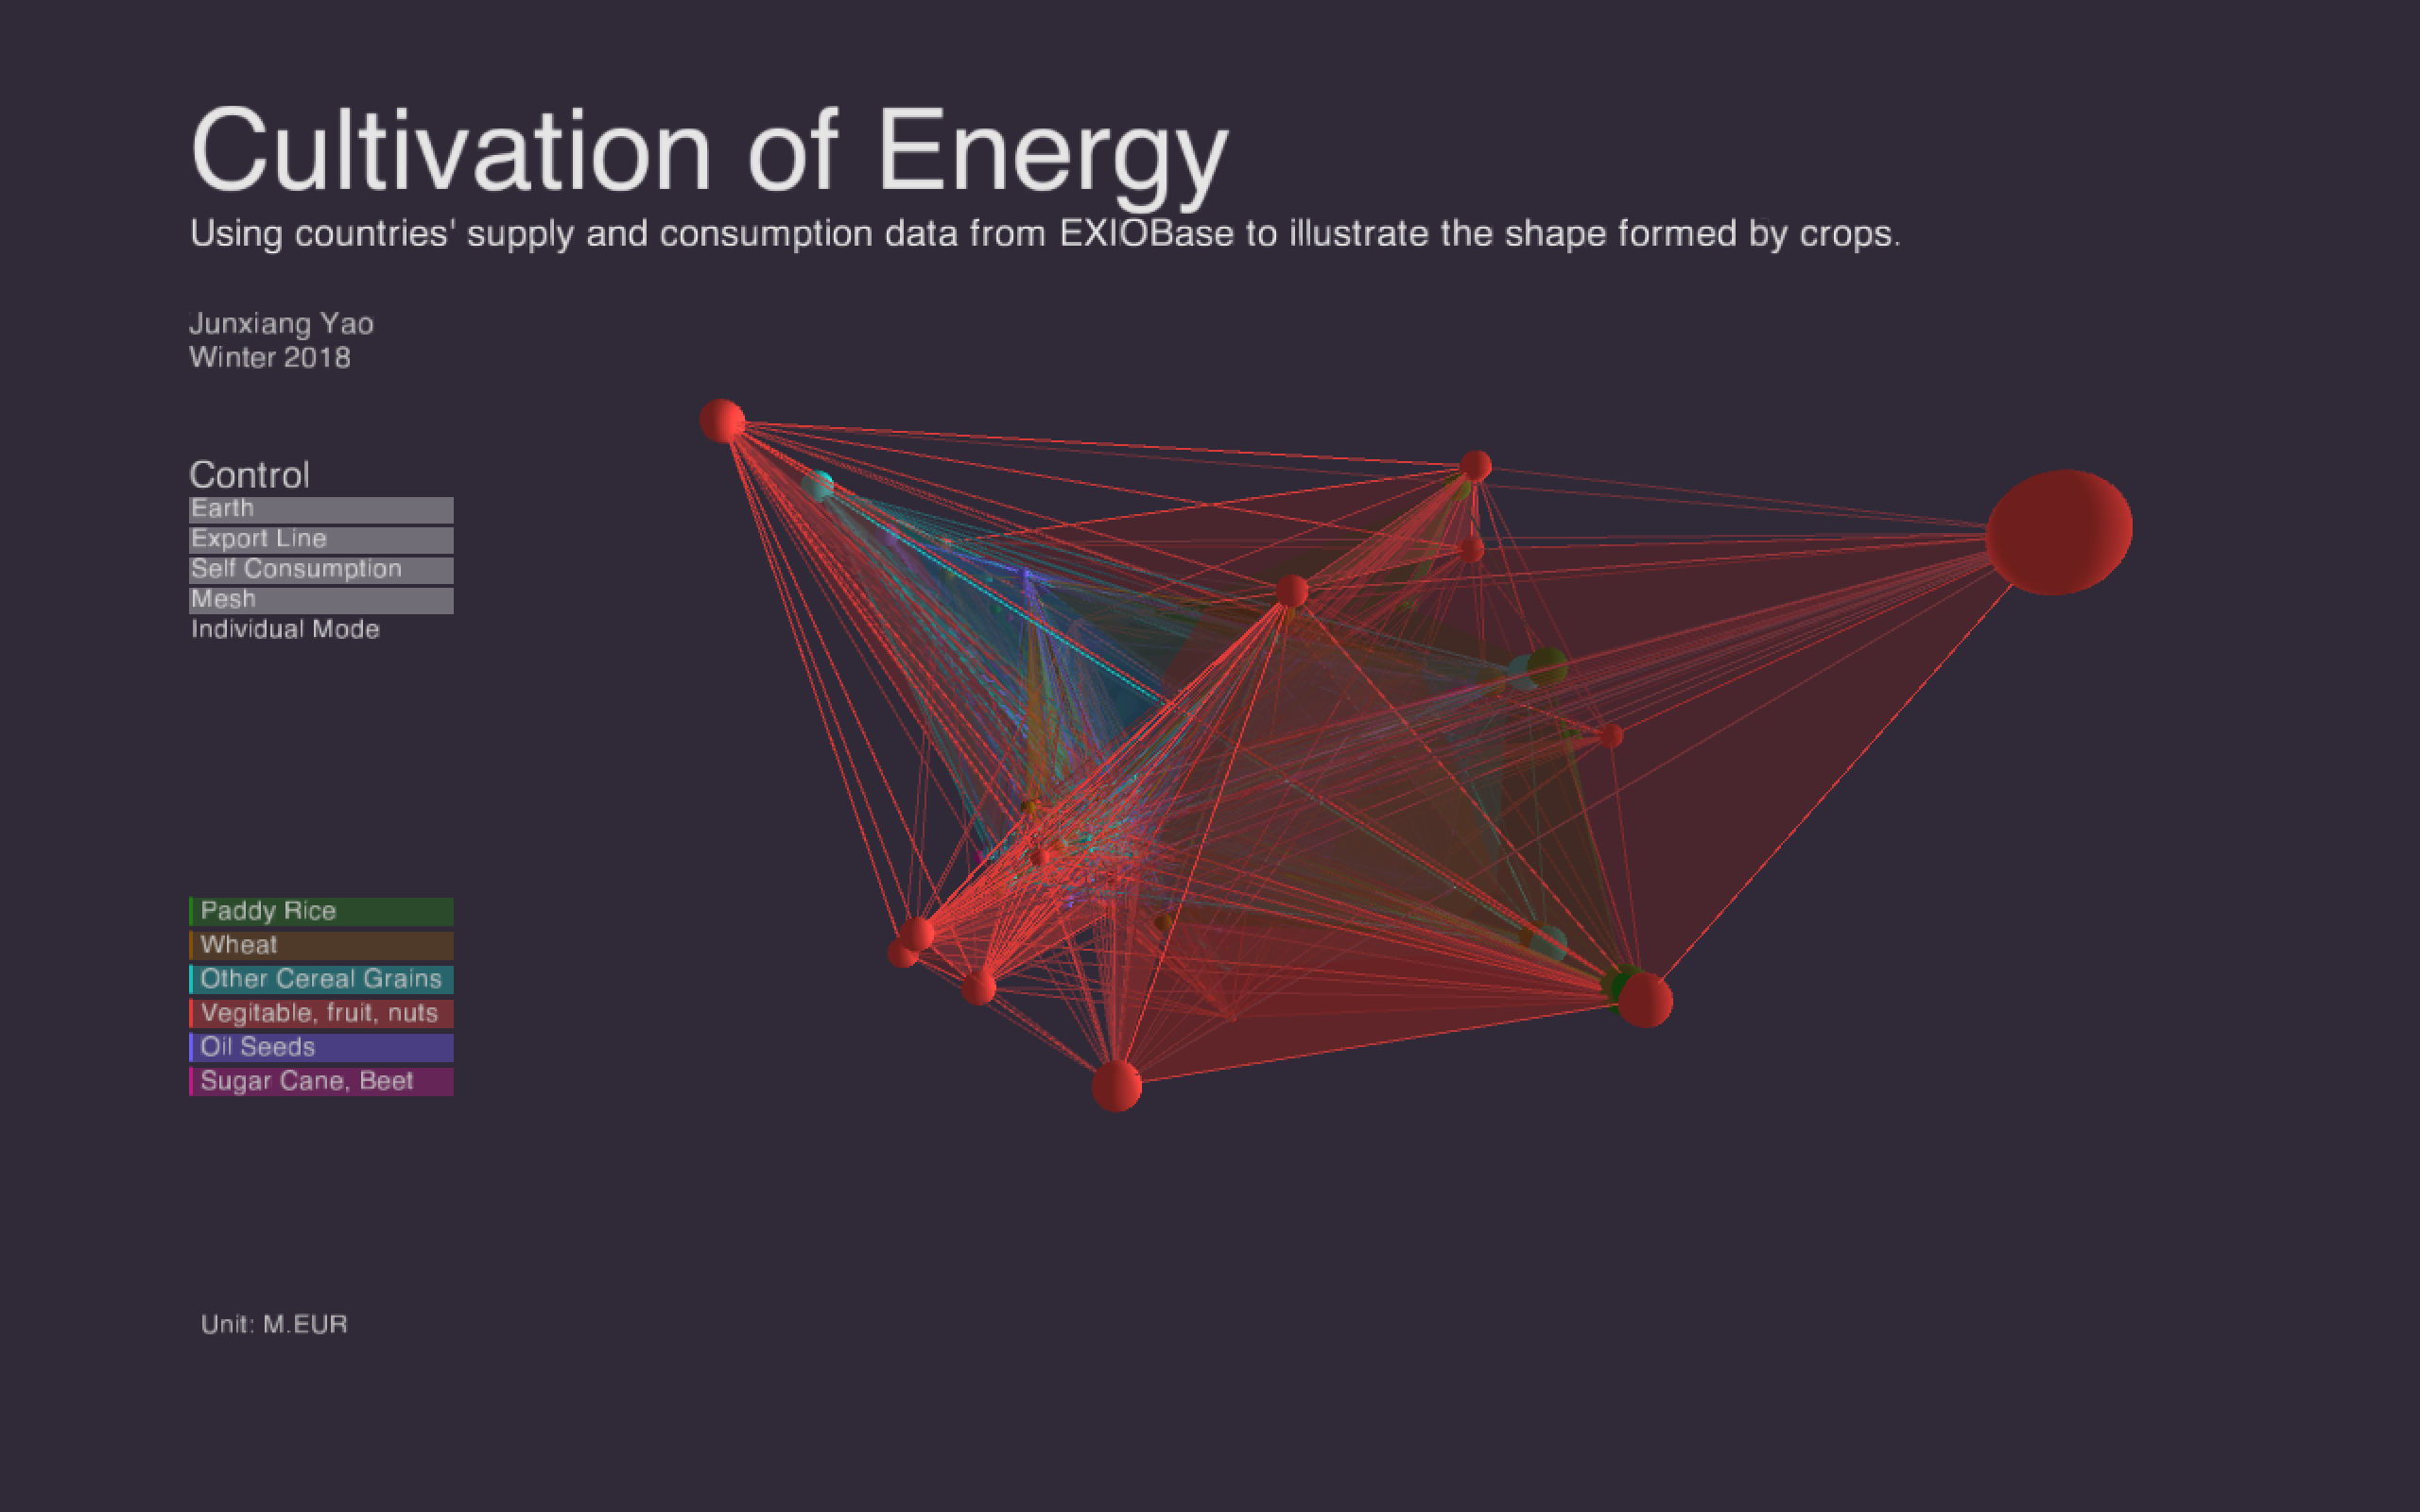
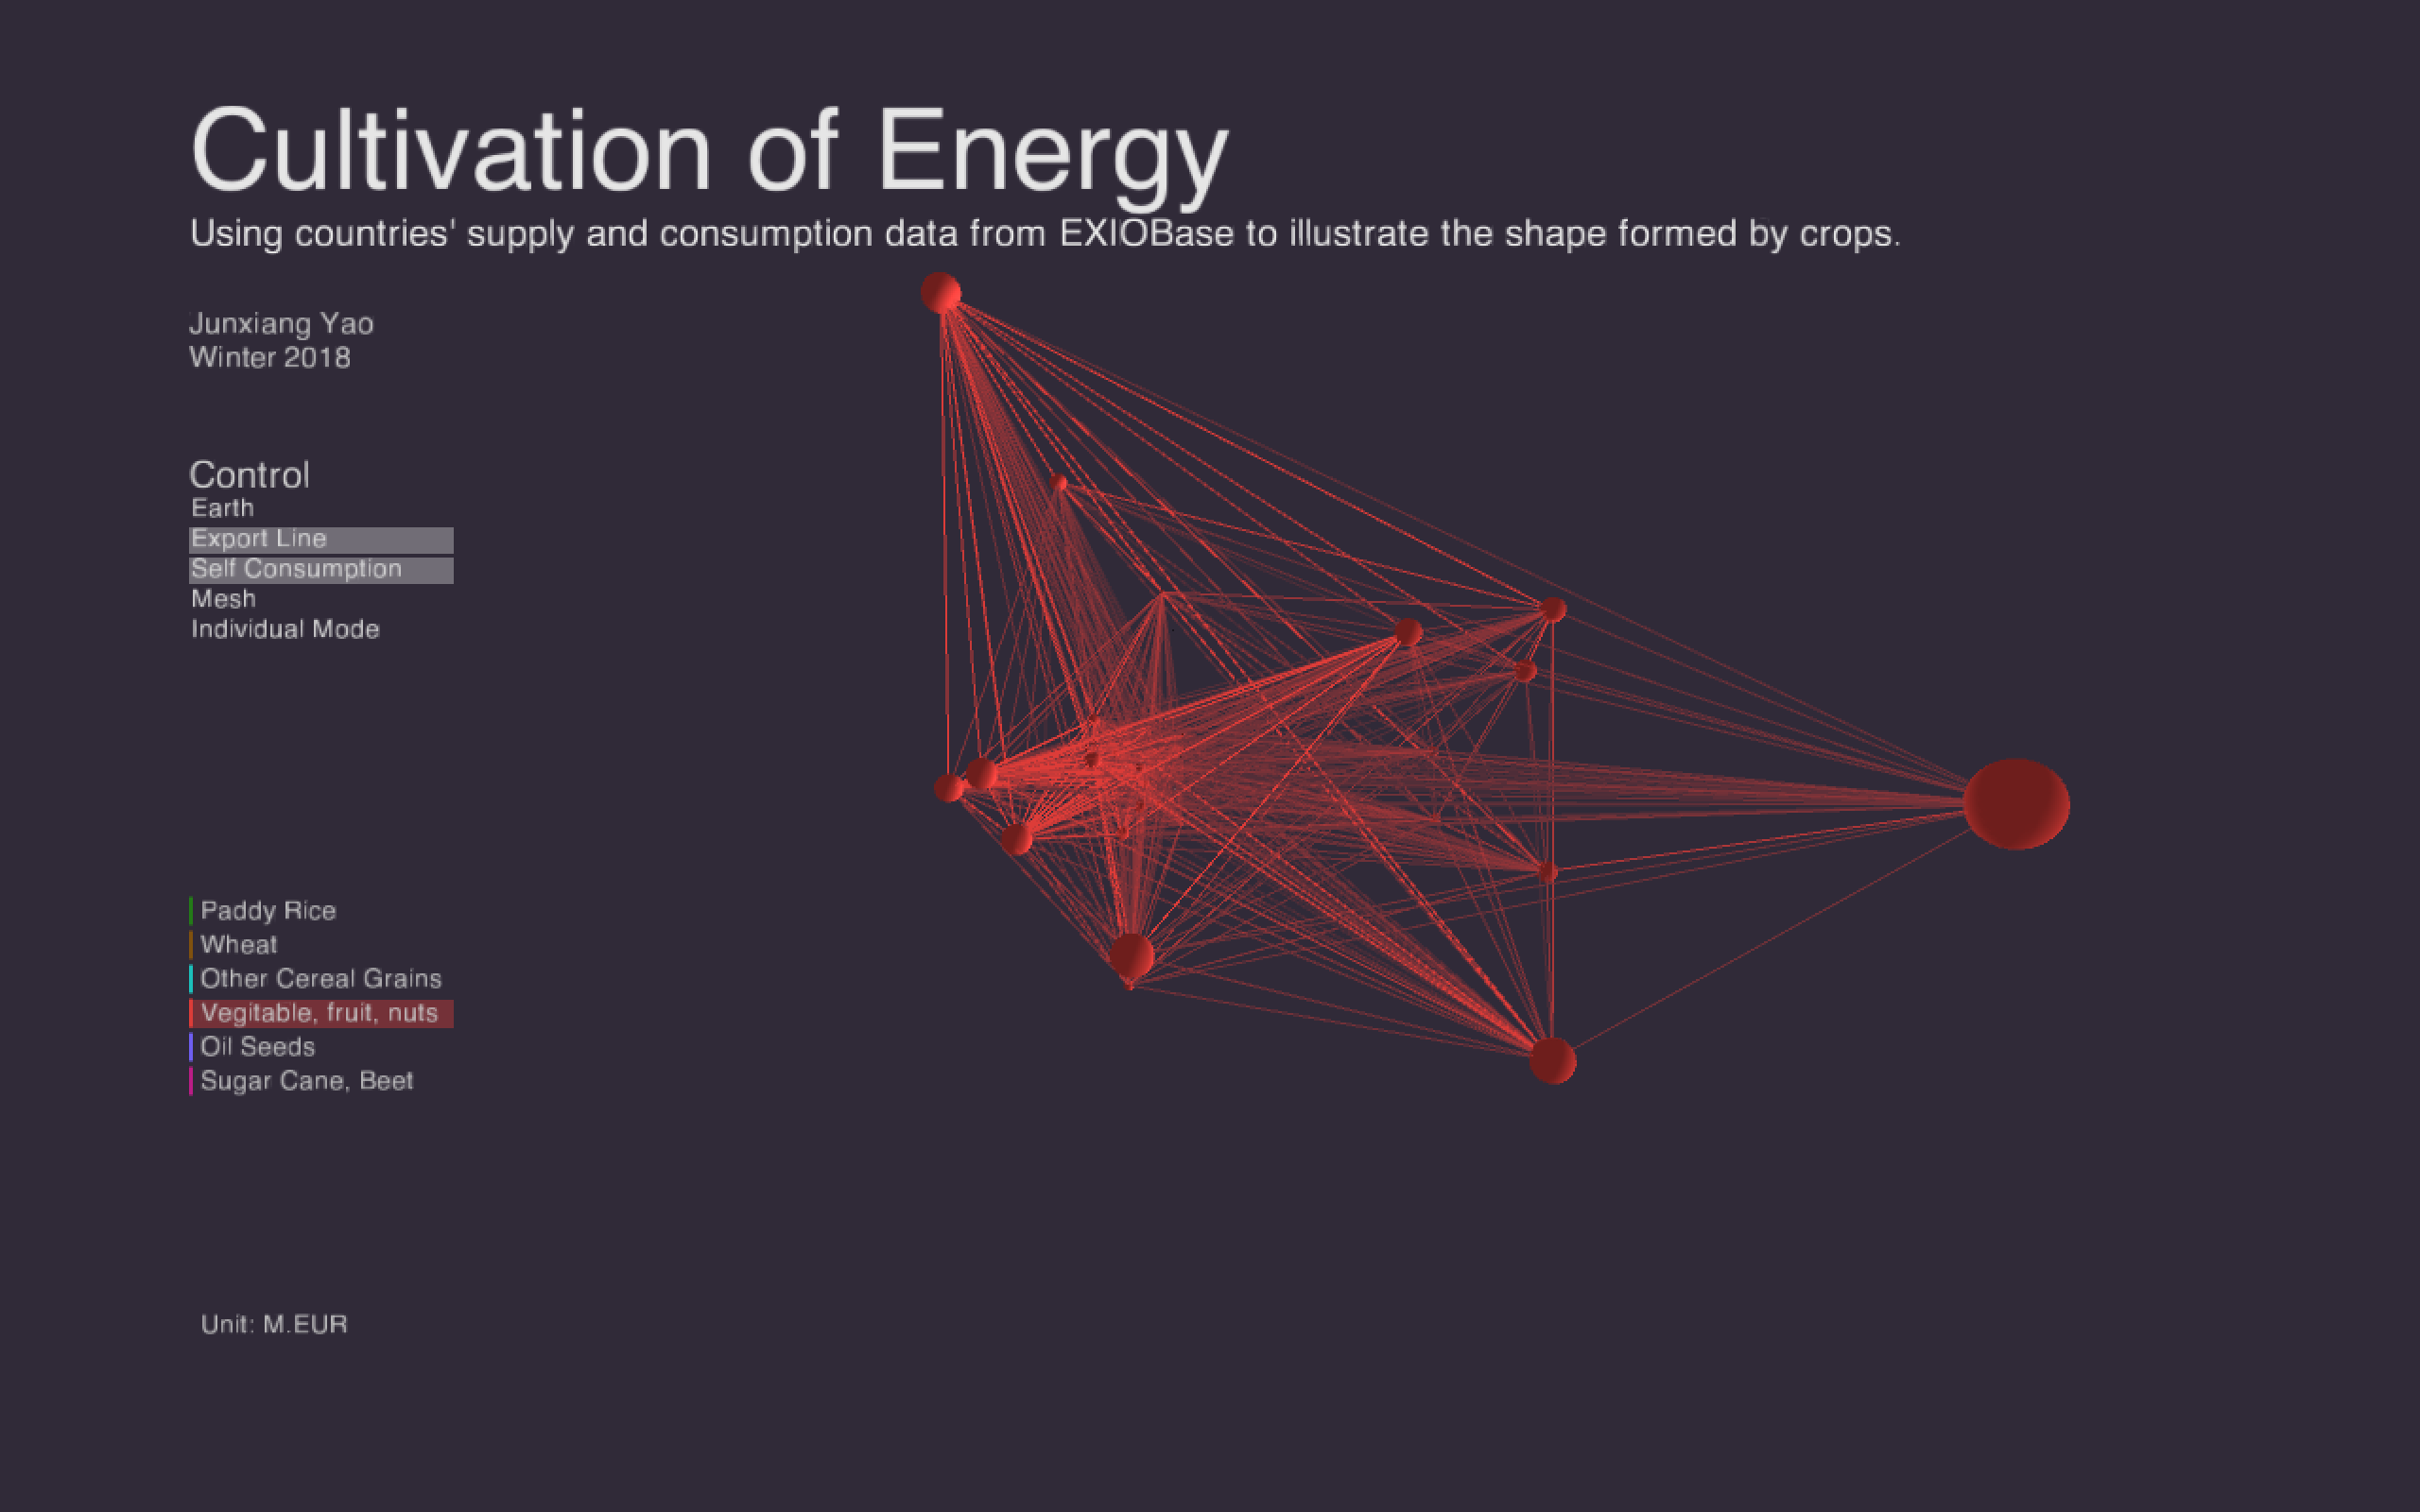
The radius, which is the distance between the center of a sphere and the center of the earth, is the supply value of one kind of crop from a county which the point is presenting. The higher the point from the surface of the globe, the larger the supply value will be.
The radius of the sphere at every vertex is controlled by the self consumption data. The larger the sphere indicates the larger self consumption.
If a country consumed certain kind of crop from another country, there will be a line drawn between the two points. The brightness of the line shows the amount of international consumption between this two country. And when displaying all the data, a net was formed consisted of all the lines.
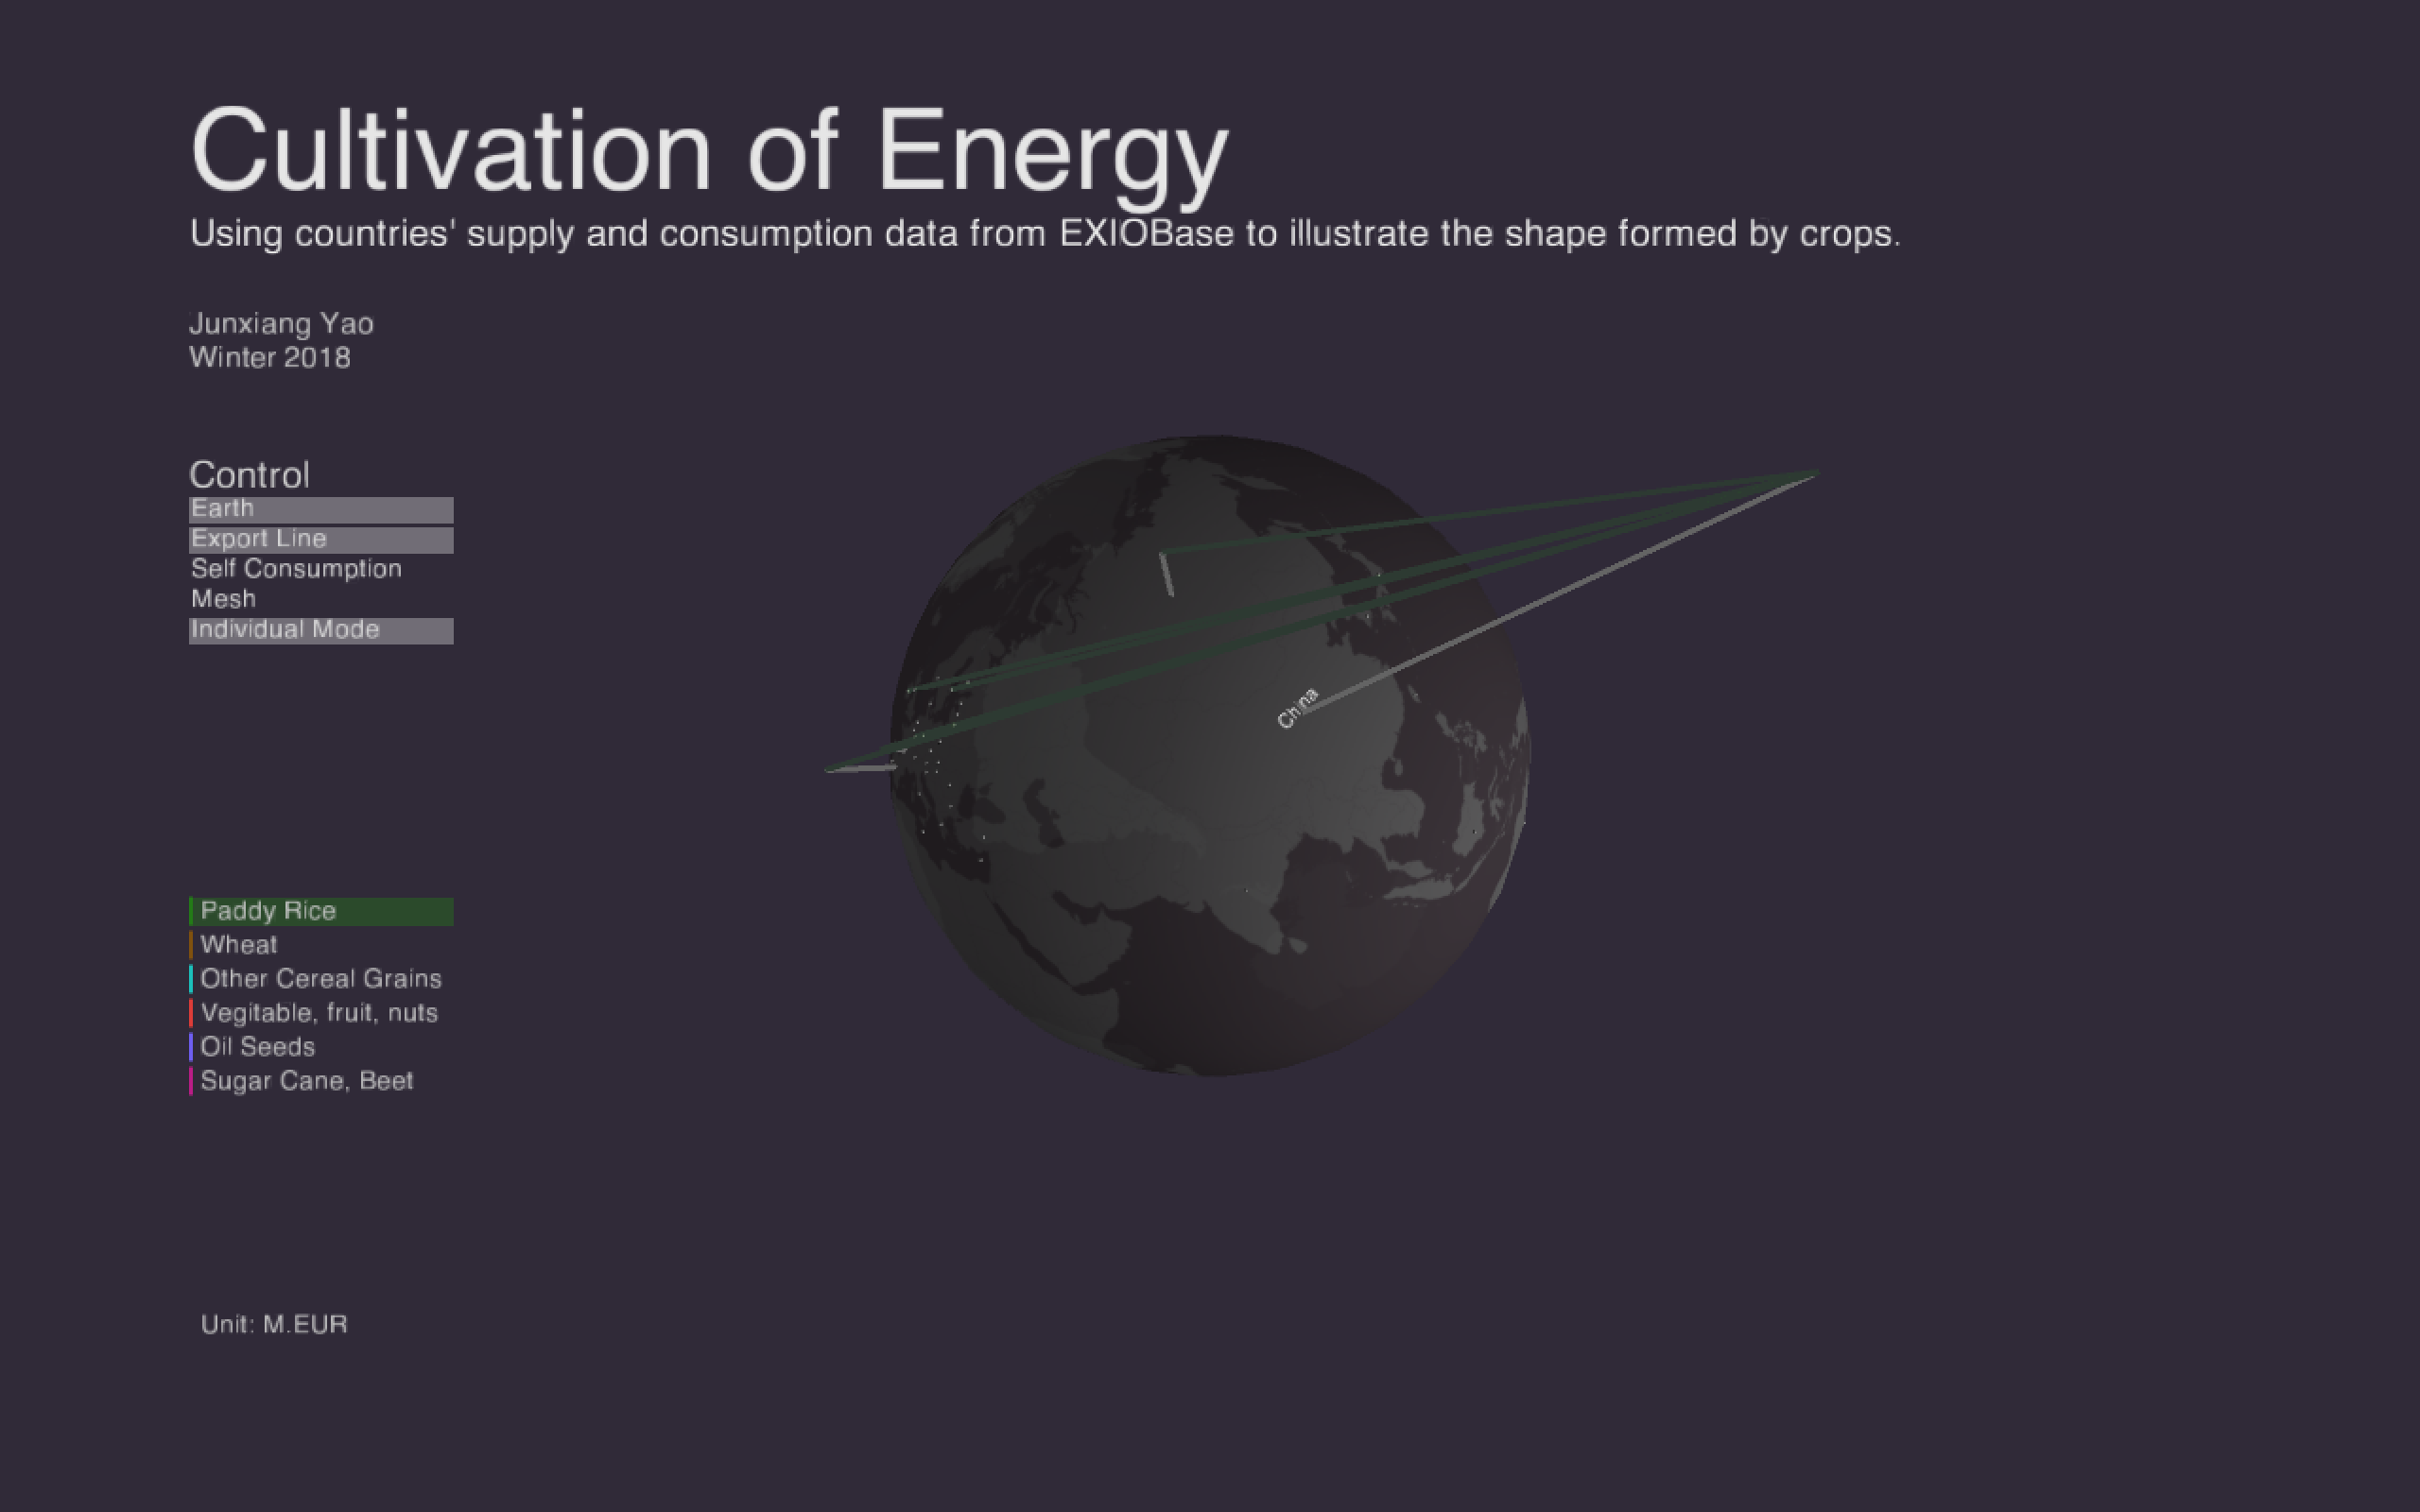
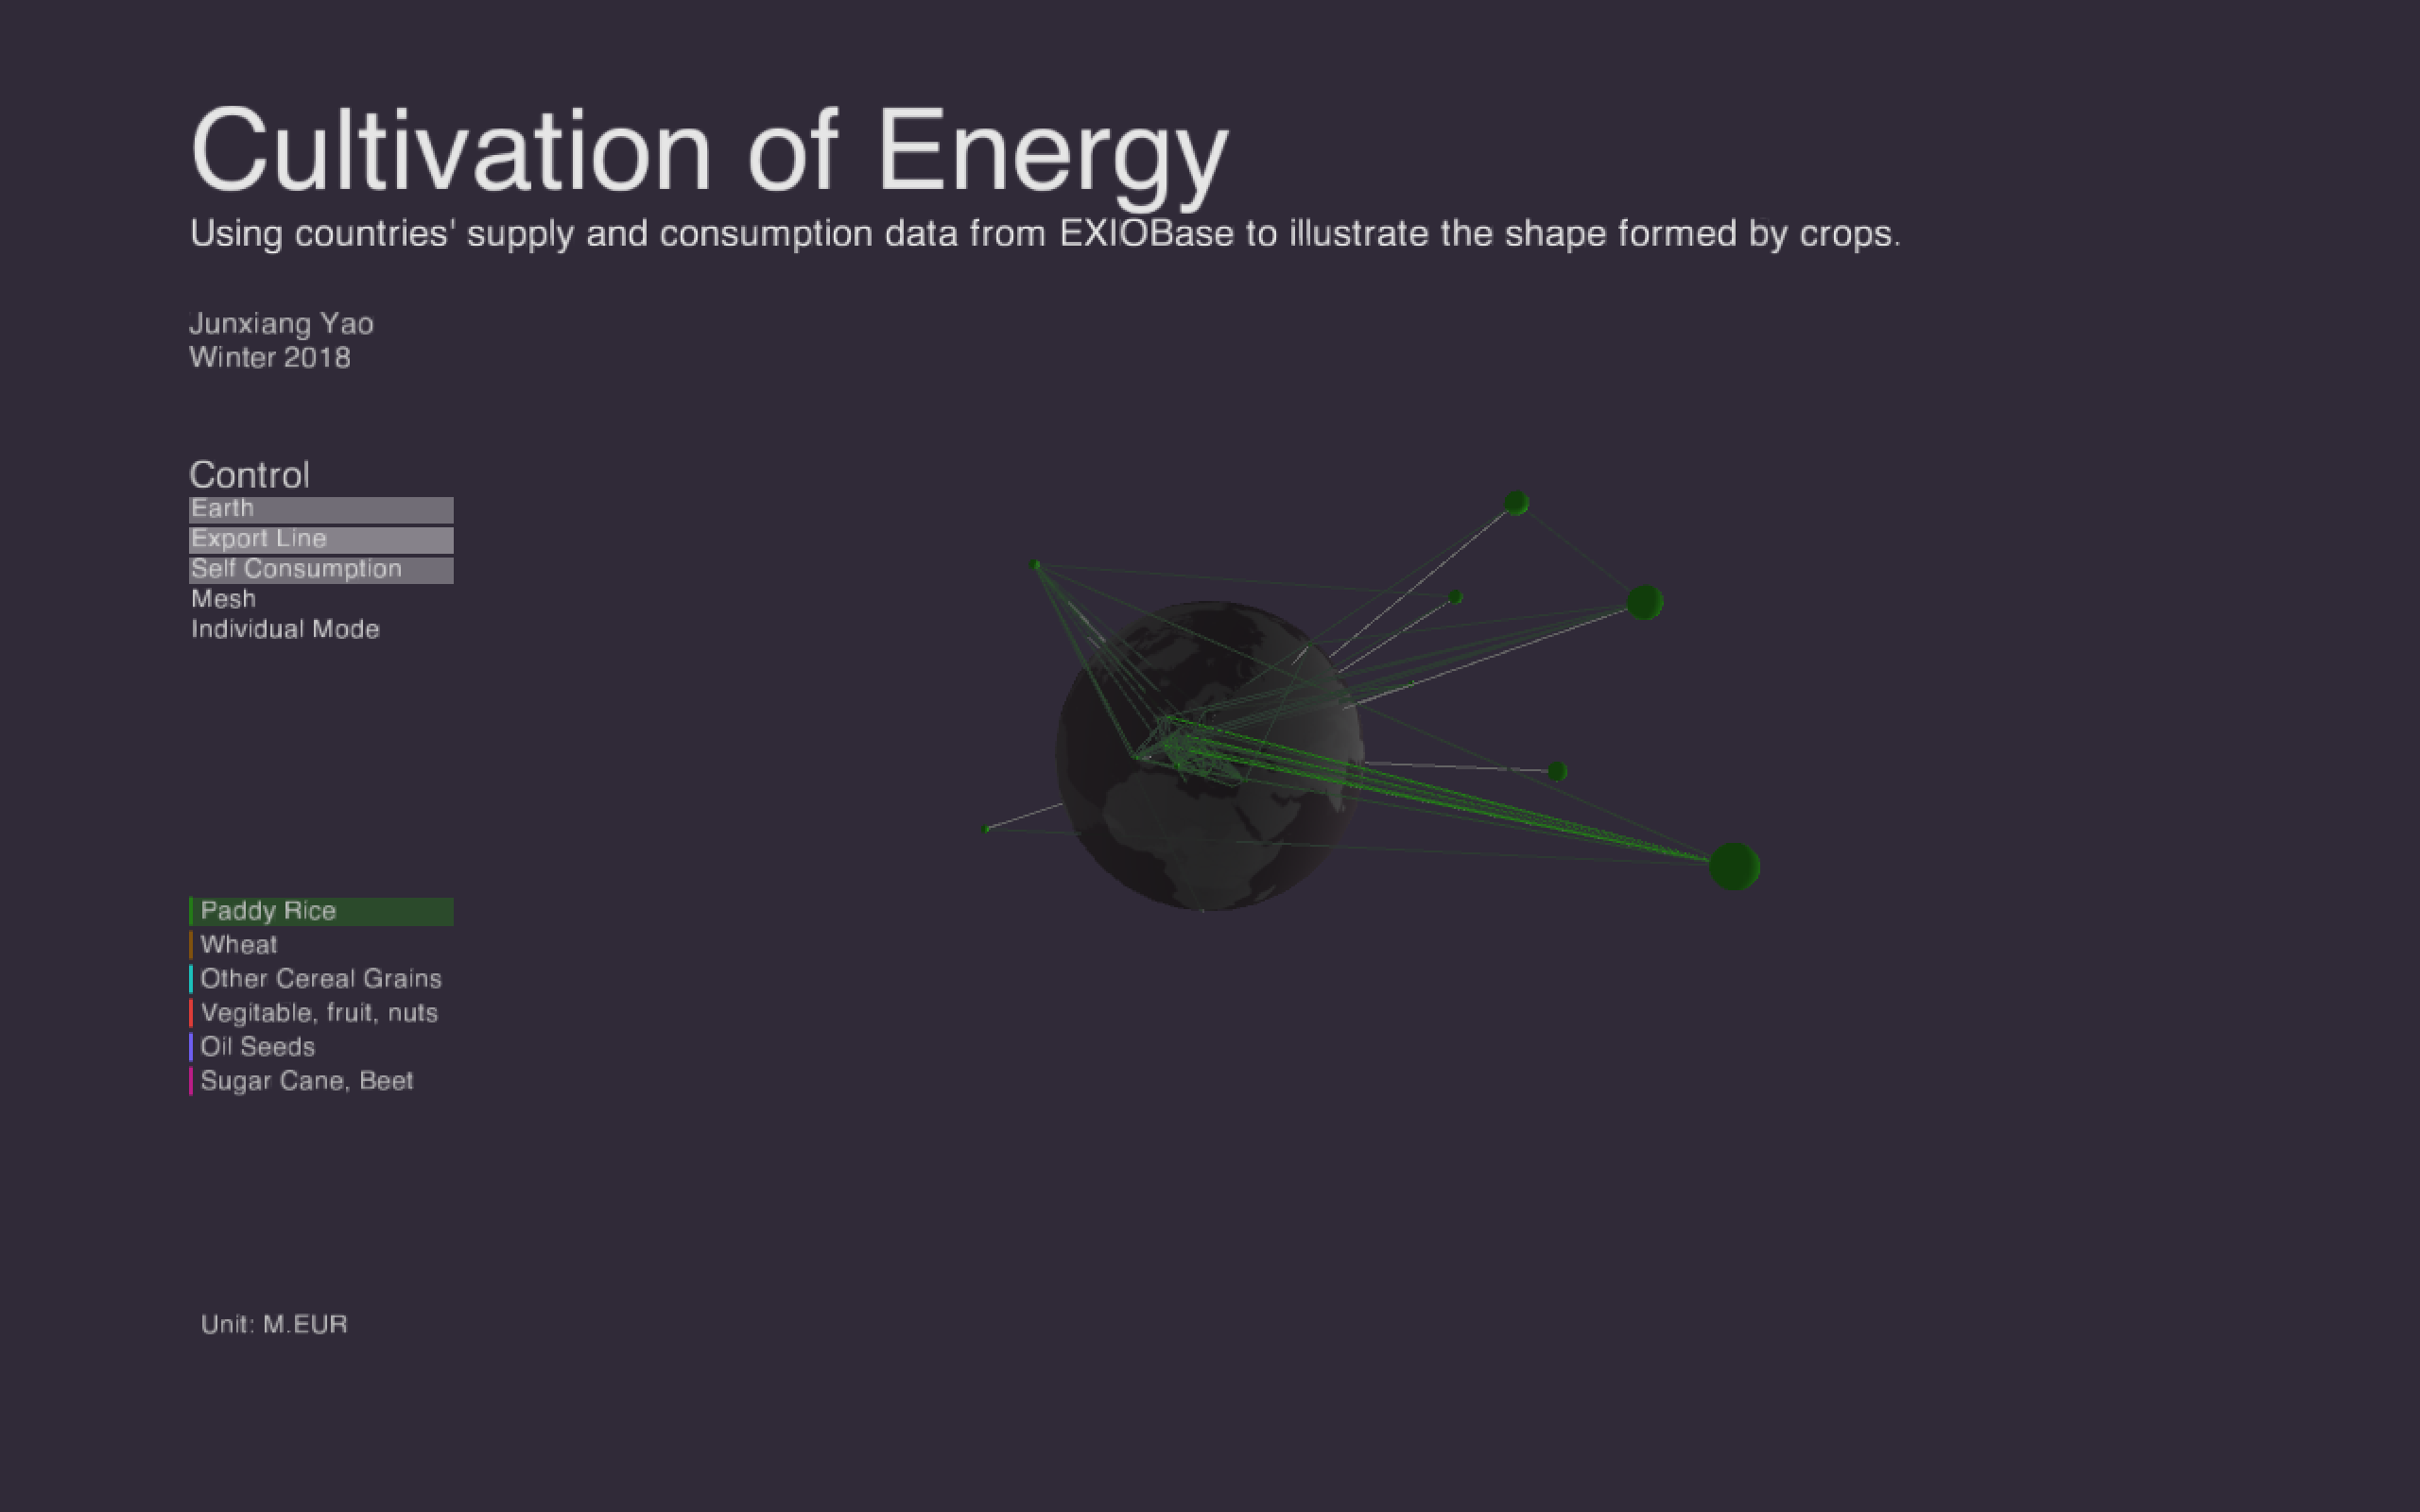
Also, there is a individual mode which enable the user to check one country in detail on the globe.
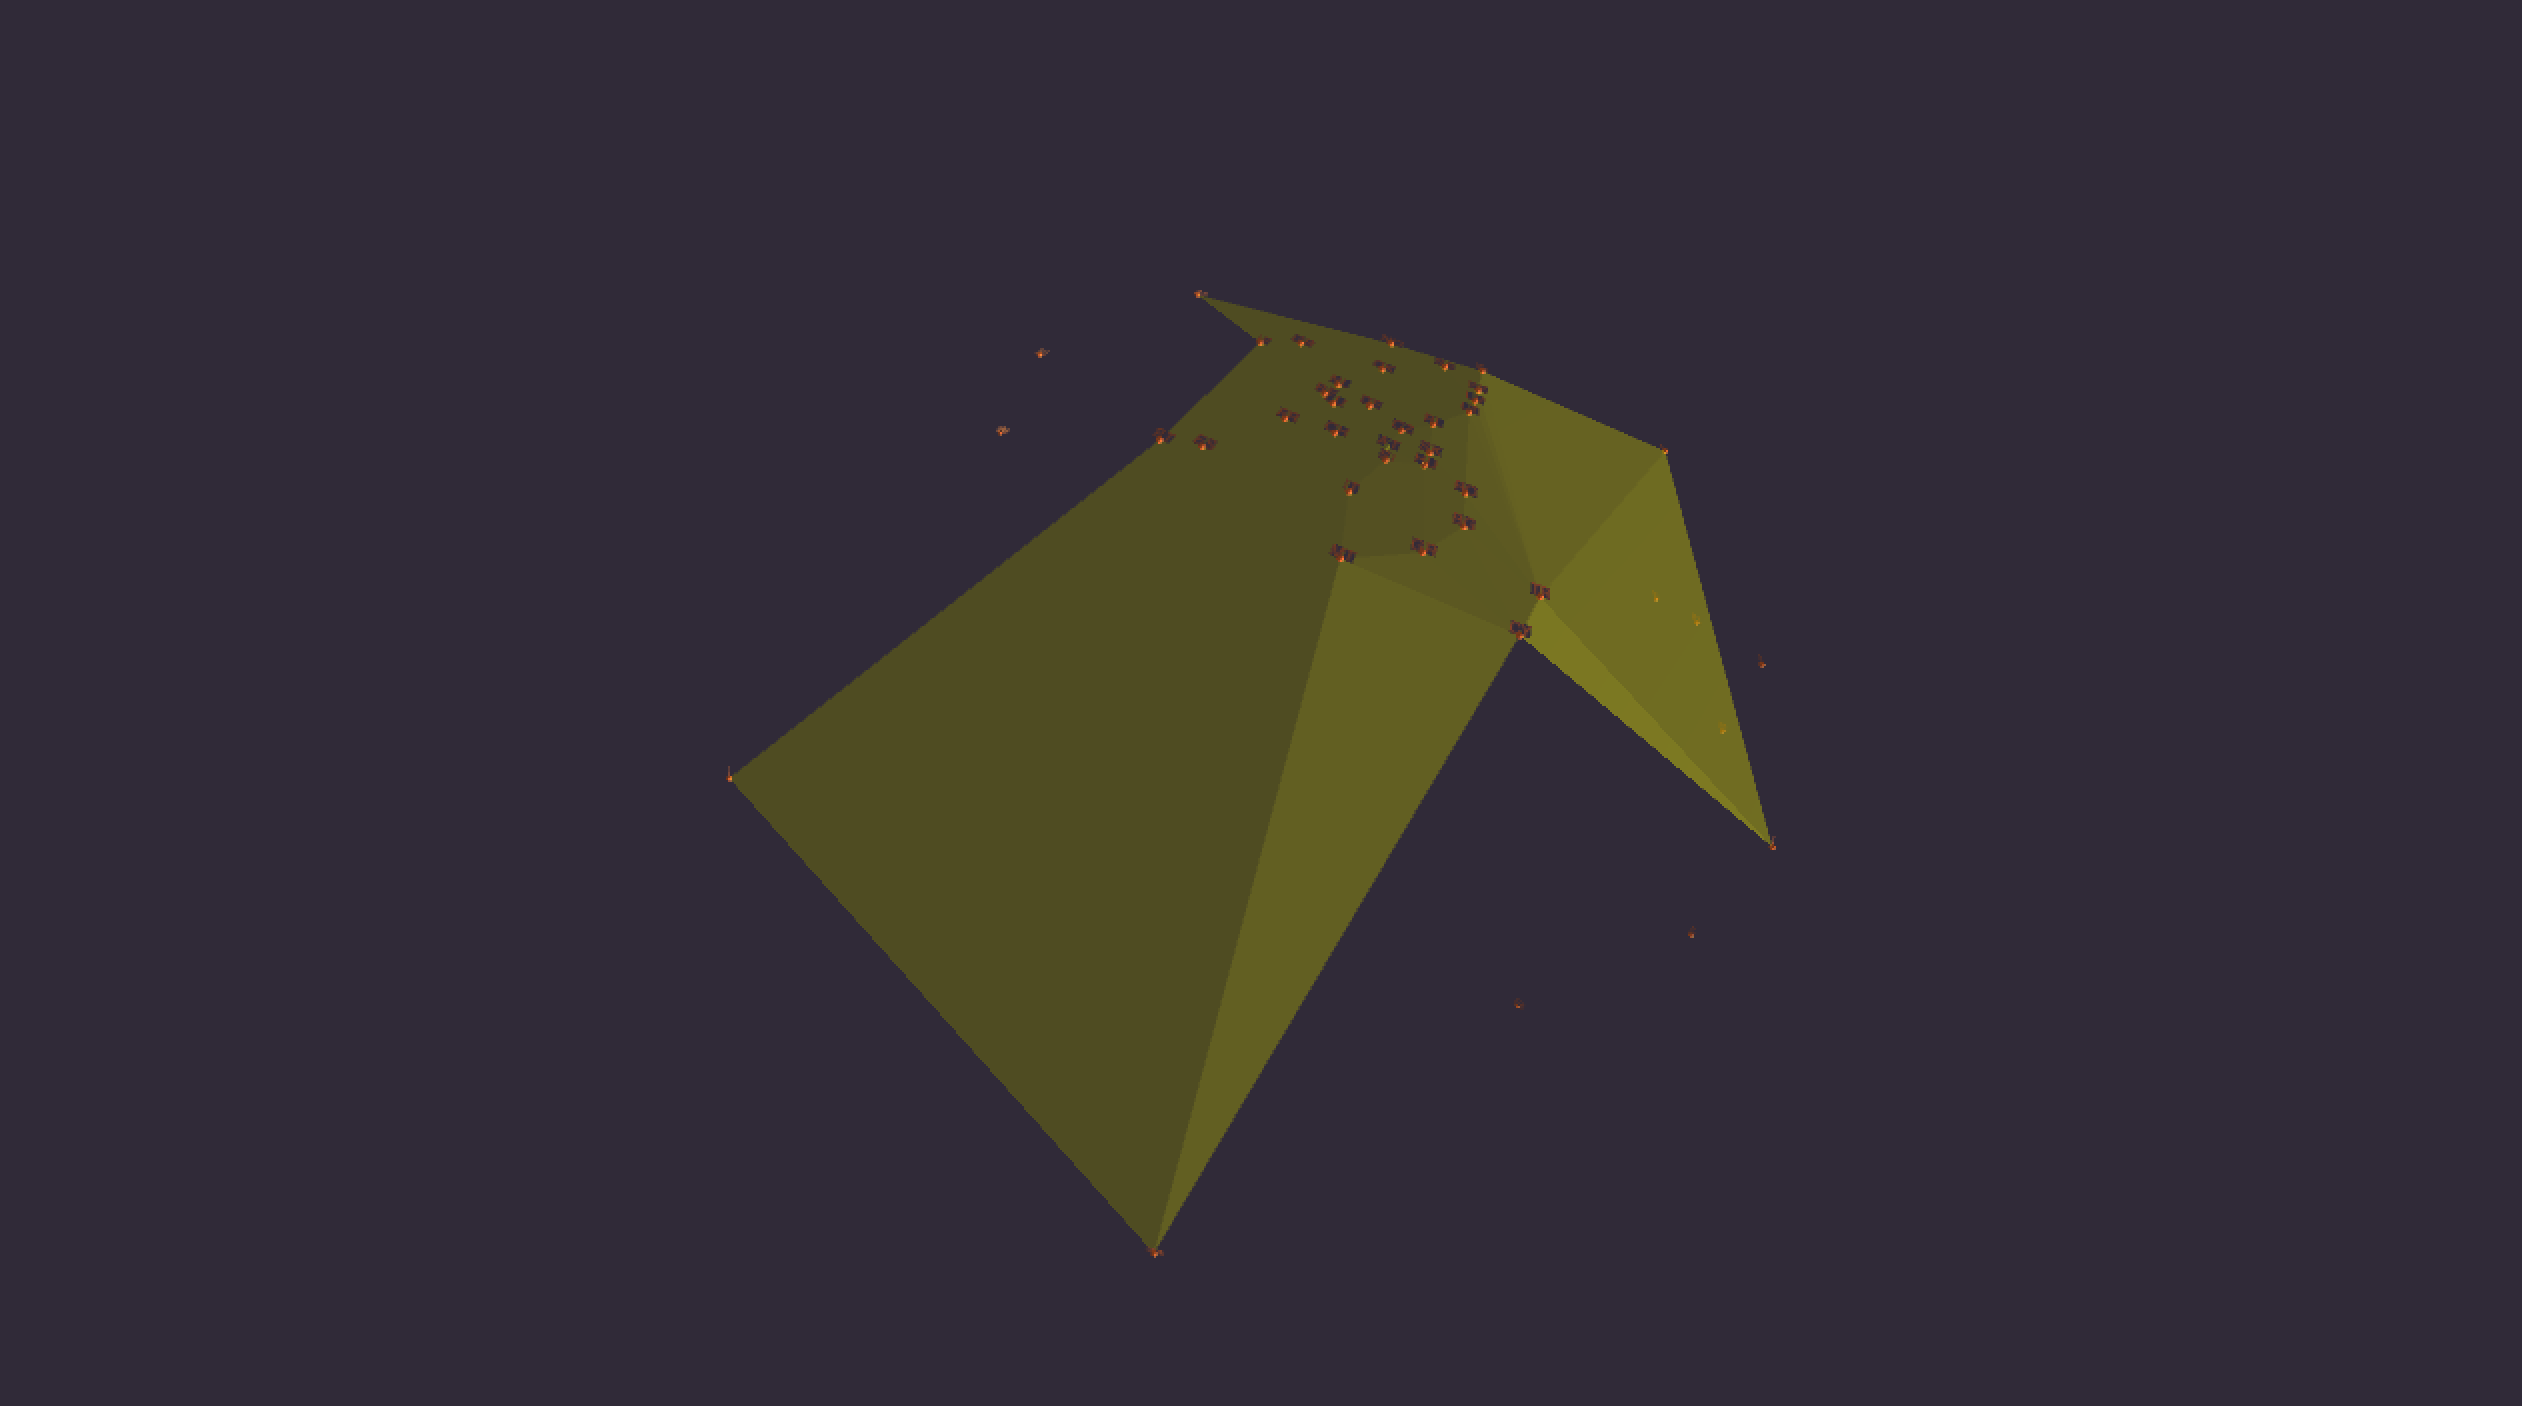
Wheat and rice.
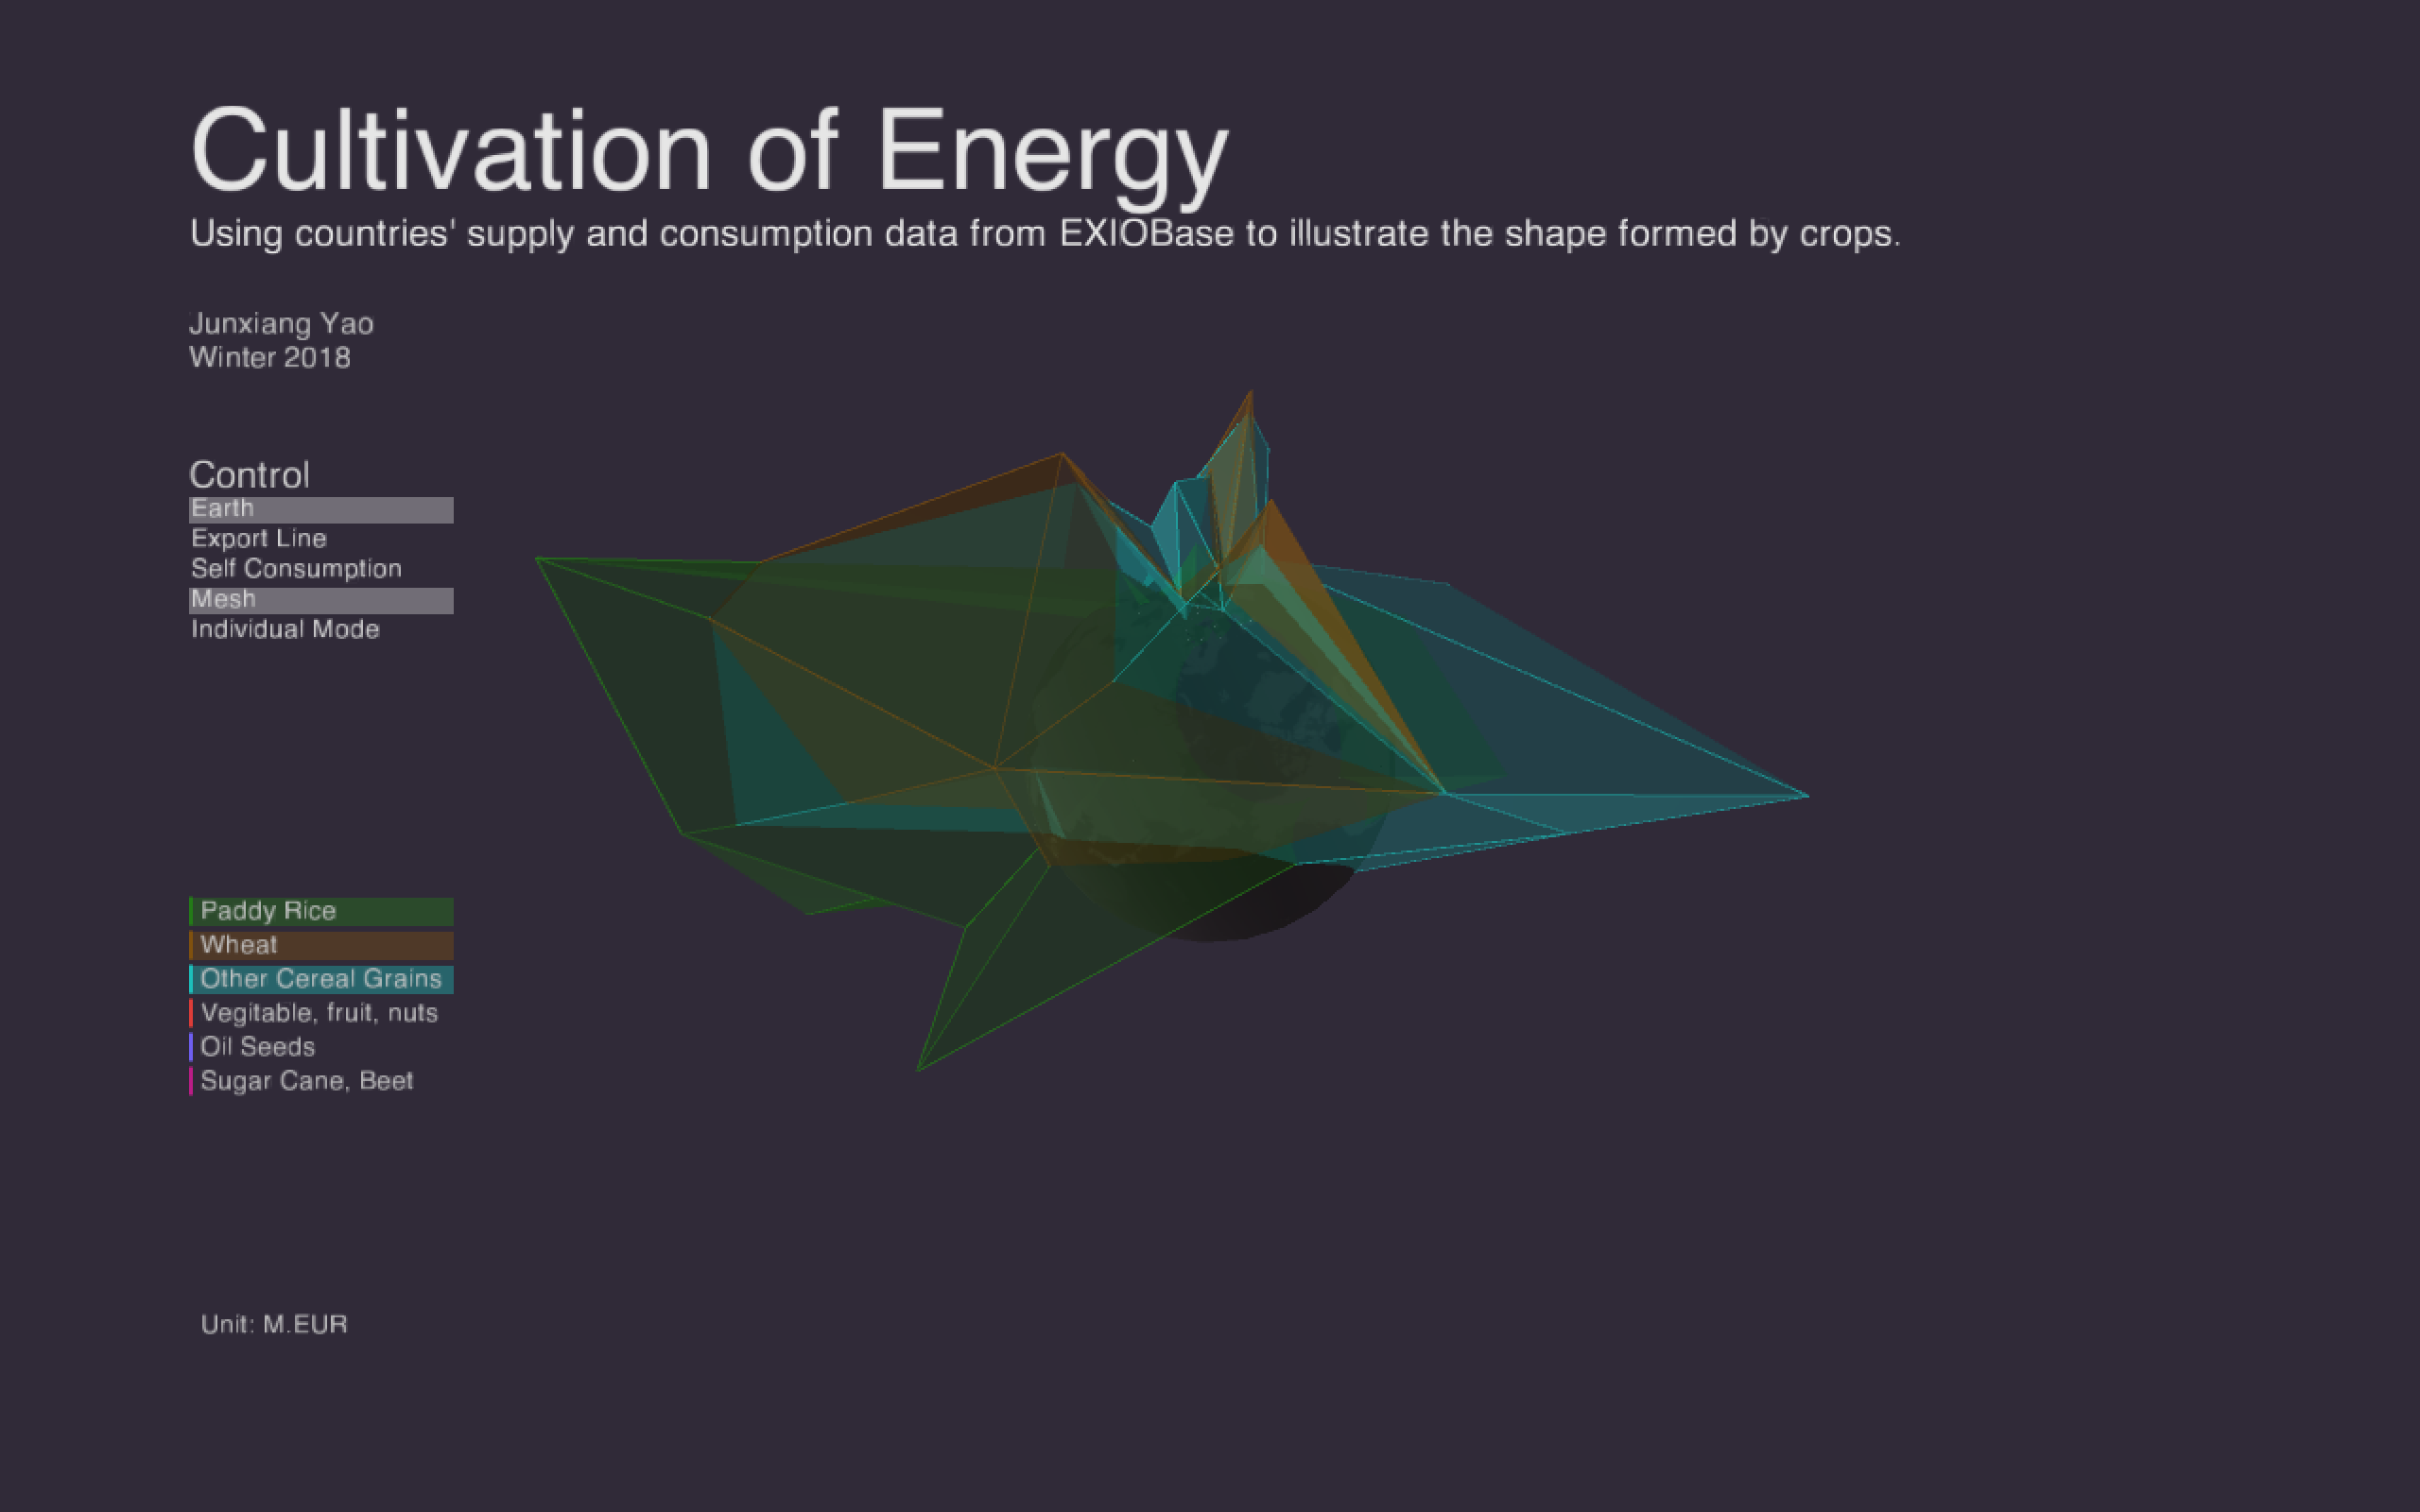
Rice's peak is in Asia (India), whereas the peak of other cereal is in America (US).
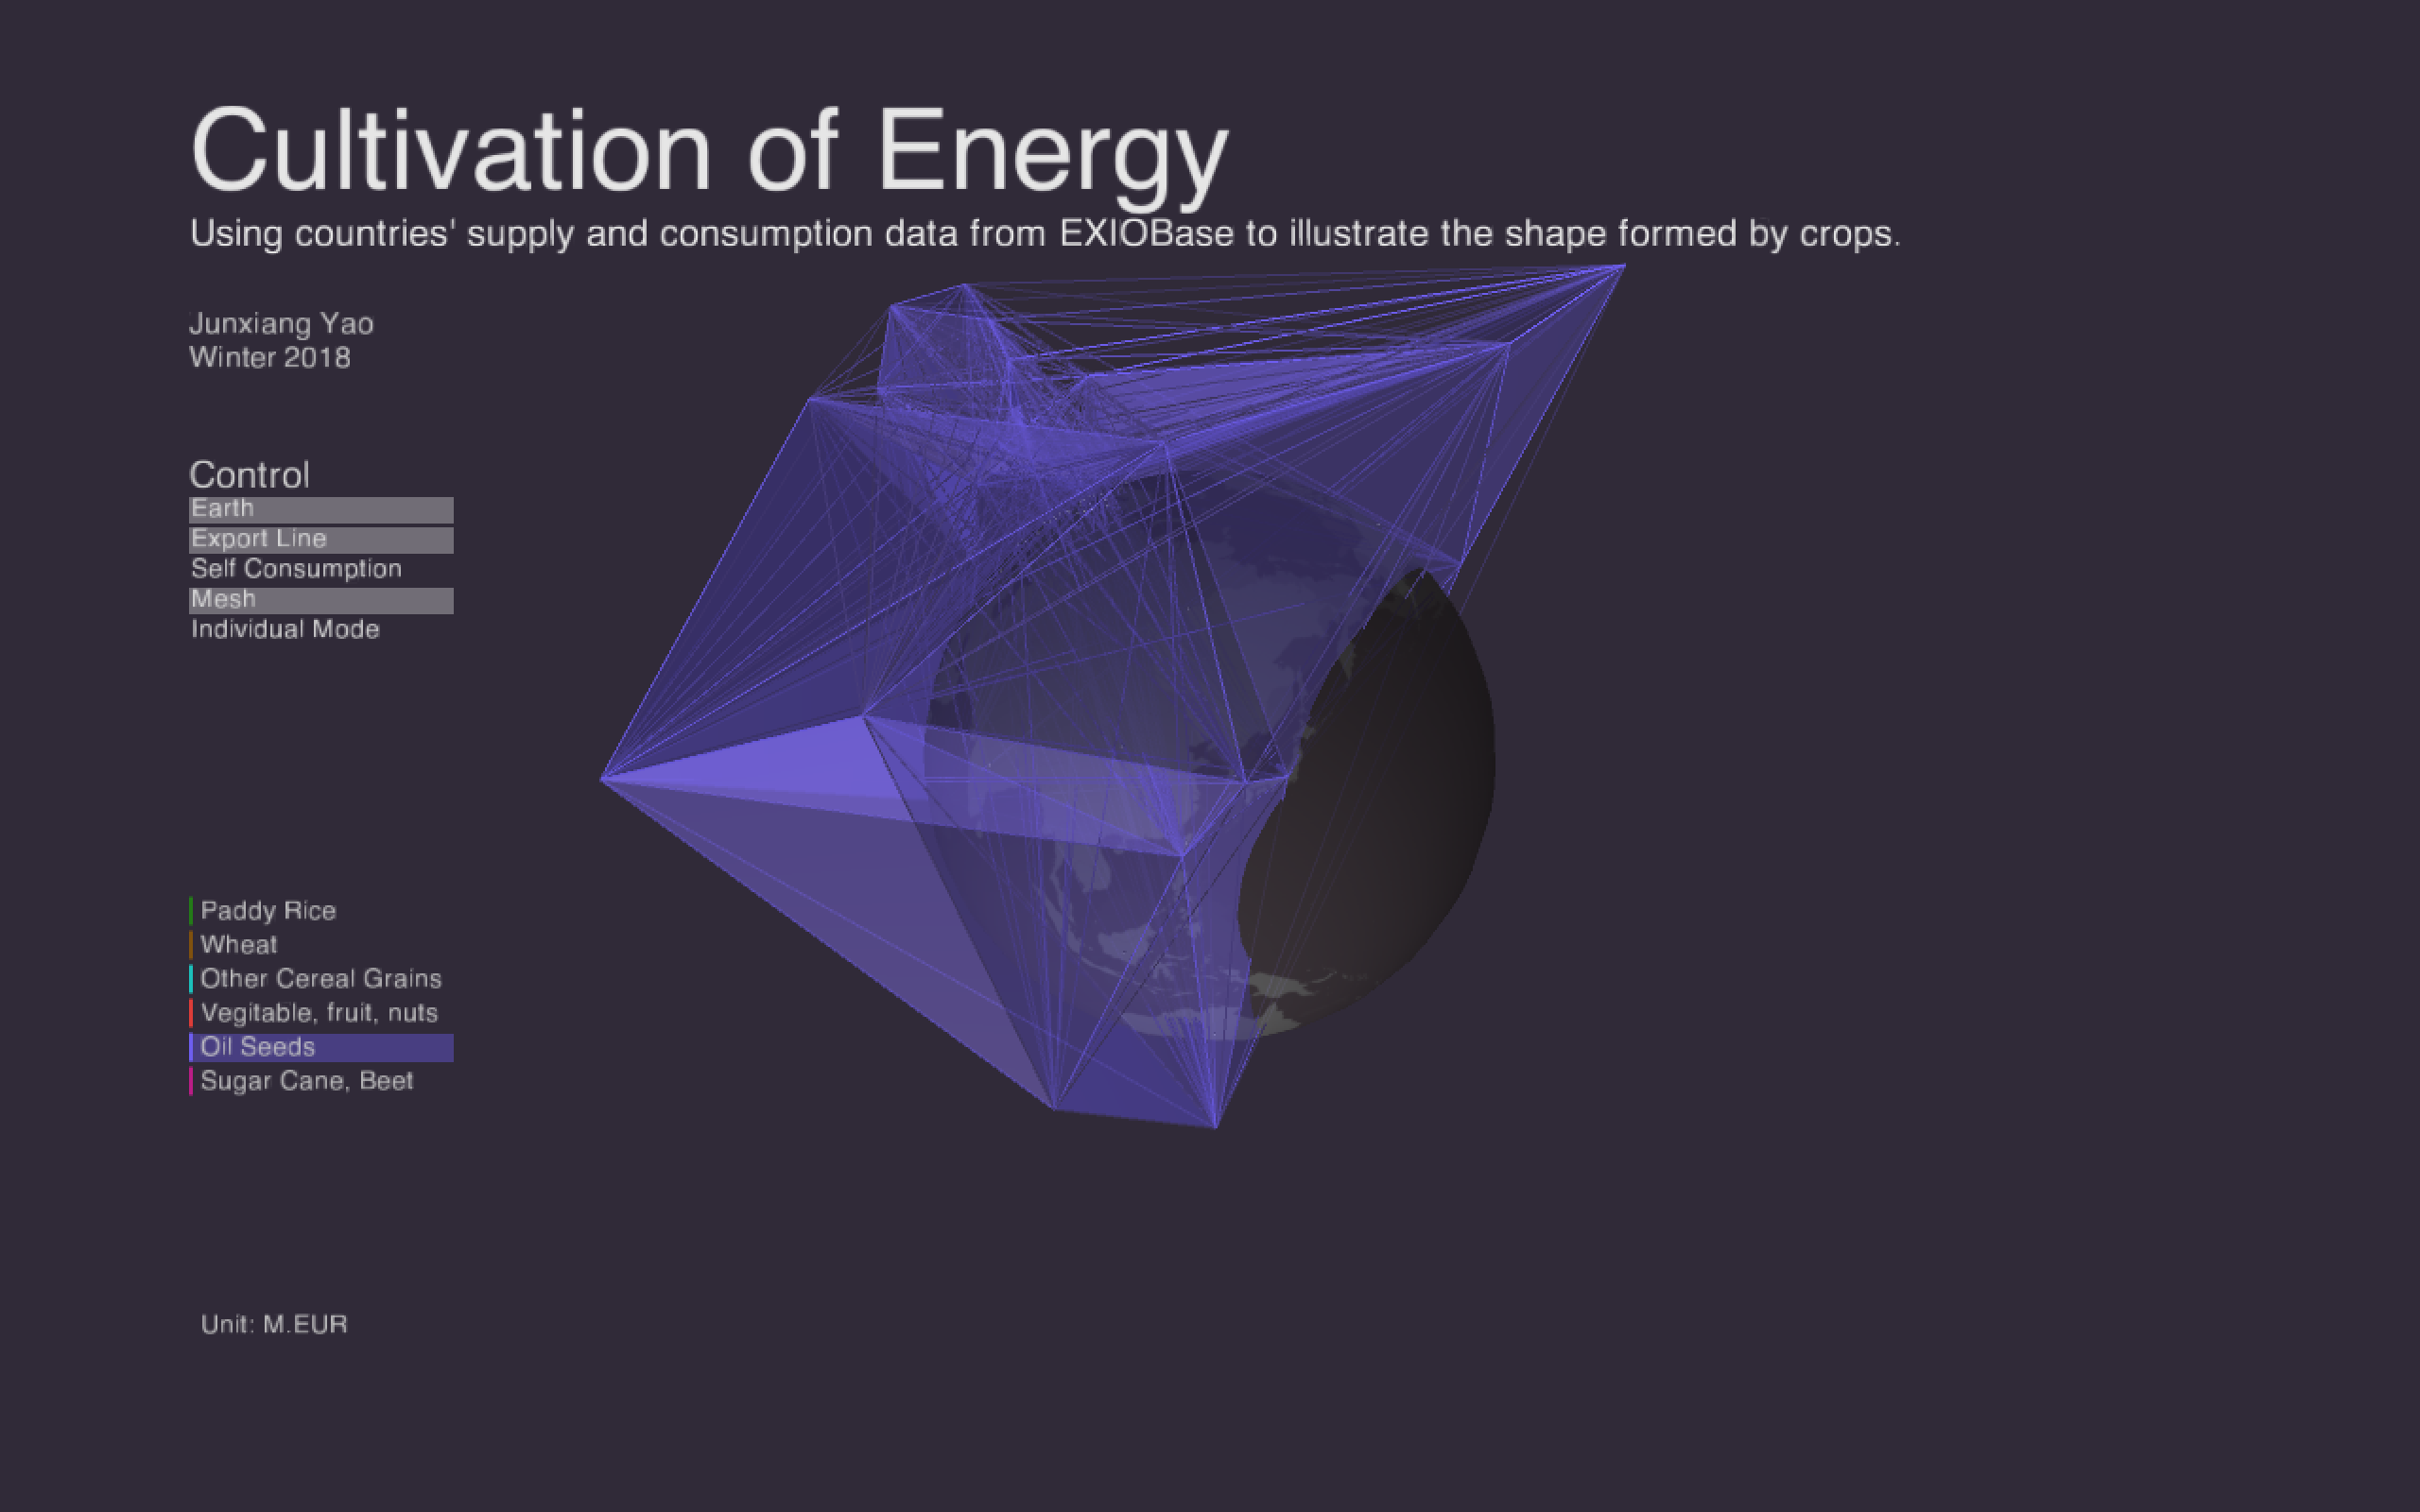
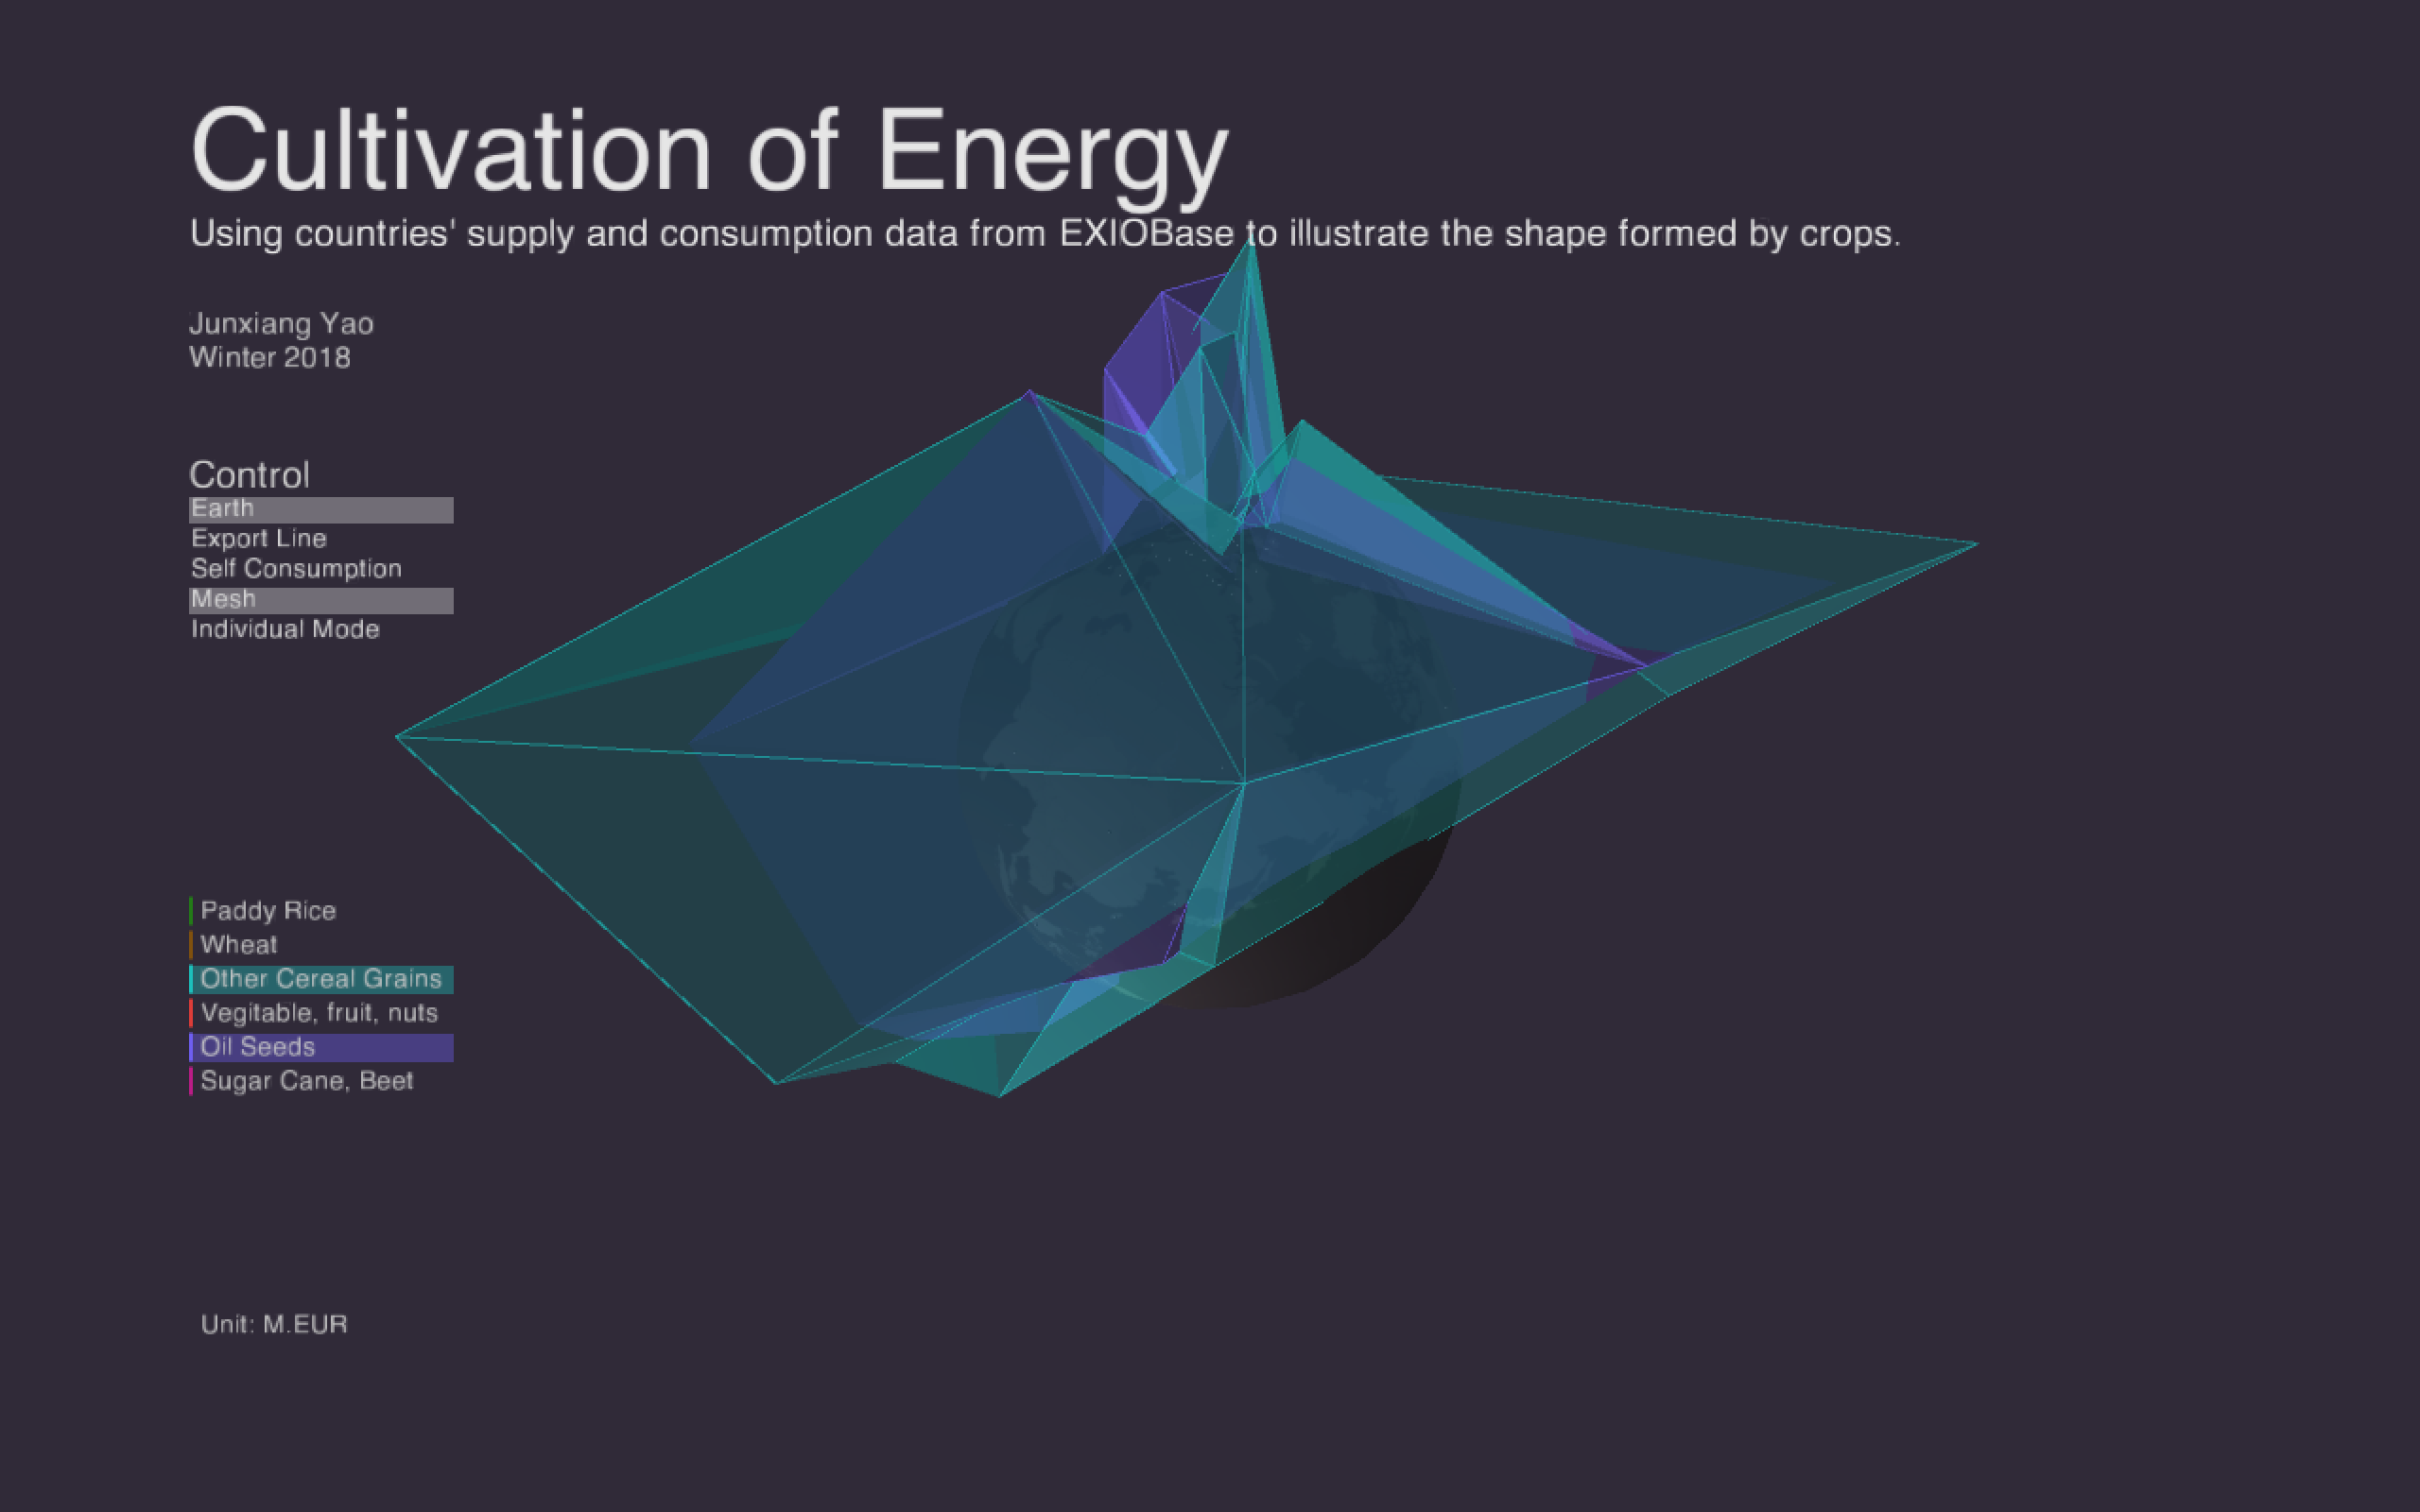
The shapes of other cereals and oil seeds are a bit similar.
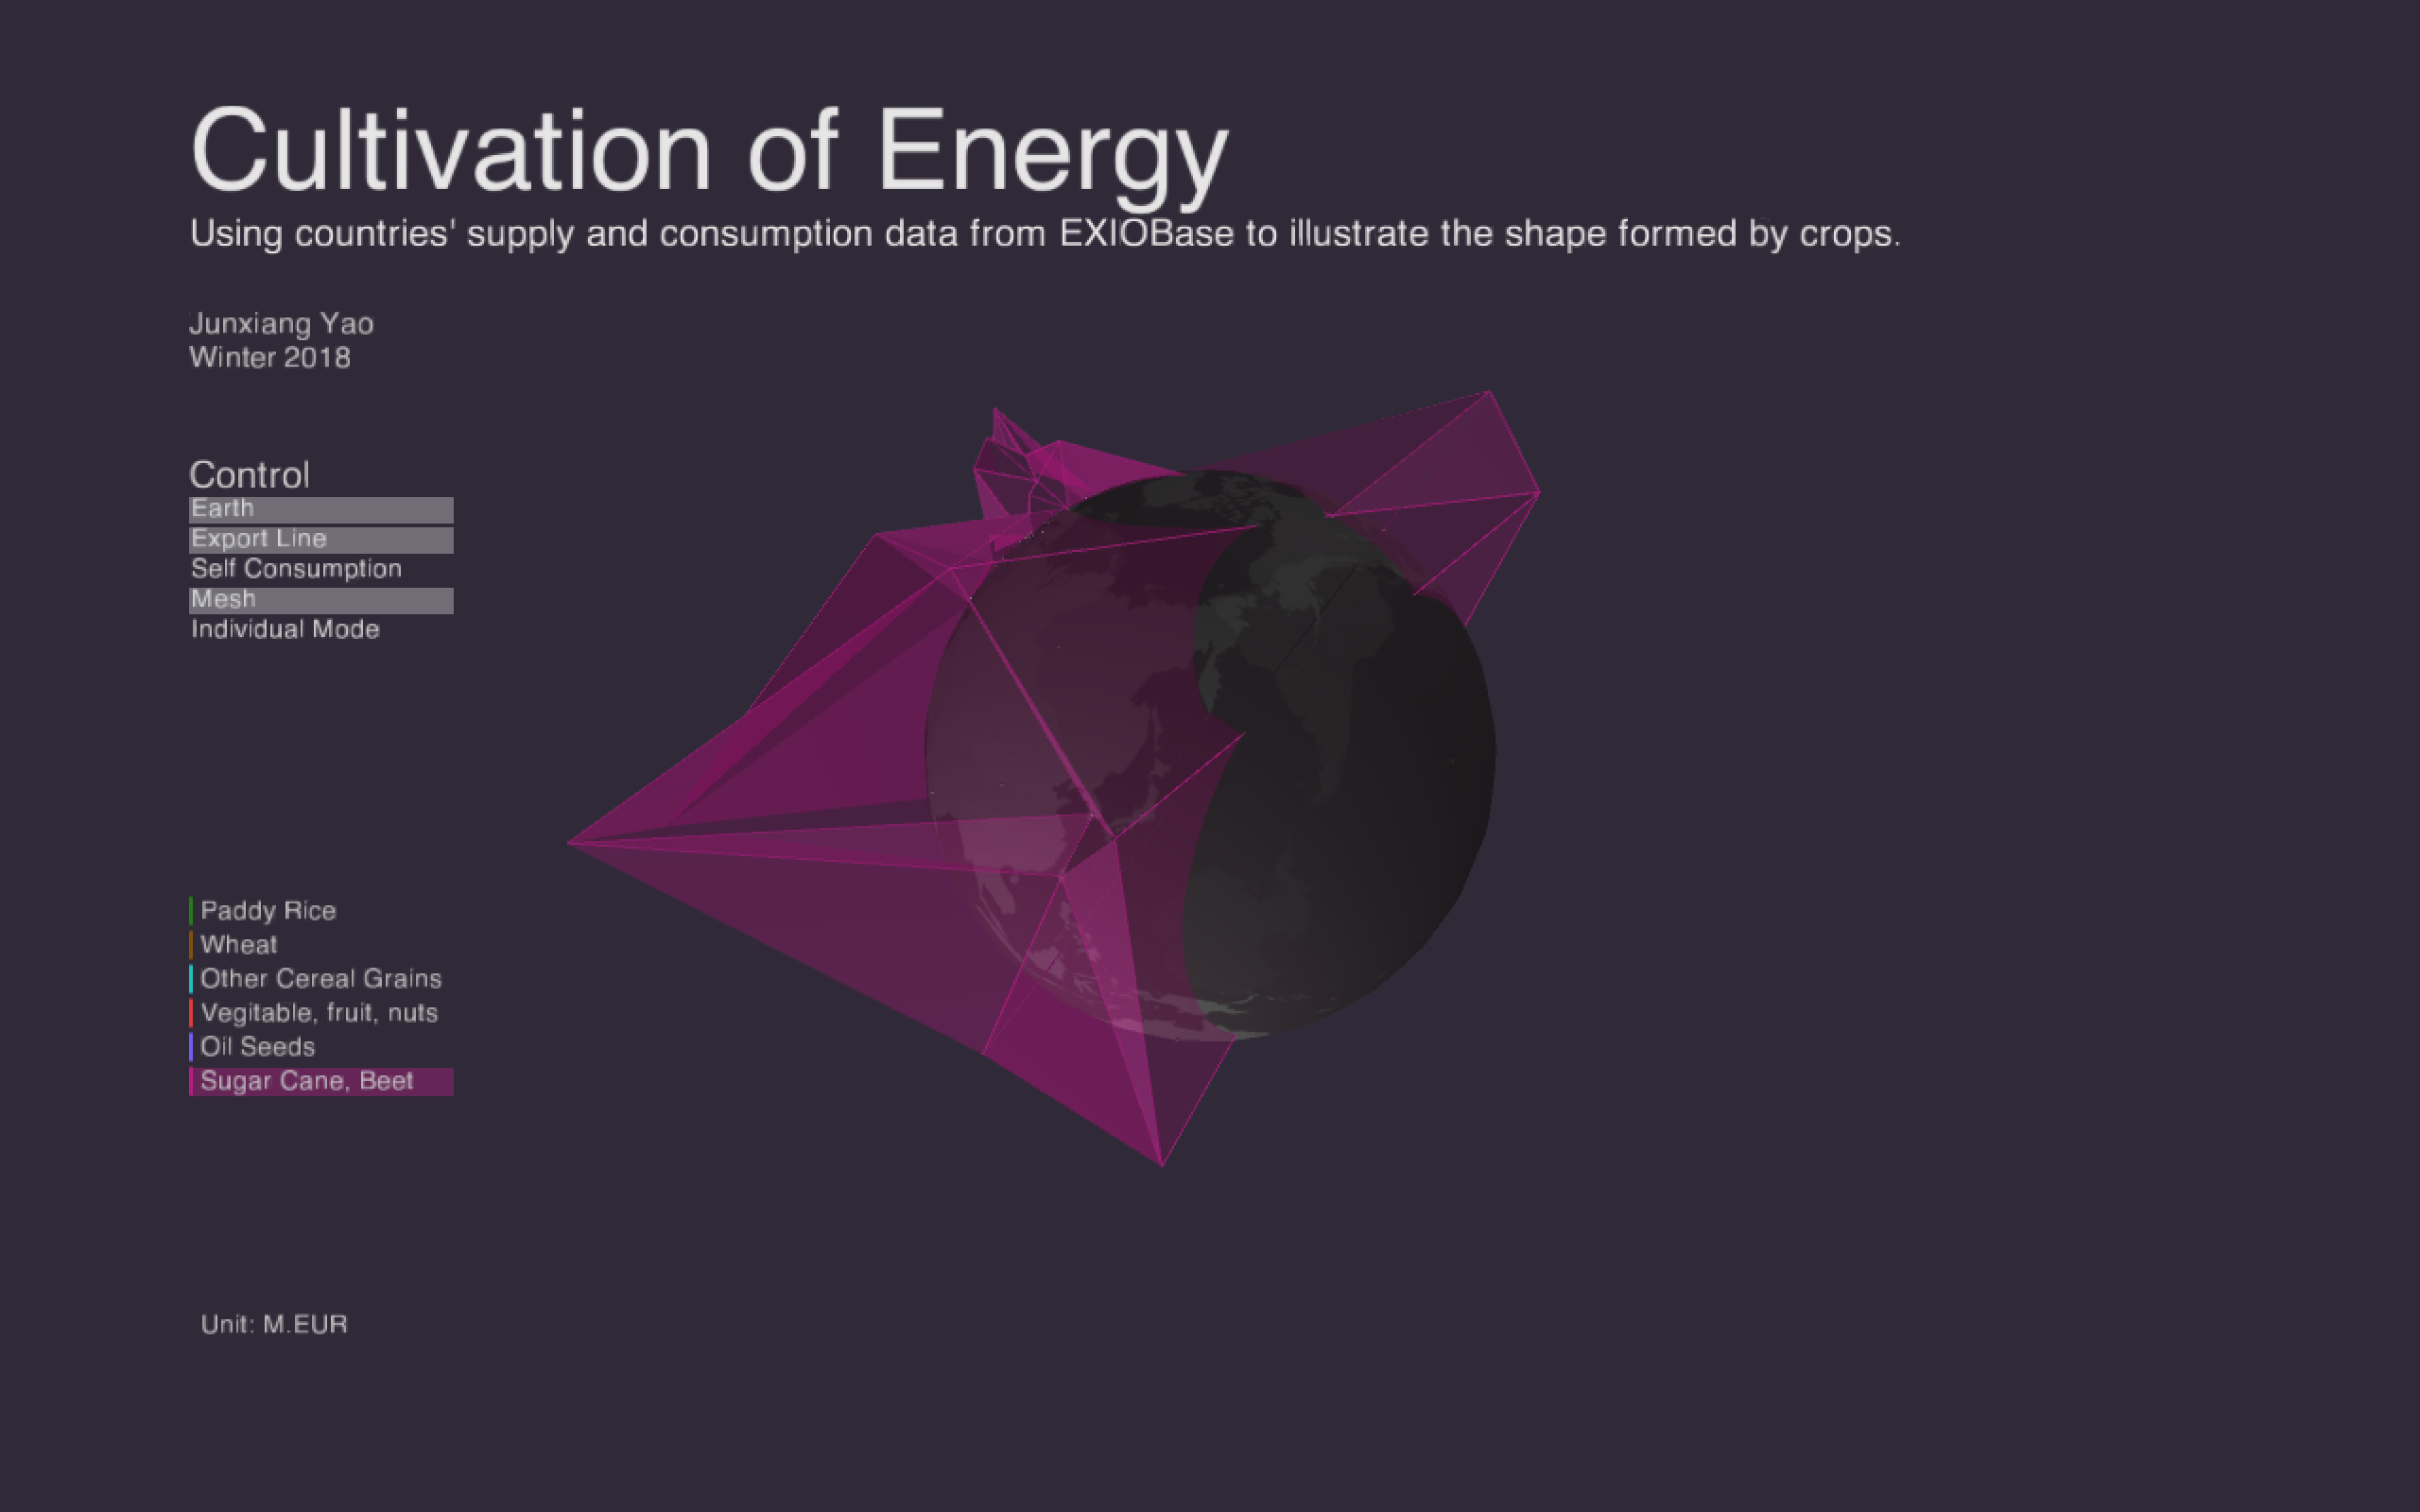
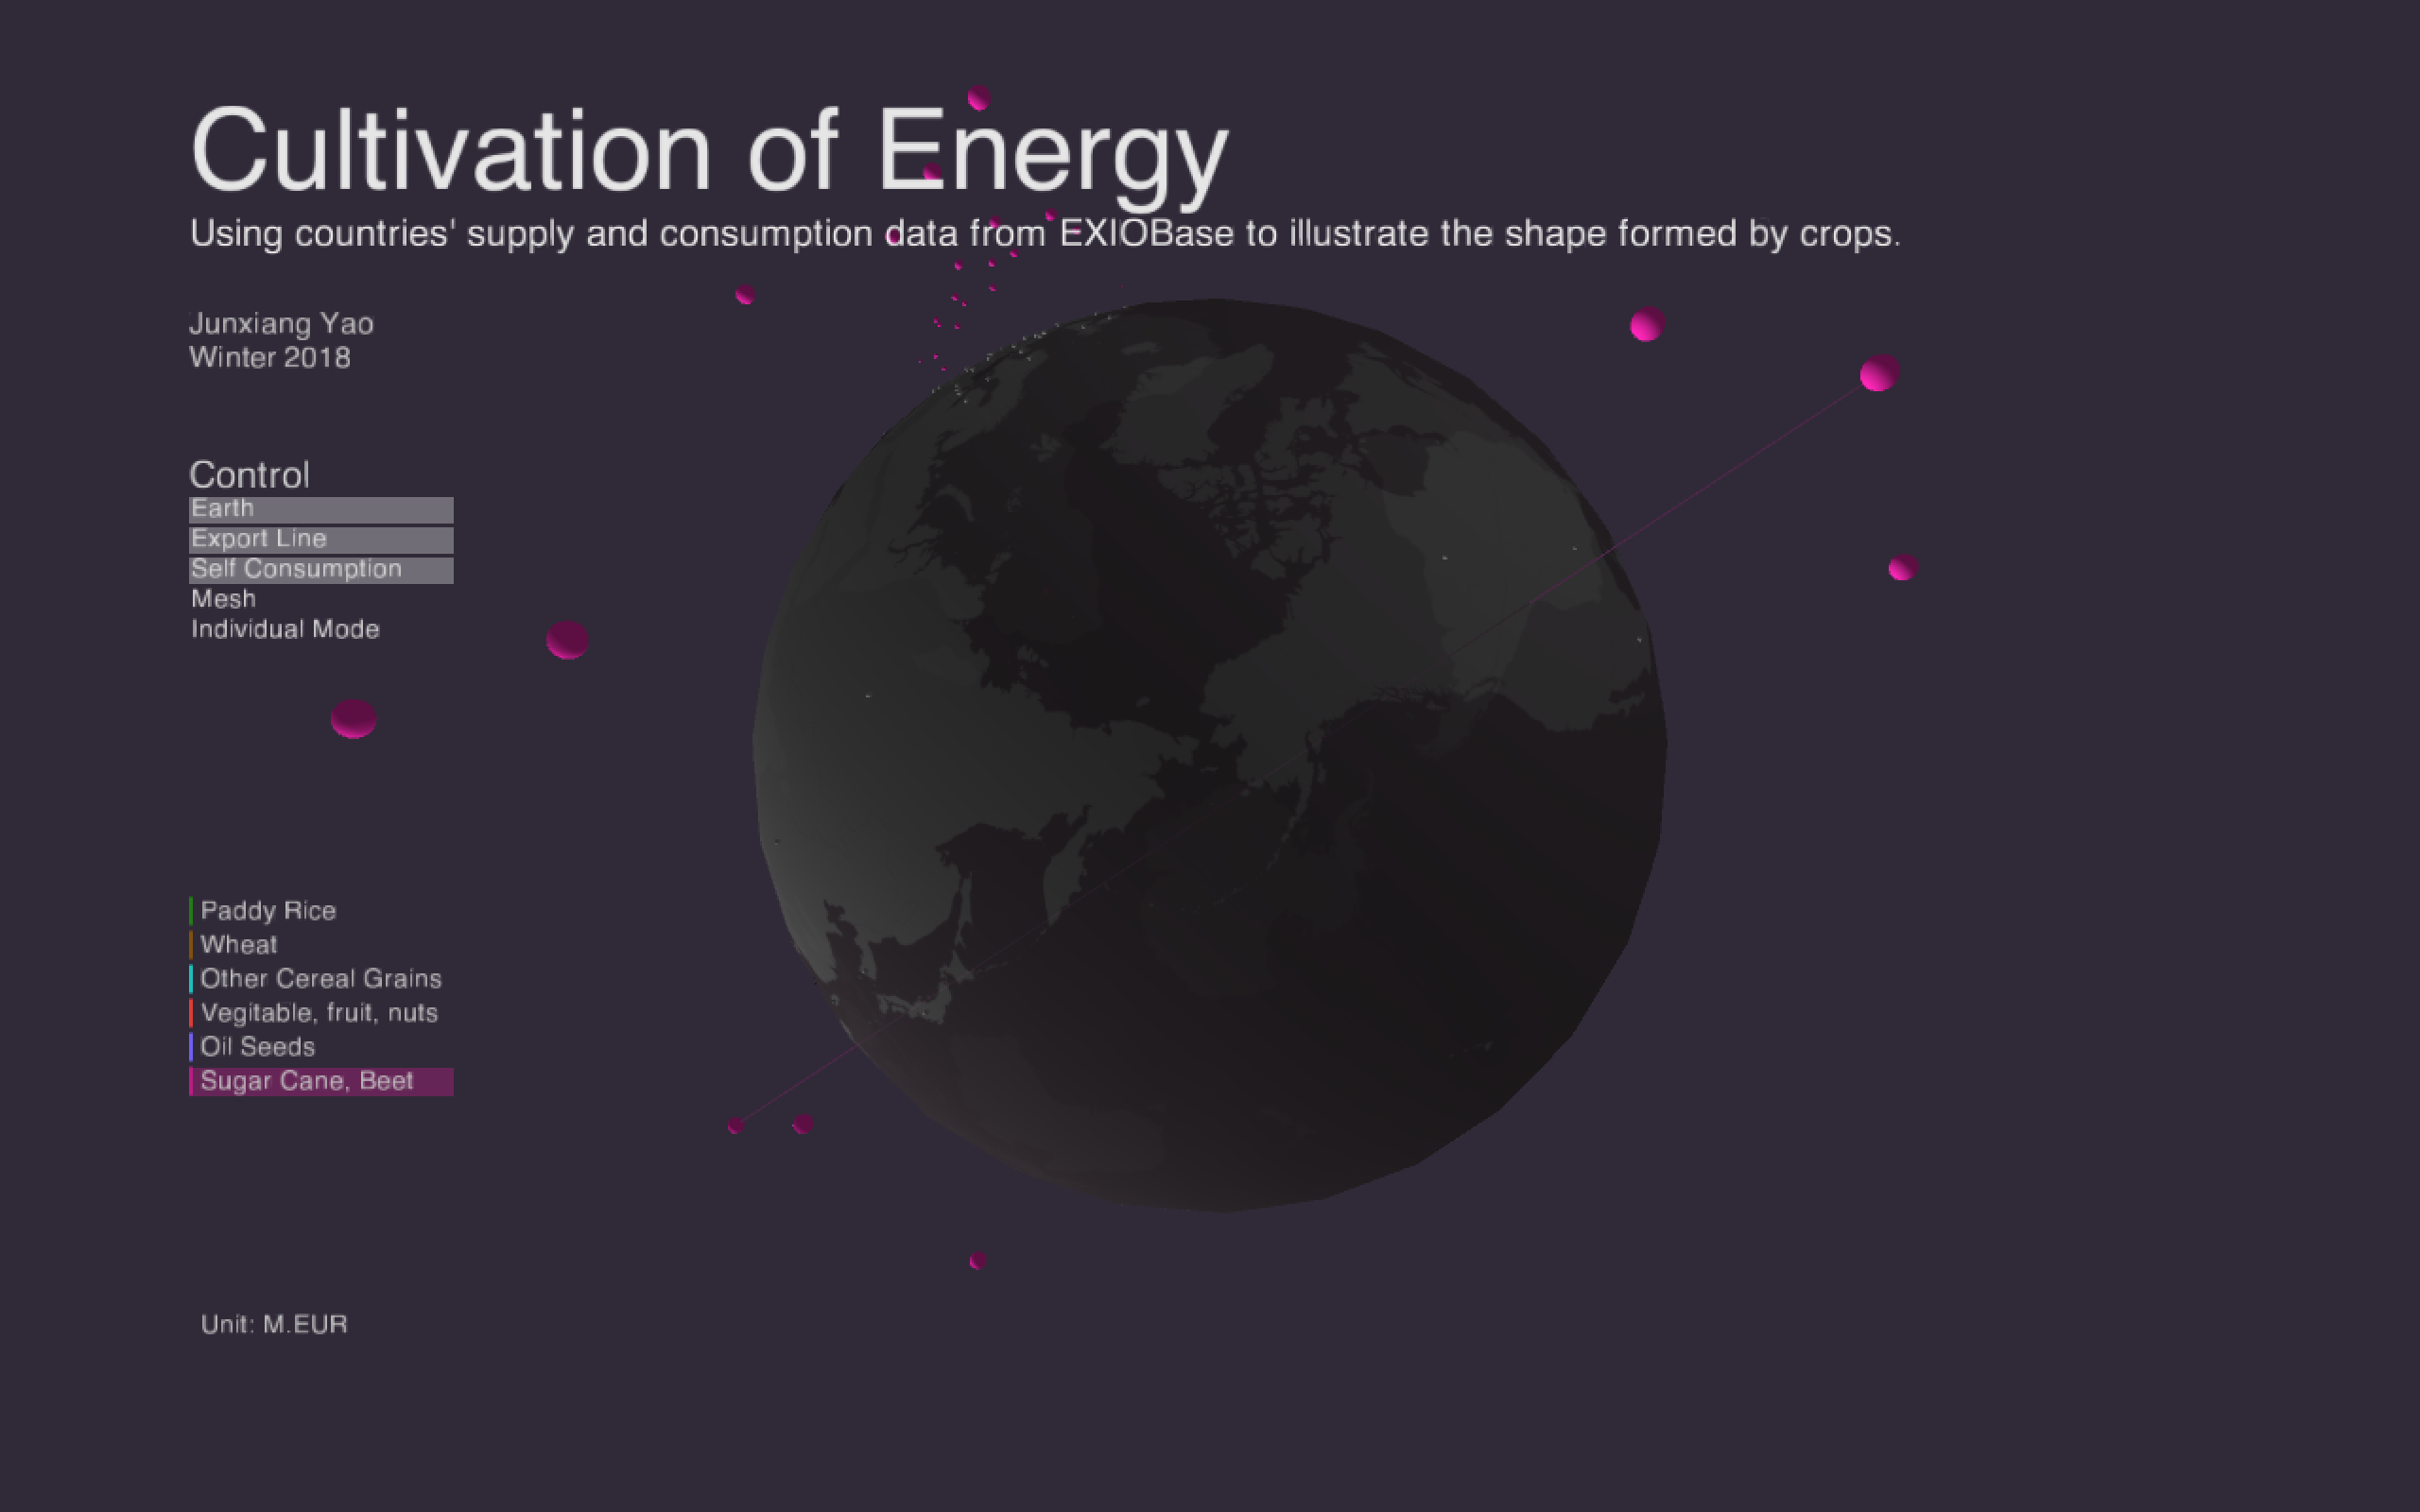
Although the supply data of sugar cane and beets are normal, the odd thing is that there is only one export record among all the contries, which is between Indonesia and US.
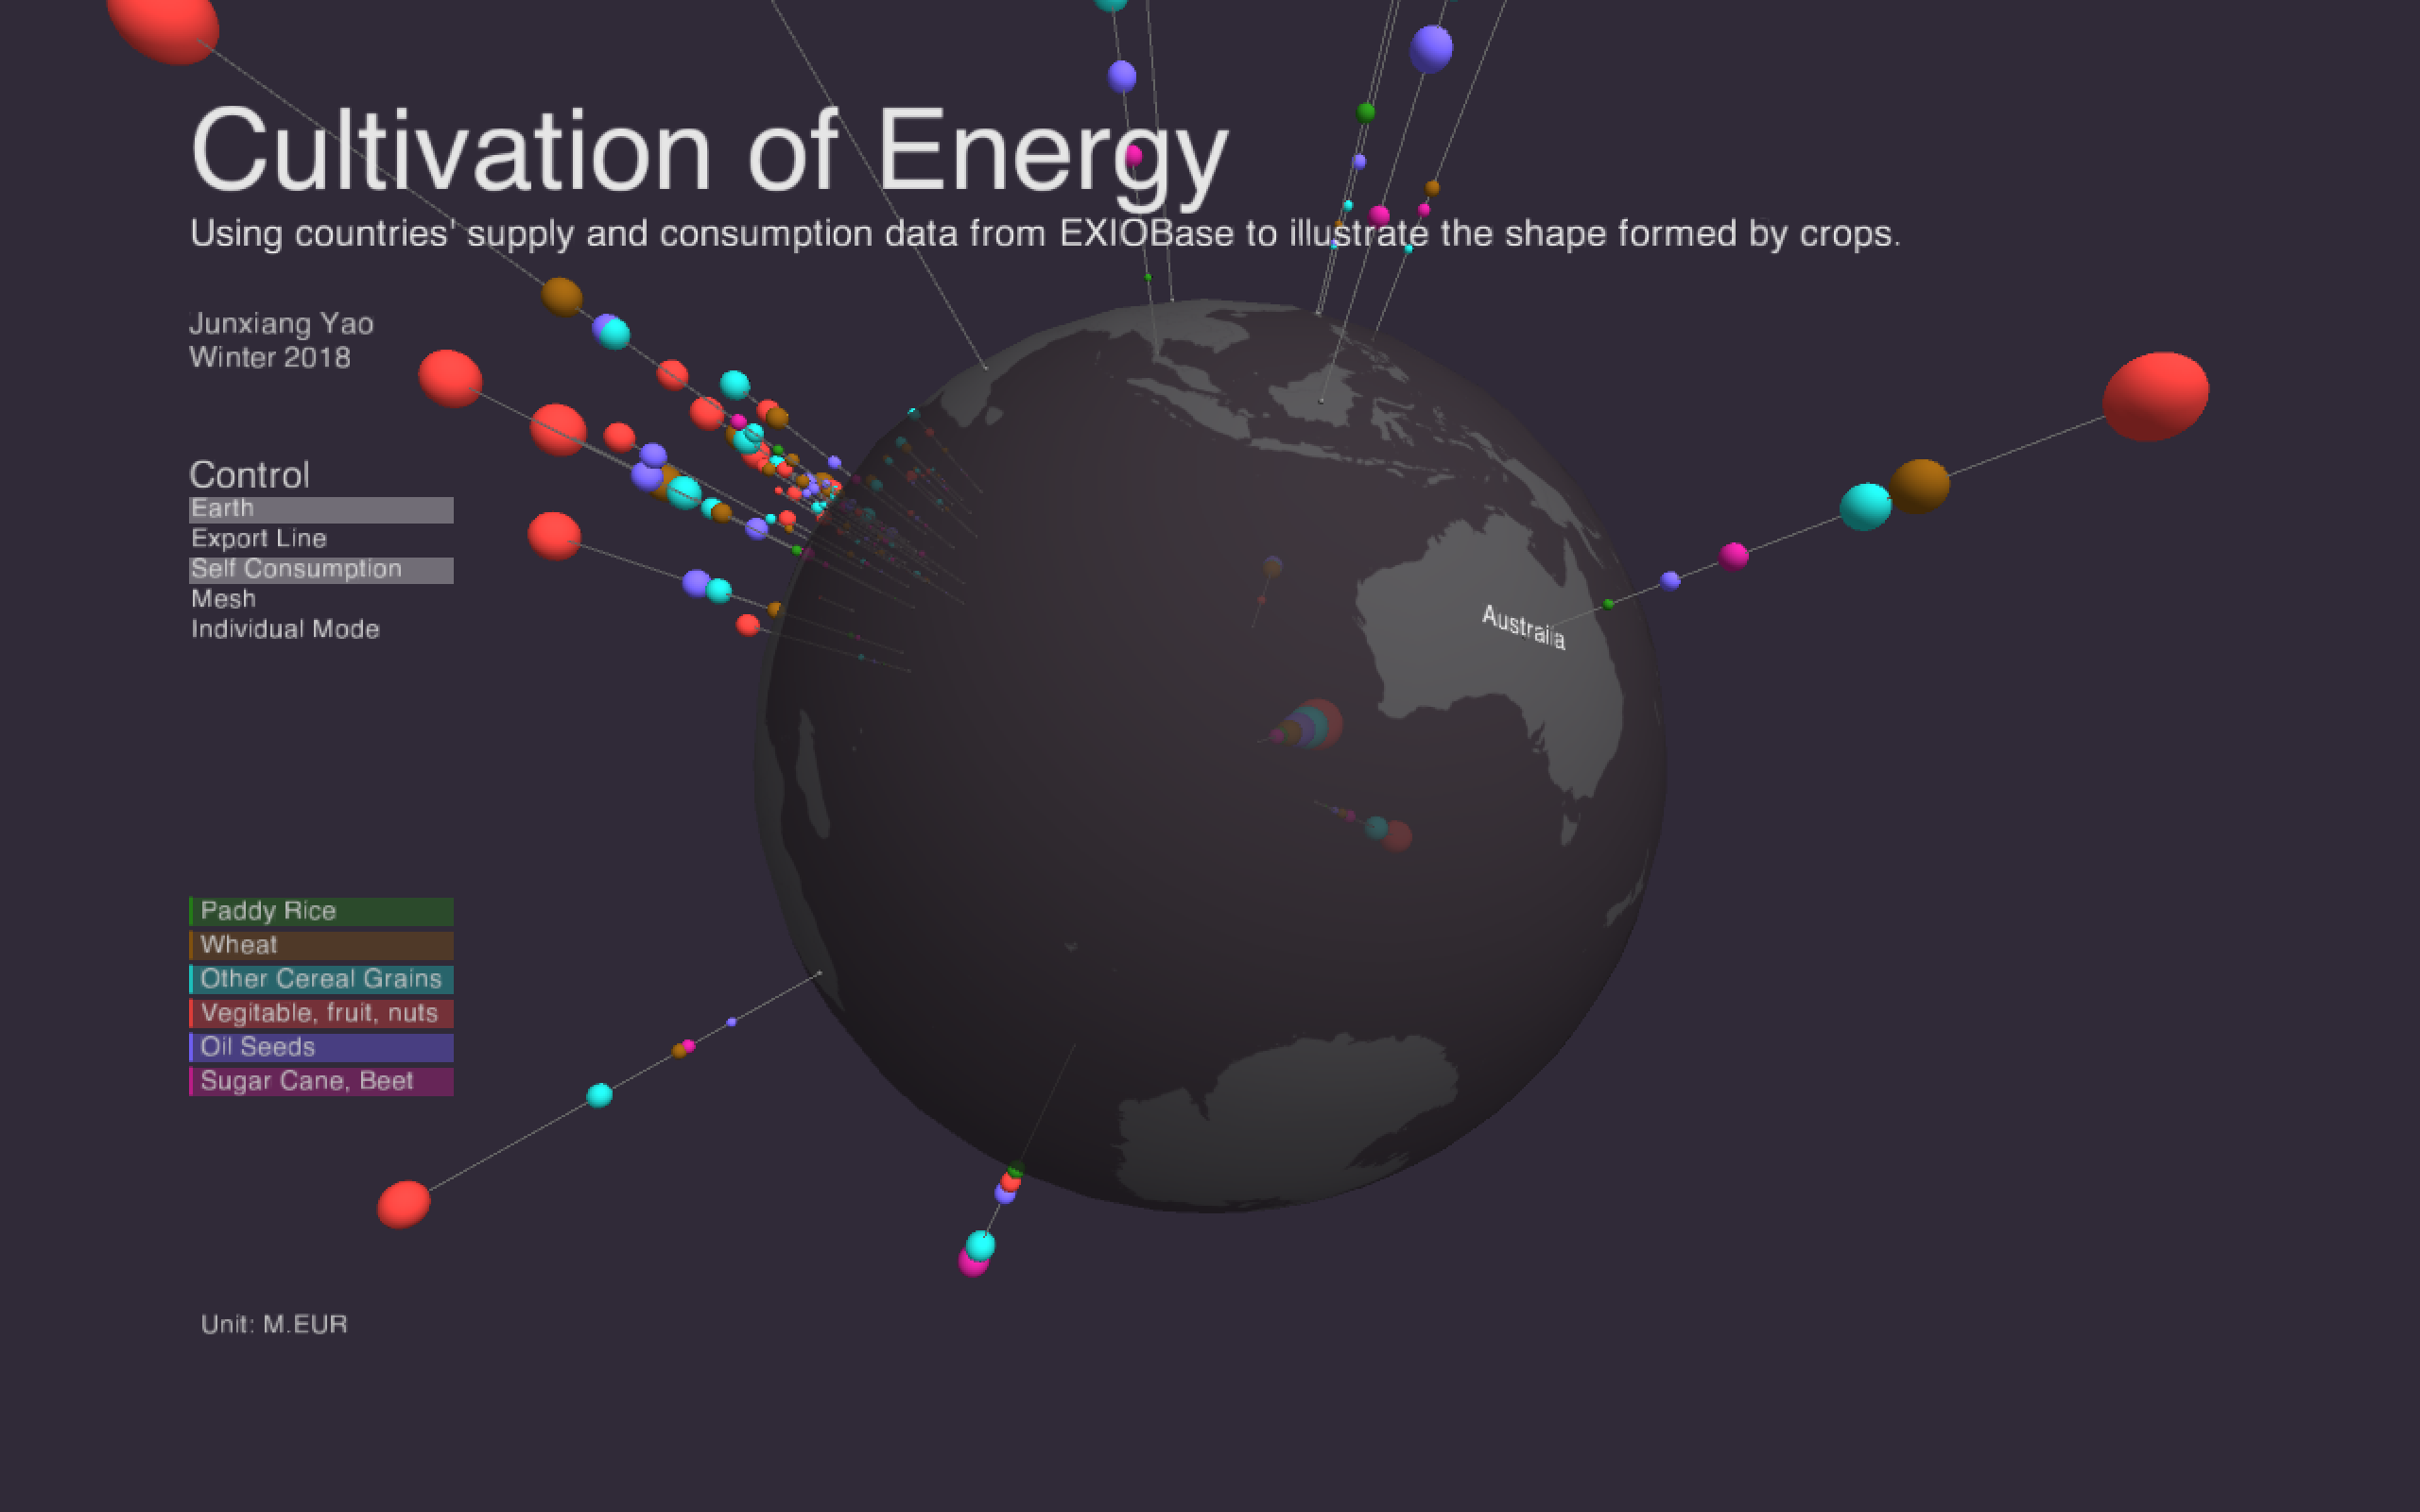
The detail of crop's self consumption data of Austrilia.
Code