Particle visualization of movie popularity and more
MAT 259, 2018
Qiaodong
Concept
I’d like to visualize the popularity of movies in the database using particles. To add some more interesting data, I decided to use 16 different movies, grouped into 4 different genres. The four different genres are: Drama, Sci-Fi, History and fantasies. For each different genre, I find top 4 popular movies. To do this, first I ran a sql query to find the movies with top number of checkout from year 2012-2017. The query is:
Query
                SELECT title, itemType, count(title) AS num from spl_2016.inraw
                where year(cout) = 2012 or year(cout) = 2013 or year(cout) = 2014 or year(cout) = 2015 or year(cout)=2016 or year(cout) = 2017
                group by title, itemType
                order by num DESC
                LIMIT 200
Preliminary sketches
The popularity list is shown below
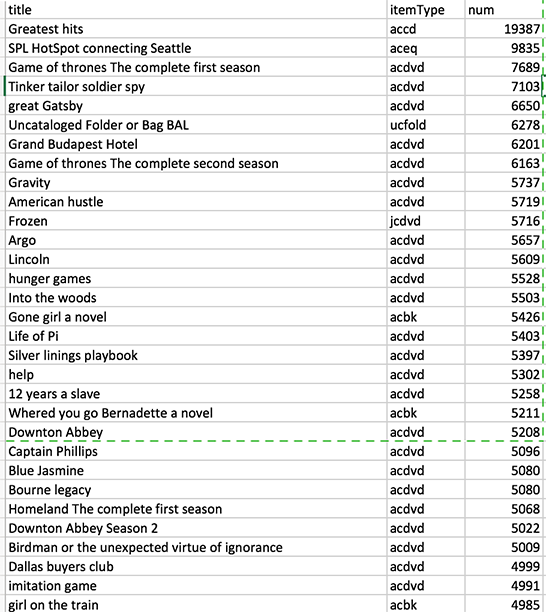
Then, from the top list of the movies, I search each movie and assign them to appropriate generes. The final lis is:
Drama: American hustle, Grand Budapest Hotel, Great Gatsby, Silver Linings Playbook Fantasy: Cinderella, Descendants, Frozen, Into the Woods History: 12 Years a Slave, Imitation Game, Kings Speech, Lincoln Sci-fi: Gravity, Hunger Games, Interstellar, Star Trek into Darkness
Some movie may belong to multiple genres, in this case, I’ll find the closest one. If a movie is too ambiguous to be assigned to an appropriate genre, I’ll just skip that one.
After that, for each of the 16 movies, I use a simple query to grab all the check in and check out records of that movie. The query is the follows:
Then I use the python scripts included in the project to process all the 16 query results. Specifically, this python scripts would first compute the total number of checkout times for each movie, and zip all the data into a single csv file. So each movie will be a column, with total 12*6 = 72 rows. This script can also extract the borrow time for each checkout record, and output a txt file for this. I use this python scripts to preprocess the data, and then use processing to read the csv file and the txt file contains the borrow time for each checkouts.
Then, from the top list of the movies, I search each movie and assign them to appropriate generes. The final lis is:
Drama: American hustle, Grand Budapest Hotel, Great Gatsby, Silver Linings Playbook Fantasy: Cinderella, Descendants, Frozen, Into the Woods History: 12 Years a Slave, Imitation Game, Kings Speech, Lincoln Sci-fi: Gravity, Hunger Games, Interstellar, Star Trek into Darkness
Some movie may belong to multiple genres, in this case, I’ll find the closest one. If a movie is too ambiguous to be assigned to an appropriate genre, I’ll just skip that one.
After that, for each of the 16 movies, I use a simple query to grab all the check in and check out records of that movie. The query is the follows:
                        SELECT title, cout, cin from spl_2016.inraw
                        Where title = 'Great Gatsby' AND year(cout) >= 2012
Then I use the python scripts included in the project to process all the 16 query results. Specifically, this python scripts would first compute the total number of checkout times for each movie, and zip all the data into a single csv file. So each movie will be a column, with total 12*6 = 72 rows. This script can also extract the borrow time for each checkout record, and output a txt file for this. I use this python scripts to preprocess the data, and then use processing to read the csv file and the txt file contains the borrow time for each checkouts.
Process
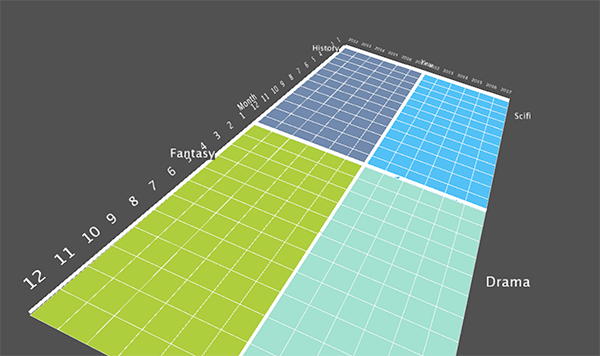
I’d like to use particles as the primitive for my visualization. I’d like to map one particle to one specific checkout record. To do this, first as the data is grouped into month, I draw a ground plane, where each cell represents the checking record for one specific movie for that month. So there are 12*6 cells for each record. Also, I’d like to display 4 movies on the screen at the same time. So I have four squares, each with 12*6 = 72 cells. This image shows the ground plane of my visualization:
To map the particles to the data records for one specific movie for one specific month, I use a particle system to emit the particles from that cell, where the number of particles are proportional to the number of records of that movie in that month. The particles move upwards, driven by gravity forces which points upwards. To map the particle to a specific record, I map the life of the particle to one random selected checkout time from that month of that movie. Here is the visualization:
To map the particles to the data records for one specific movie for one specific month, I use a particle system to emit the particles from that cell, where the number of particles are proportional to the number of records of that movie in that month. The particles move upwards, driven by gravity forces which points upwards. To map the particle to a specific record, I map the life of the particle to one random selected checkout time from that month of that movie. Here is the visualization:
Final result
After this, I thought it may be interesting to display the grouped 4 genres on the screen, and do a translation when the user choose to visualize a specific genre. To do this, first I aggregate the data from individual movies into the genre, and display 4 genres at the same time. Here are some final results.
I also designed a translation, when the user what to focus on a specific genre. To do this, the user can hit a key, and then the translation will smooth translate the visualization into the four movies that the specific genre contains.
I also designed a translation, when the user what to focus on a specific genre. To do this, the user can hit a key, and then the translation will smooth translate the visualization into the four movies that the specific genre contains.
Code