Monthly frequencies of checkout between different categories book
MAT 259, 2018
Ming-Yu Lin
Concept
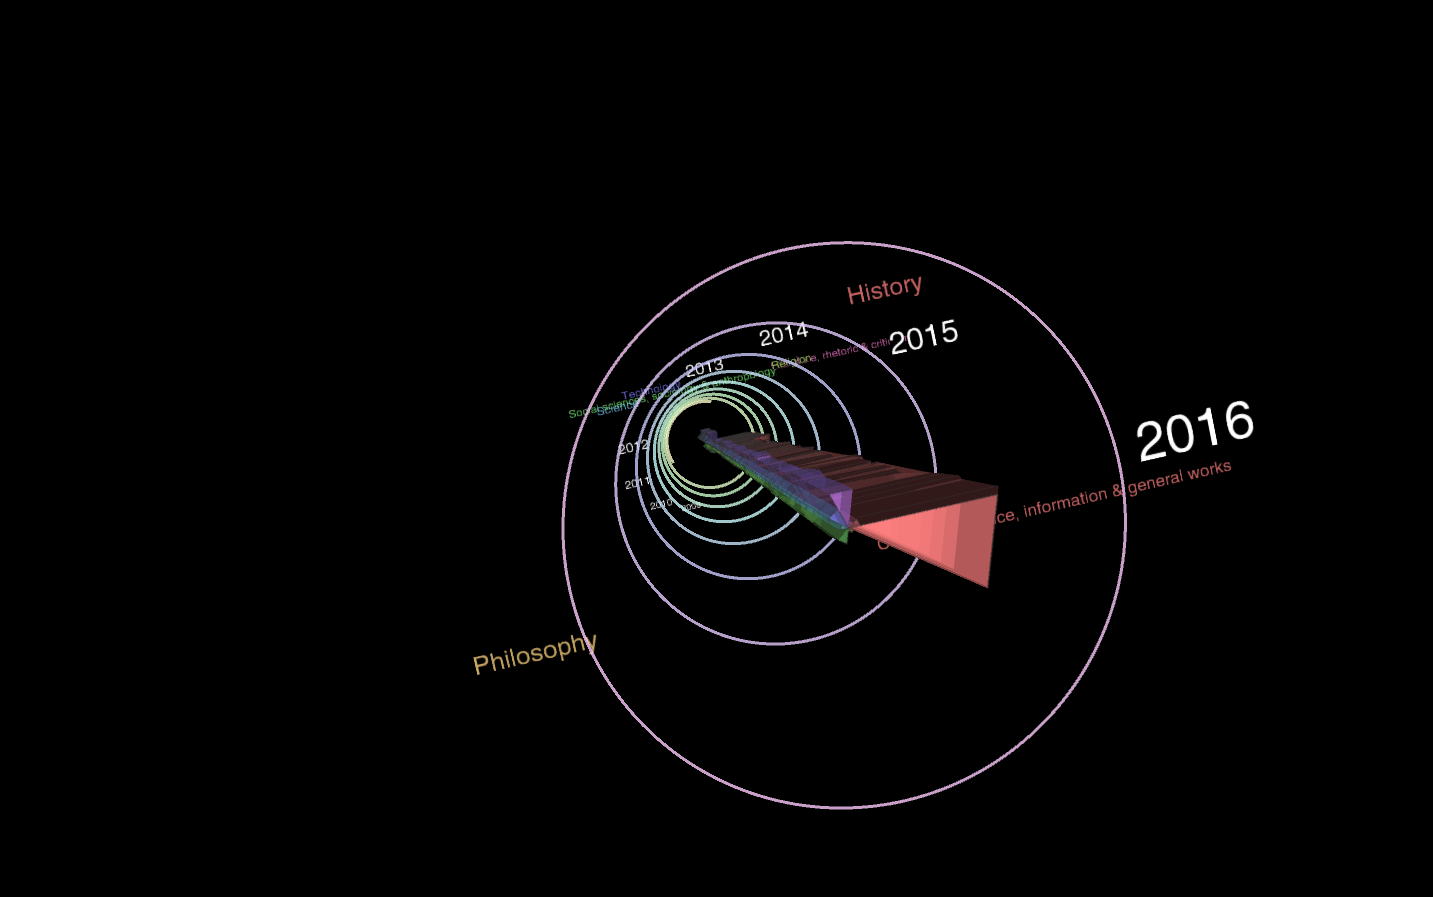
This 3D model shows the monthly amount of checkout from 2007 to 2016.
For the first attempt for this assignment, I queried daily data to compute.
However, there would be up to 36500 rows data and the fps became really low due to the large calculation in drawing.
Also, the length of the model will be too long to be fully presented.
As a result, I changed back to query monthly data.
The basic concept was inspired by the TreeMap model from the example.
I changed the shape for each layer which showed the amount of the checkout.
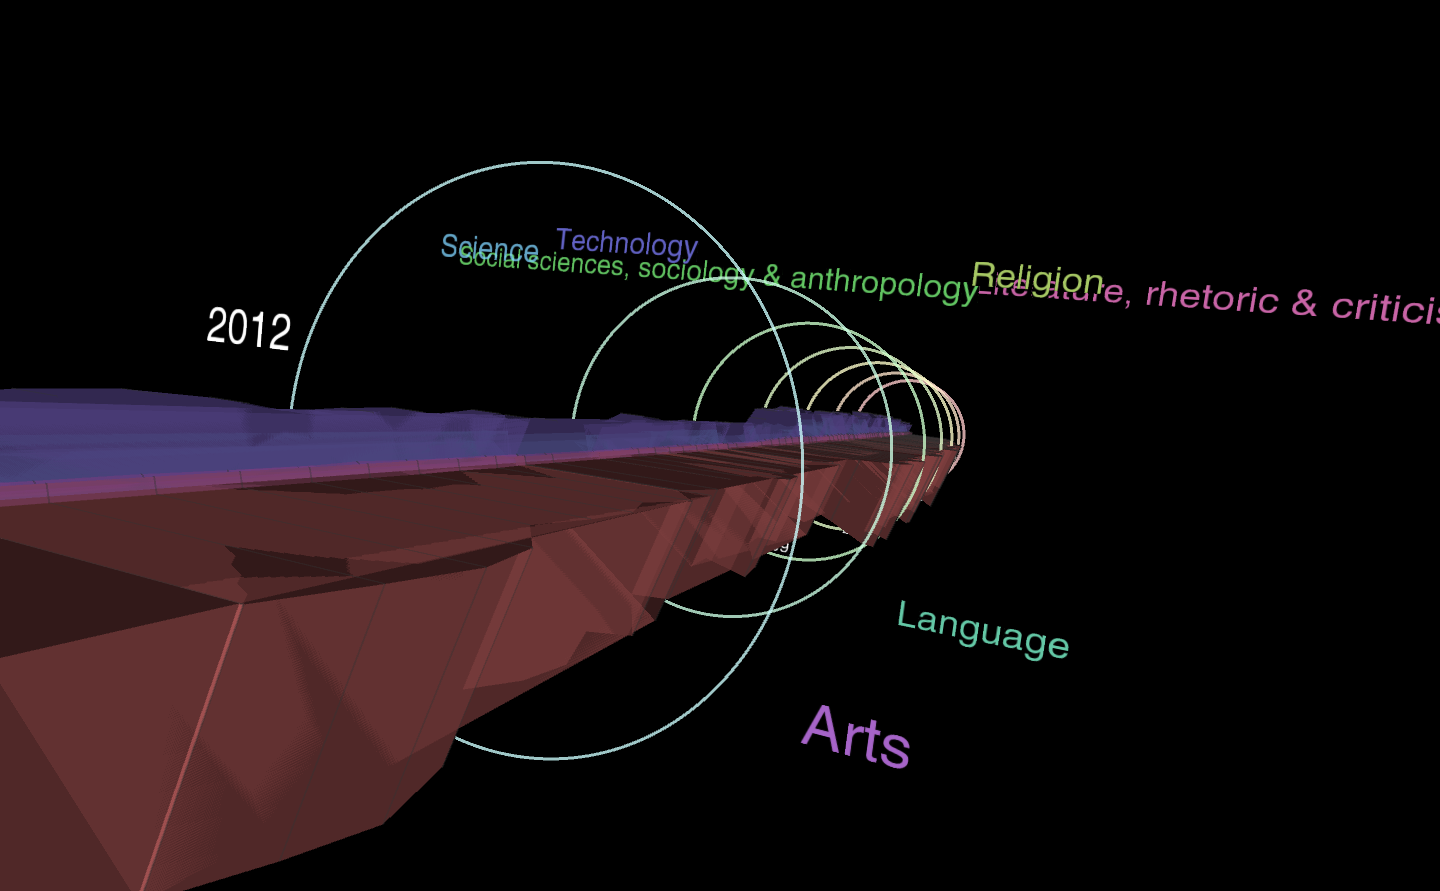
I just labeled out the year with several circular ring to show the time line.
I used colored text to show the relationship between block color and categories' names.
The position of the text is randomized.
Query
In inner query, I generalized small categories to ten big categories and classified book and non-book for itemType. In outer query, I group the data to get the total counts for same deweyNumber in same month. The query time was around 100 seconds. The query might be optimized to save more time.
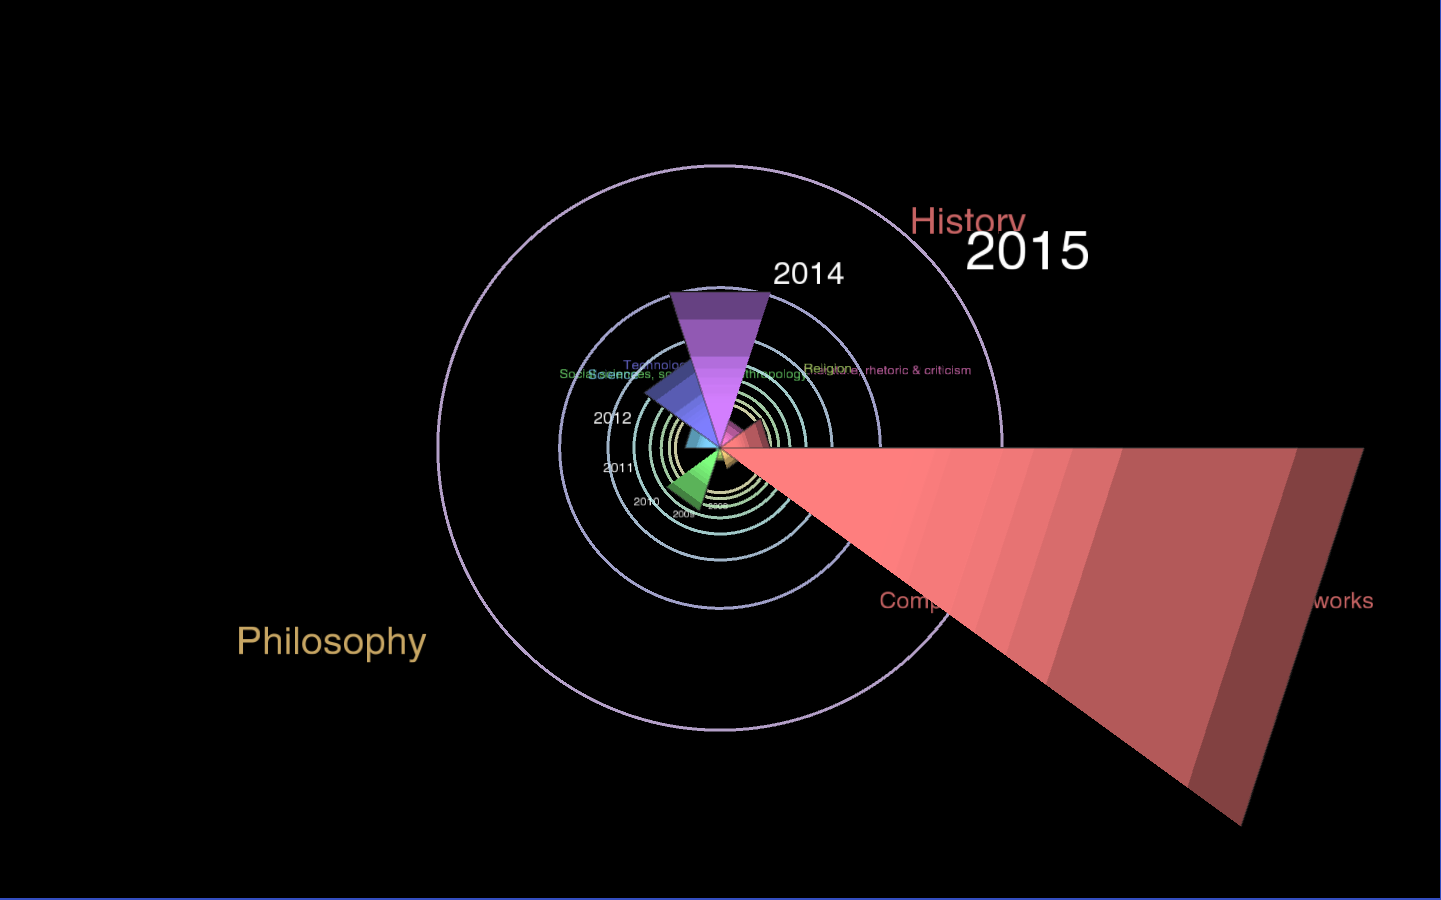
Final result visualization
There are still a lot of parts can be improved.
Since the amount of checkout for Computer Science(first category) was really high,
it was hard to scale the number for each category.
The trade off is the bigger difference for the different categories would lead to smaller difference for the same category.
Also, there is no interactive function in current code.
Code