Star Wars Nebula
MAT 259, 2018
Junxiang Yao
Concept
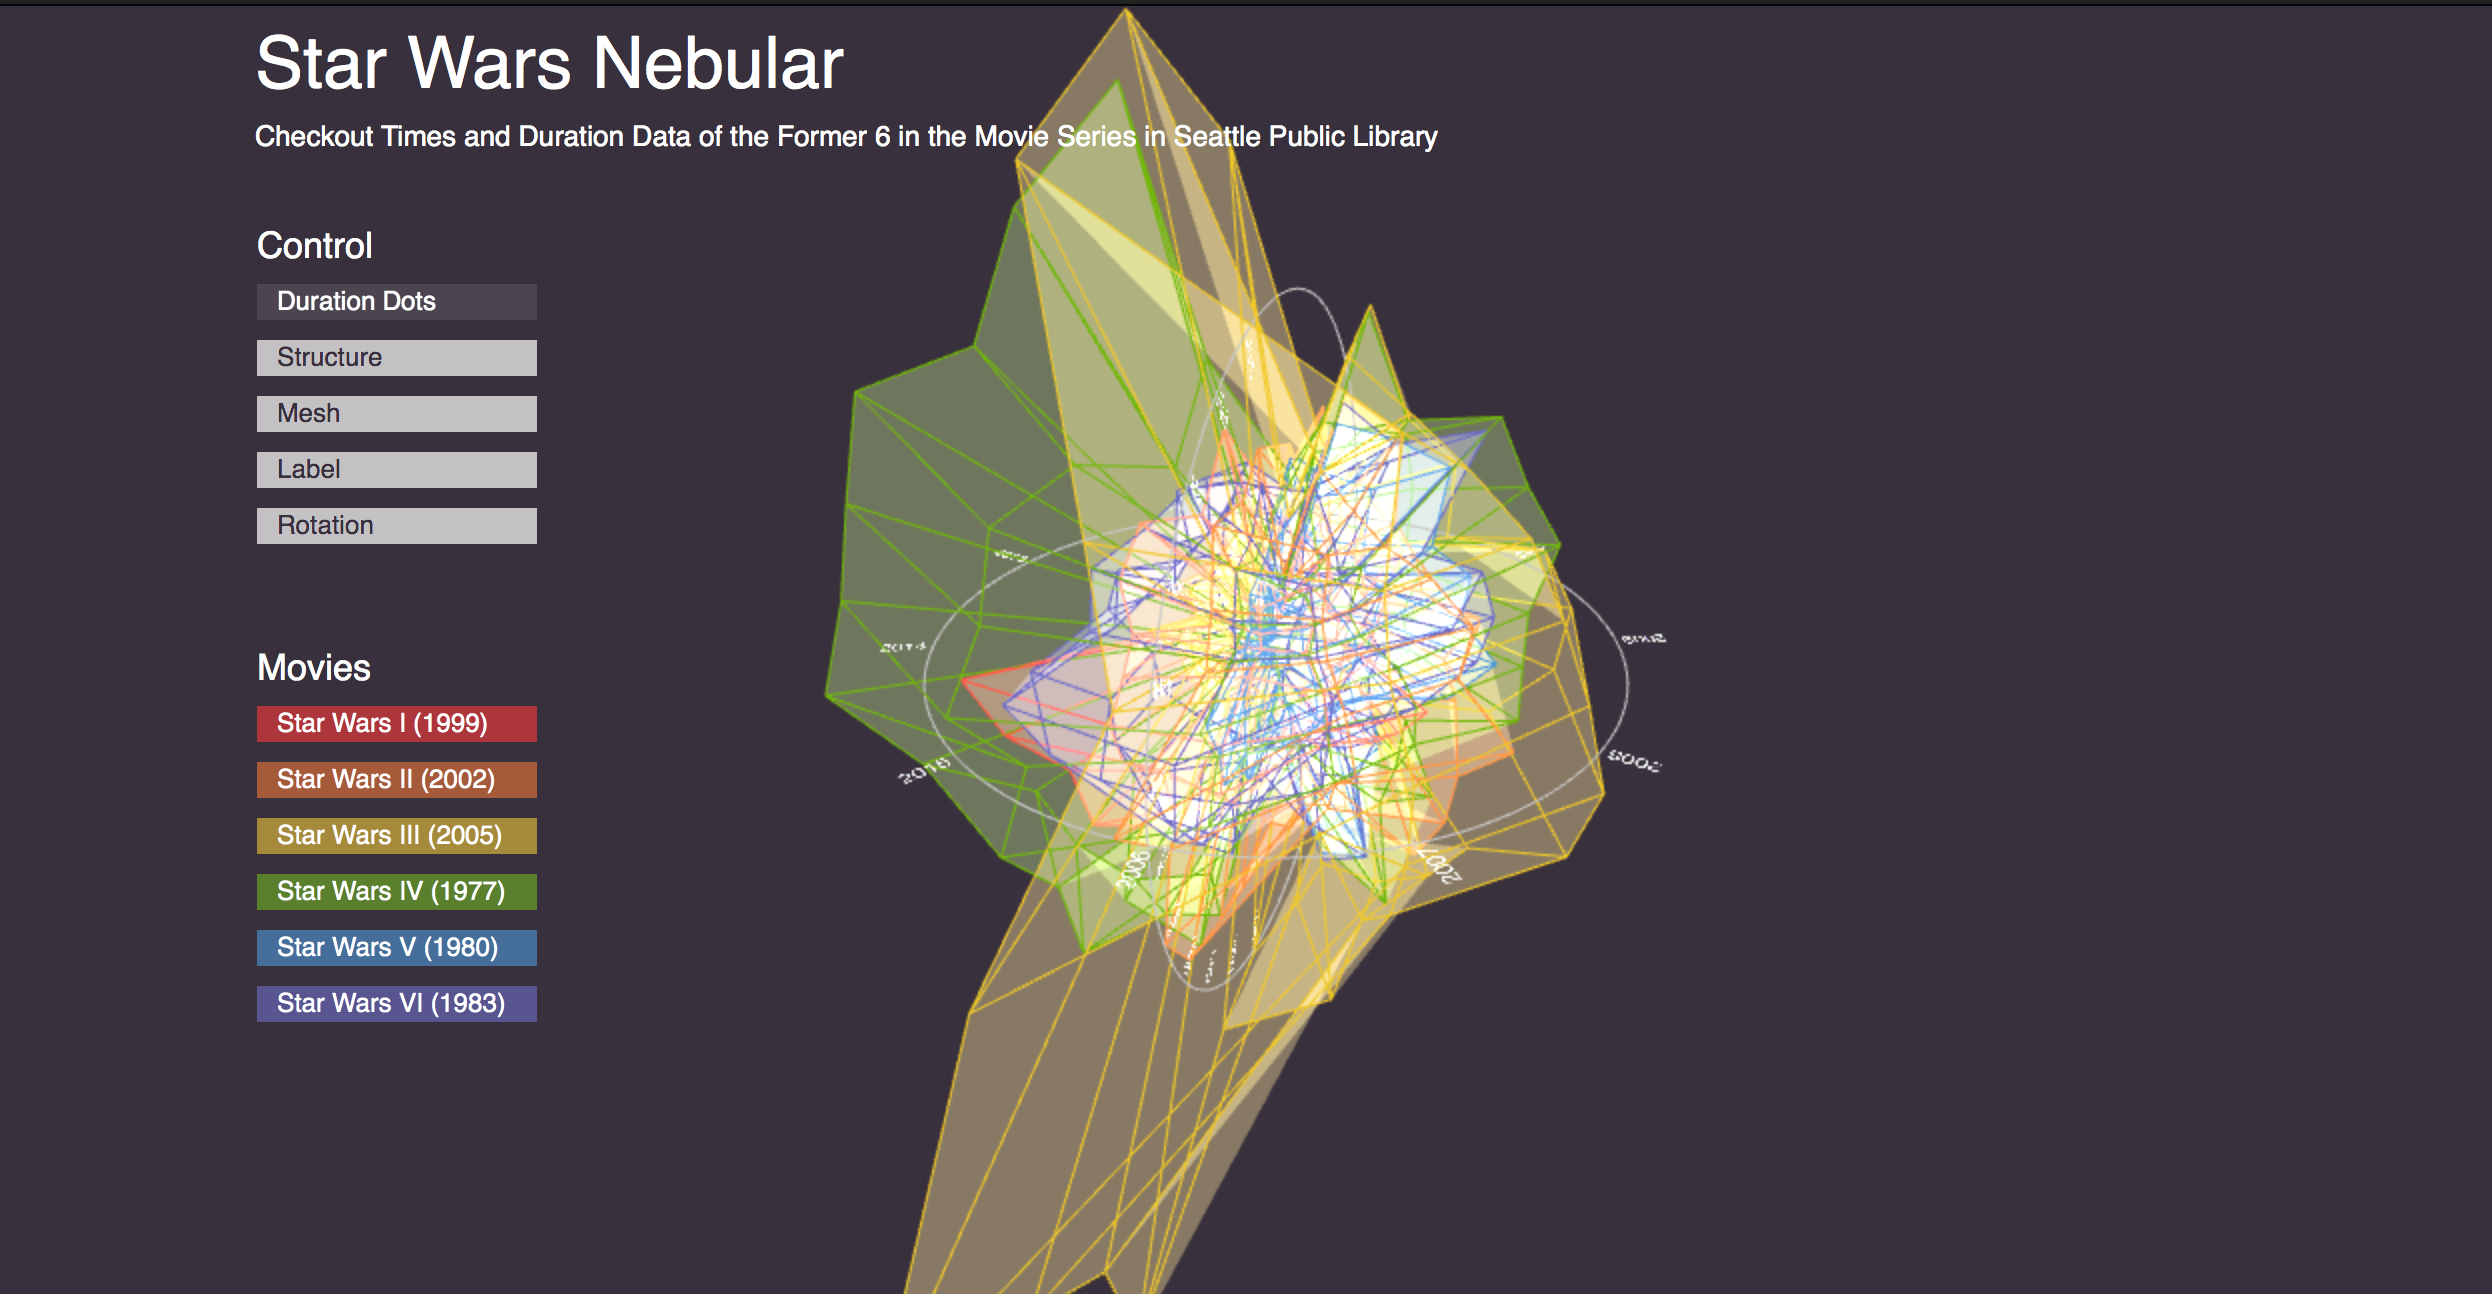
In this project, I tried to dig deeper. I decided to choose the data of a movie series or a novel series in SPL as the database. Since Star Wars 7 had just been released last Christmas, I was curious about the patterns of the former 6 movies in this movie series. And I chose years, months, movie titles, checkout times and duration times as the columns I used in the visualization. Basically, I calculated the total checkout times and the duration times, which is calculated using TIMESTAMPDIFF() function in MySQL, and sorted the data by the order of month and year.
Query
Here is the query of calculating checkout times:
Because the six queries which calculated duration time the six movies are very similar to each other. So I just show one of them here.
The query of calculating duration times of Star War 4, The New Hope:
Select YEAR(checkout) AS Year, MONTH(checkout) AS Month,

SUM(CASE

WHEN spl.title.title like '%The Phantom Menace%' Then 1

ELSE 0 END) AS 'StarWar1',

SUM(CASE

WHEN spl.title.title like '%Attack of the Clones%' Then 1

ELSE 0 END) AS 'StarWar2',

SUM(CASE

WHEN spl.title.title like '%Revenge of the Sith%' Then 1

ELSE 0 END) AS 'StarWar3',

SUM(CASE

WHEN spl.title.title like '%A New Hope%' Then 1

ELSE 0 END) AS 'StarWar4',

SUM(CASE

WHEN spl.title.title like '%The Empire Strikes Back%' Then 1

ELSE 0 END) AS 'StarWar5',

SUM(CASE

WHEN spl.title.title like '%Return of the Jedi%' Then 1

ELSE 0 END) AS 'StarWar6'

From spl._transactionsExploded, spl.title

WHERE spl._transactionsExploded.bibNumber = spl.title.bibNumber

AND YEAR(checkOut) >= '2006'

AND YEAR(checkOut) < '2016'

GROUP BY MONTH(checkOut) , YEAR(checkOut)

ORDER BY YEAR(checkOut) , MONTH(checkOut)
Because the six queries which calculated duration time the six movies are very similar to each other. So I just show one of them here.
The query of calculating duration times of Star War 4, The New Hope:
Select YEAR(checkOut) AS Year,

MONTH(checkOut) AS Month,

Count(TIMESTAMPDIFF(DAY,checkOut,checkIn))AS'starwas4duration'

From spl._transactionsExploded, spl.title

WHERE spl._transactionsExploded.bibNumber = spl.title.bibNumber

AND spl.title.title like '%A New Hope%'

AND YEAR(checkOut) >= '2006'

AND YEAR(checkOut) < '2016'

GROUP BY MONTH(checkOut) , YEAR(checkOut)

ORDER BY YEAR(checkOut) , MONTH(checkOut)
Process
My first step is to built the user interface. I thought it would be easy to create the GUI ahead of the 3D visualization.
I used a library named EasyCam which is quite similar with PeasyCam. But Only when I finish the UI and started to use the features
provided by EasyCam, I realize that this two section is actually not compatible with each other. Thus, I have to abandon the user interface and start over.
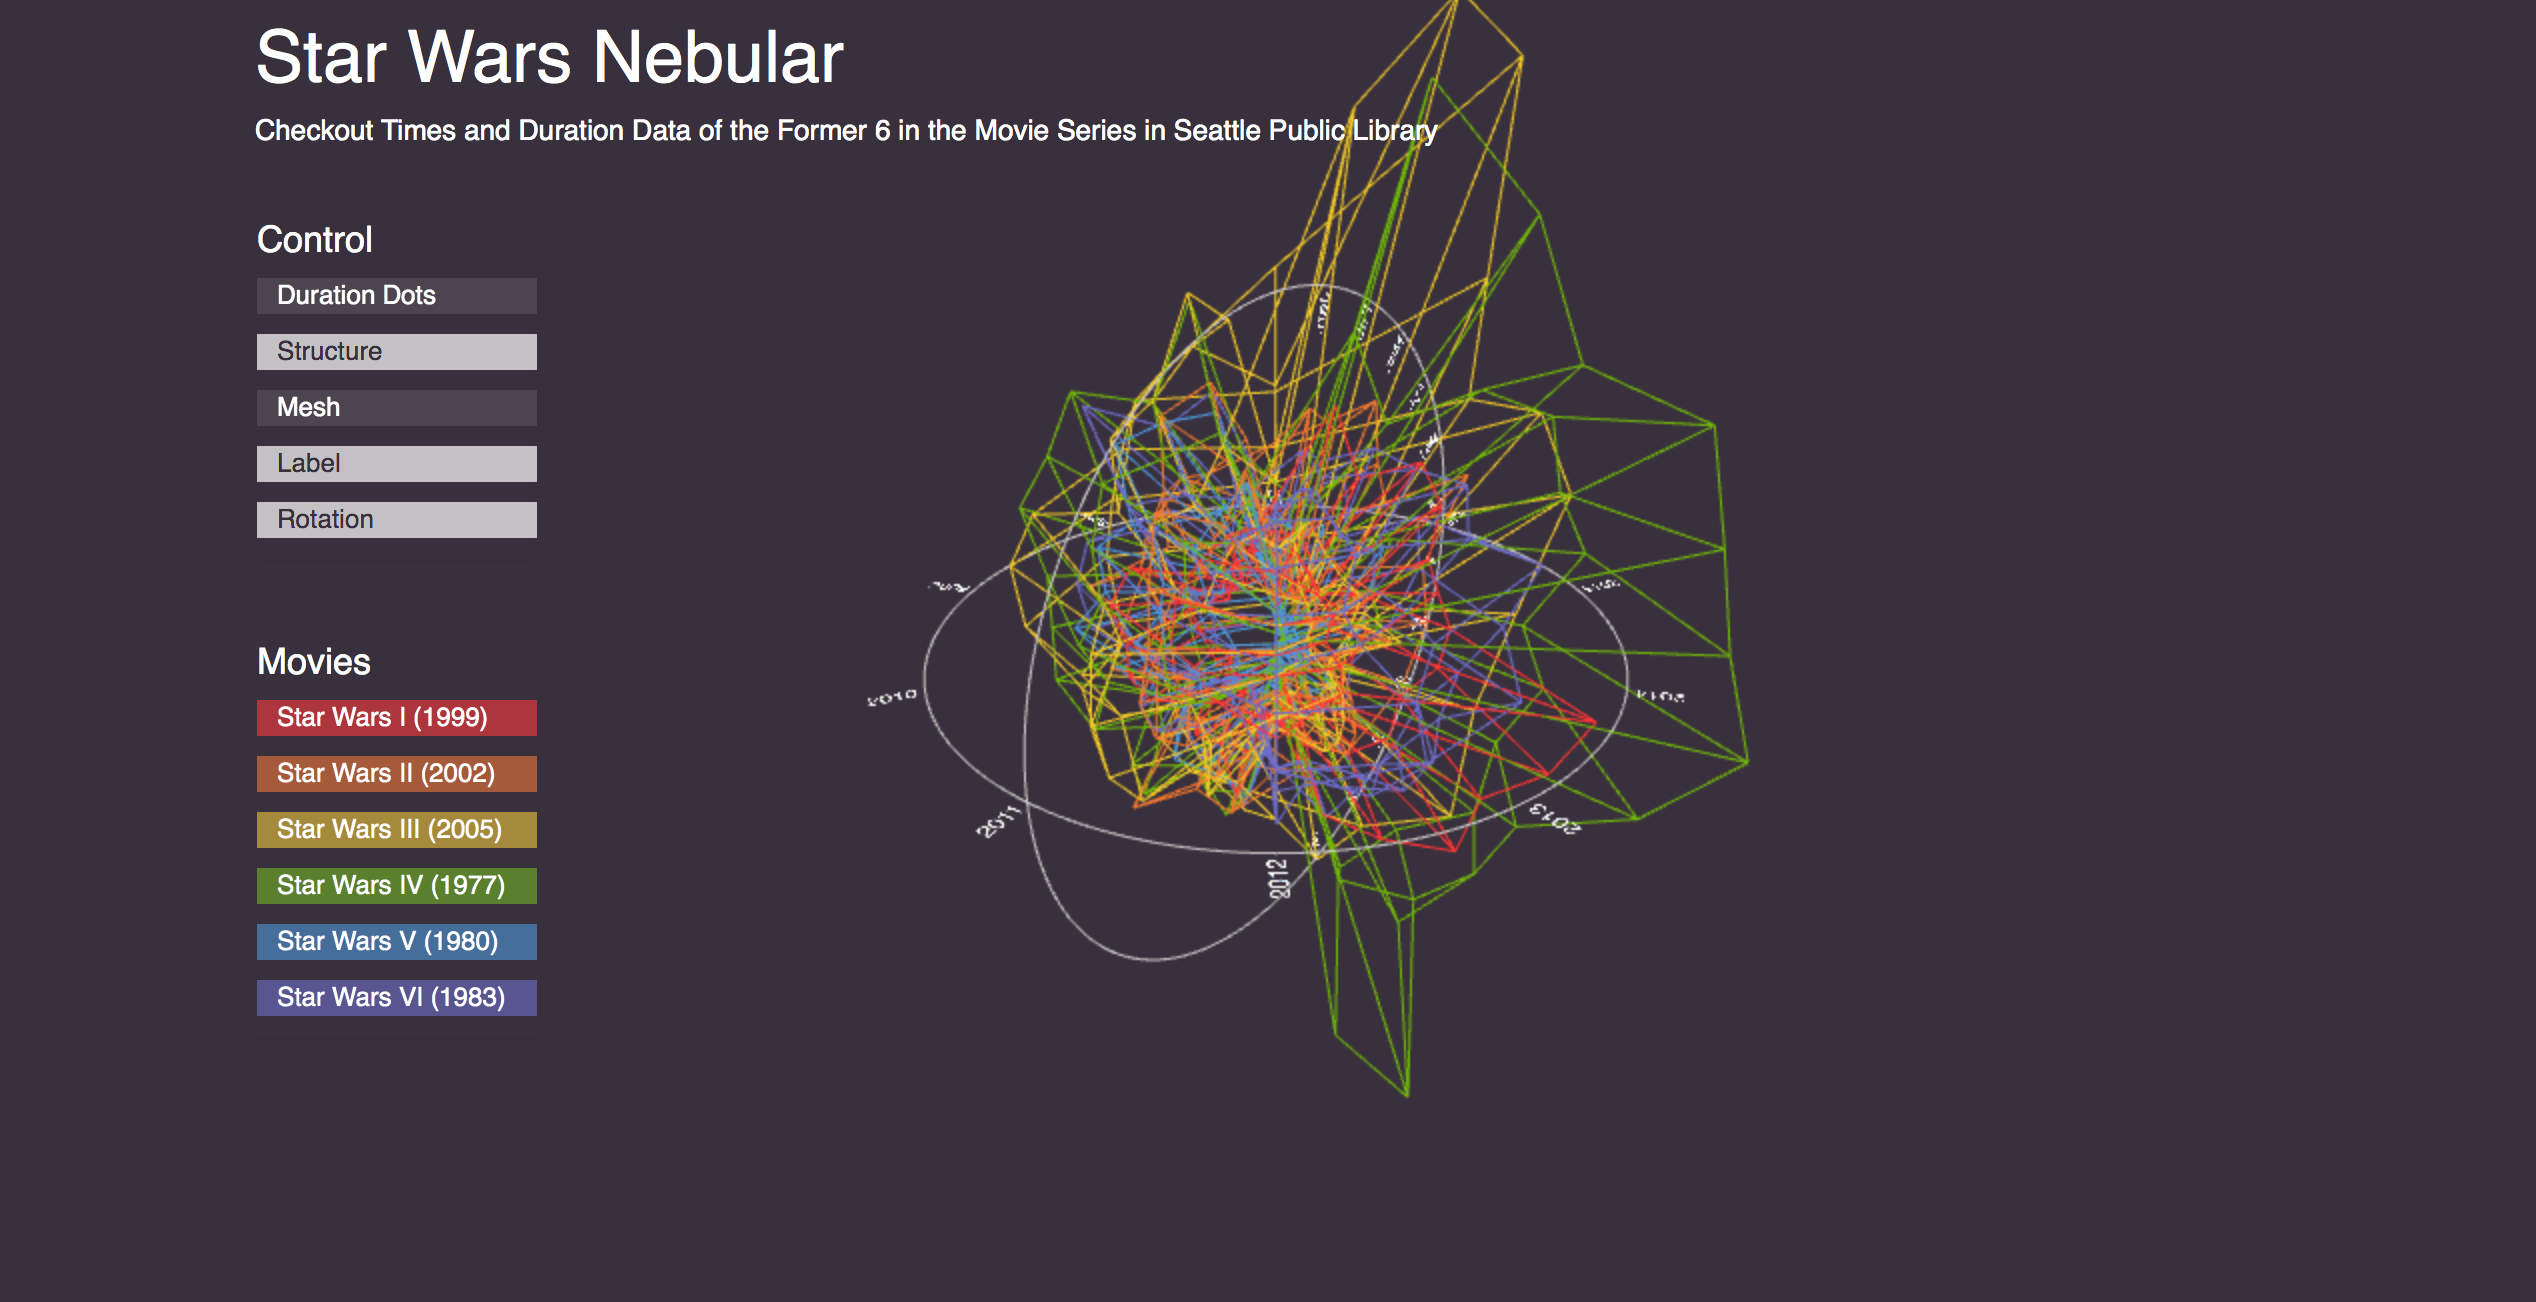
After loading in the data, I started to create the mesh by drawing triangles. Most of the functions required are the same as what they were in Processing. a slight different here is endShape(CLOSE); CLOSE is not required in Processing. Without CLOSE in P5.js, the surface will not be drawn. But fortunately, this is how I found a nice way to draw lines in P5.js. Since the lines WebGL drawn consists of many small triangles, it will freeze the scene when user tried to interact with the project. By drawing mesh without the surface, the line will remain at the correct location, and the line() function won't be needed any more. Due to the difference between the ways WebGL and Processing rendering scenes, the P5.js version transparent mesh has to look pale. Although it is not as elegant as it was in Processing, it is more logically reasonable in terms of what should be shown and what shouldn't.
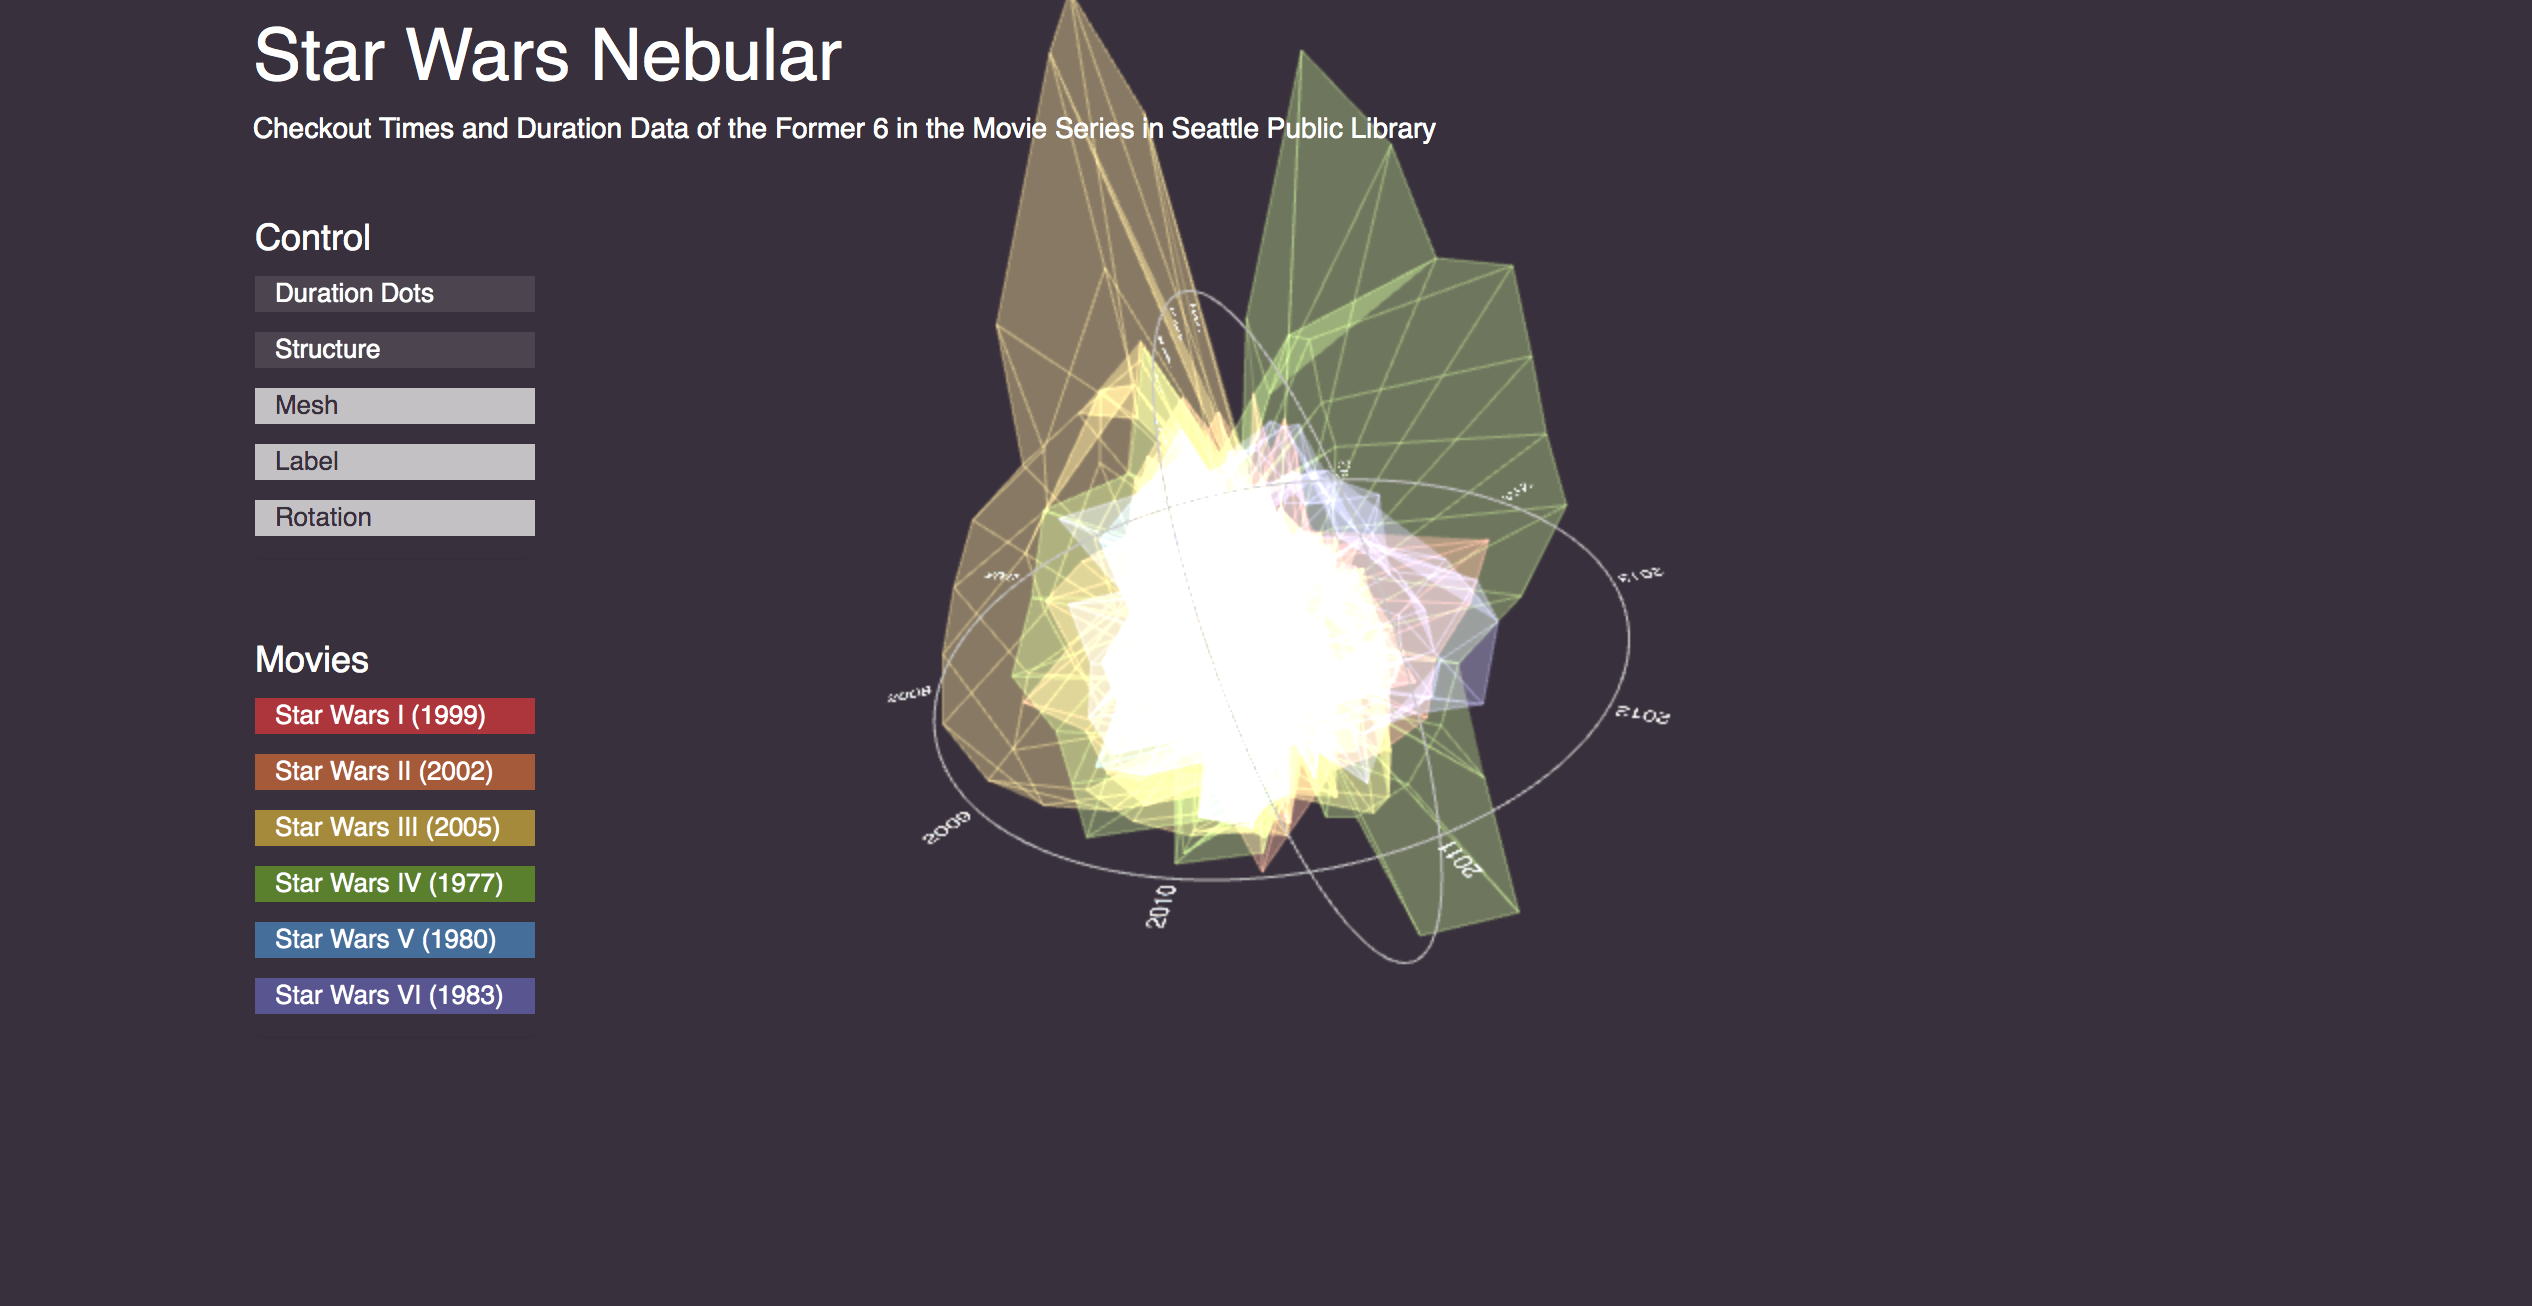
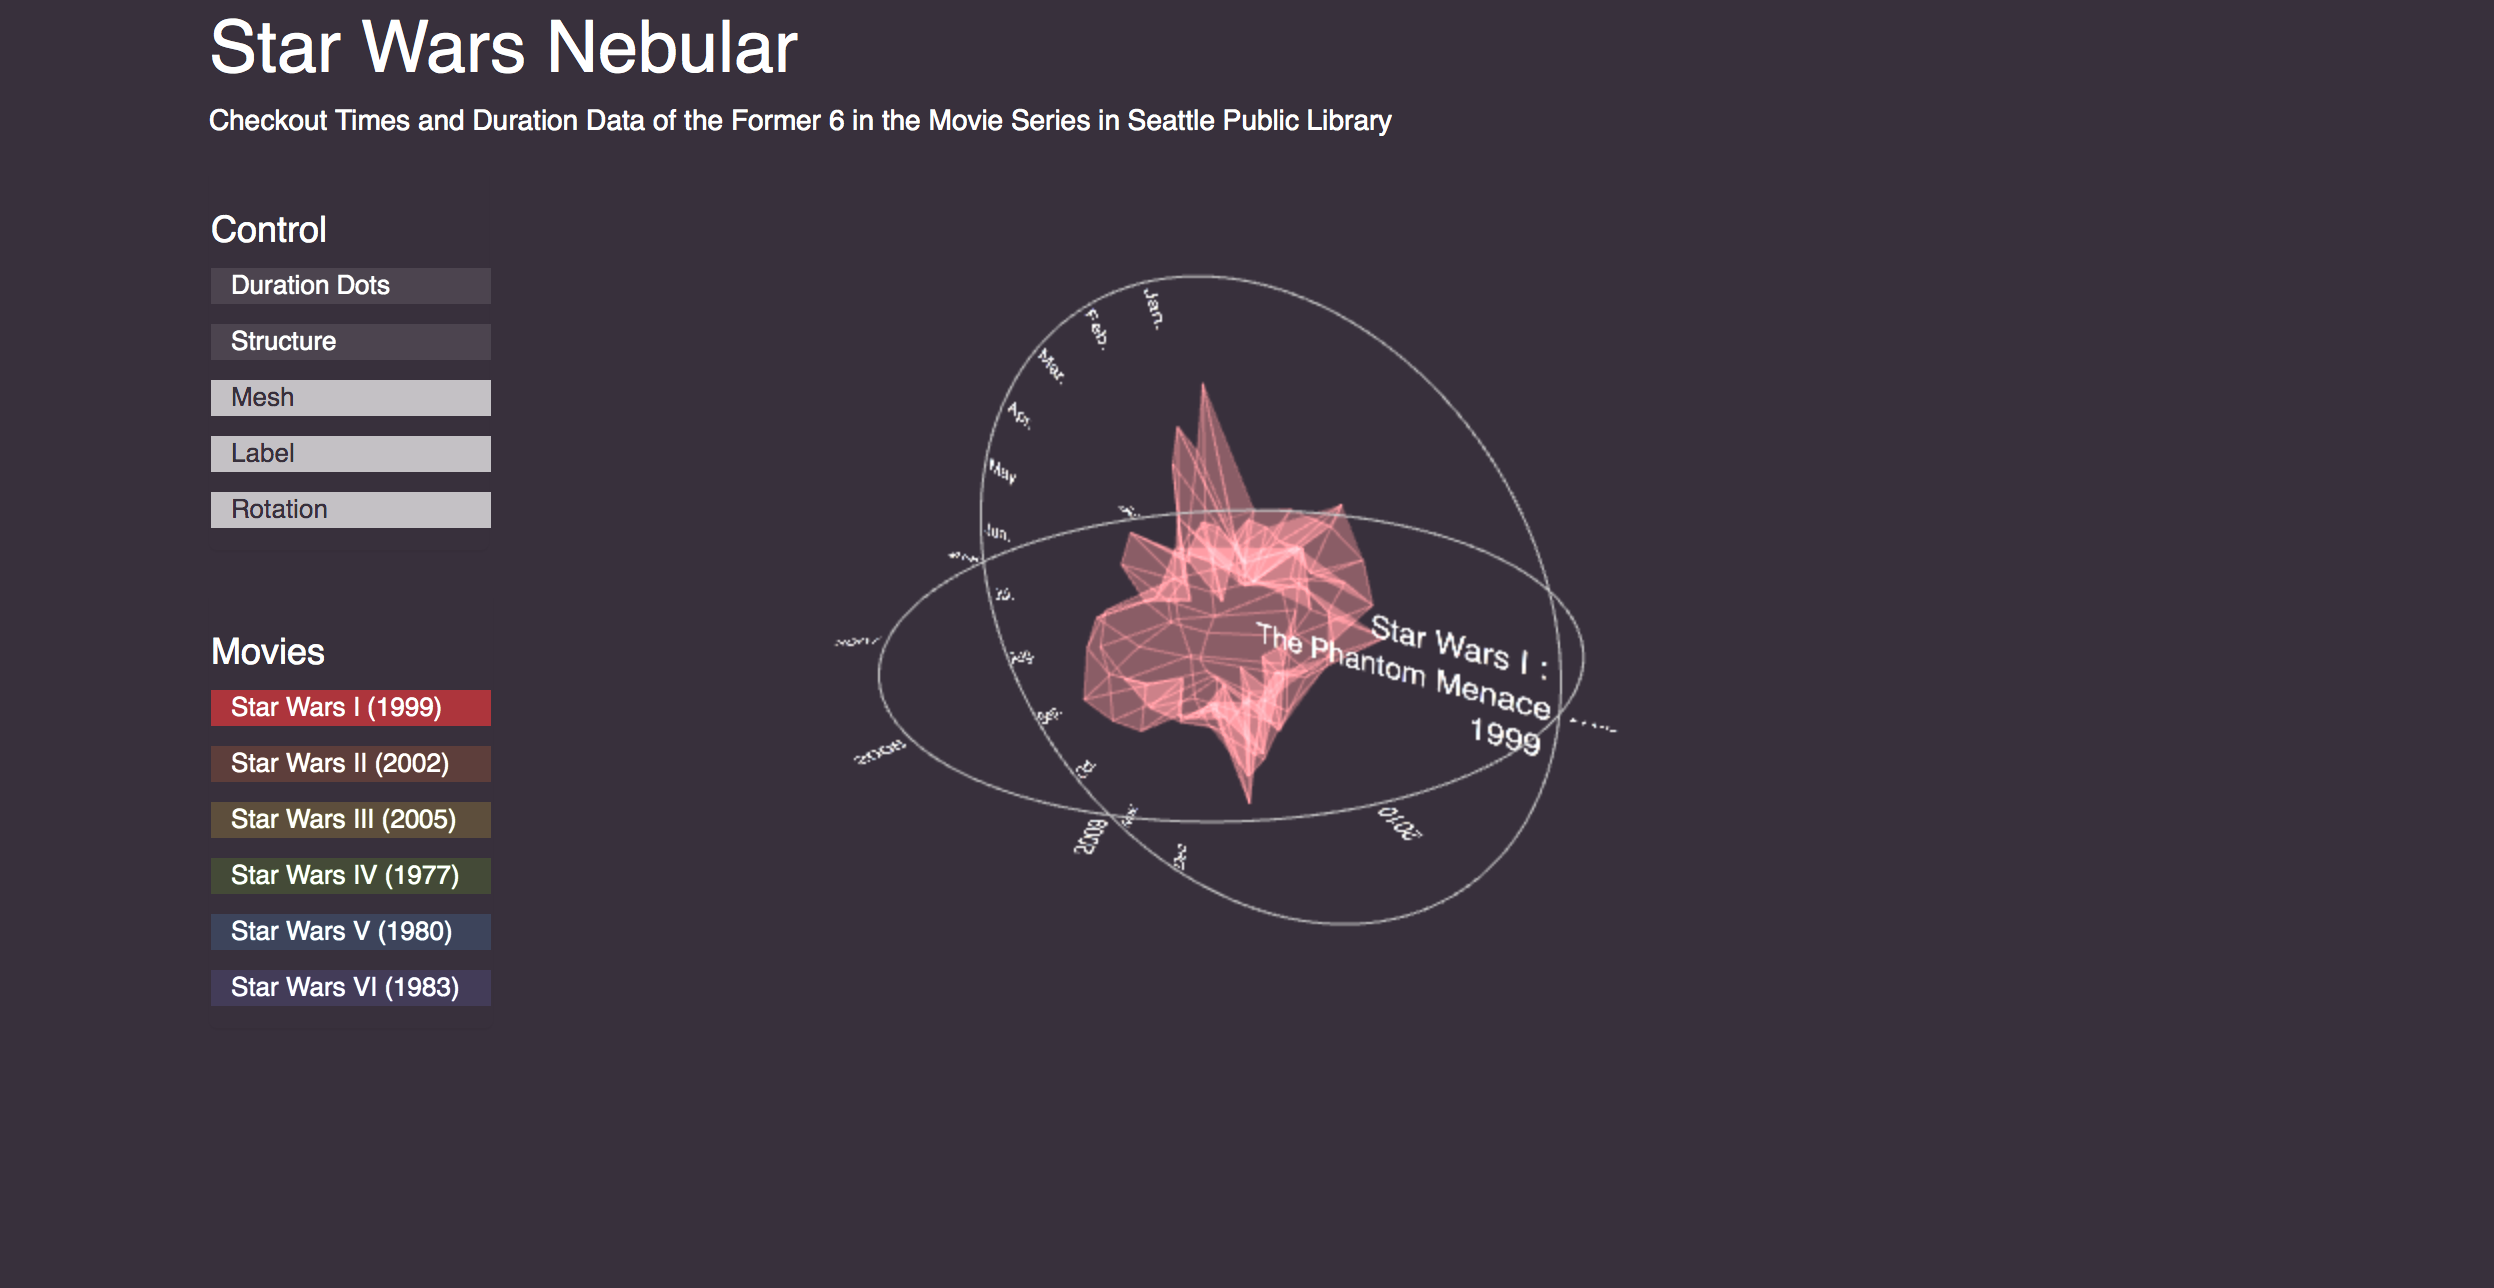
Next thing I wrote is the lable. The drawing of the label is a bit trickyer than it was in Processing, because there is no straight forward show-text-in-3D functionality provided by neigher WebGL nor P5.js. The solution is to render the text as a texture and stick it to a plane.
When the 3D works was done, I started to rebuild the user interface. Because this project is using WebGL, to generate a 2D heads-up display which will not move with the camera required the use of DOM element. In the HTML file, I added the title and two sections forbuttons. And in sketch.js, I get the sections and generated buttons in them in Javascript respectively. When adding hover effect in sketch.js, I realized that I cannot integrate them in a loop. Therefore, I have to manually access every button and add a hover effect and selection mode on them. This is the part which I hope it could be DRYer since I have simplified the code than it was in Processing 2 years ago. I also added a rotation button to stop and resume the default rotation as an amendment.
When I was testing new added buttons, I realized that the DOM elemnt might not be compatible with EasyCam, which is the cause of the abandonment of the UI in the firstpace. But after several turns of experiment, I found that the cause is not DOM elements but their CSS attributes. It is crutial to be very careful when manipulate CSS attributes which related to the width and height. Functions like “left: calc(-50vw + 50%);” will disable EasyCam which relies on the position of the mouse. I also found that if the div, not the buttons shown on the screen, which containing the buttons, are too wide that it covers the whole screen, EasyCam will act weird because the computer will consider the mouse movement as events related to the buttons as they all entangled together. There is a conflict of detect mouse event and location in screen between CSS and EasyCam. After restricting the width of divs, EasyCam works just fine.
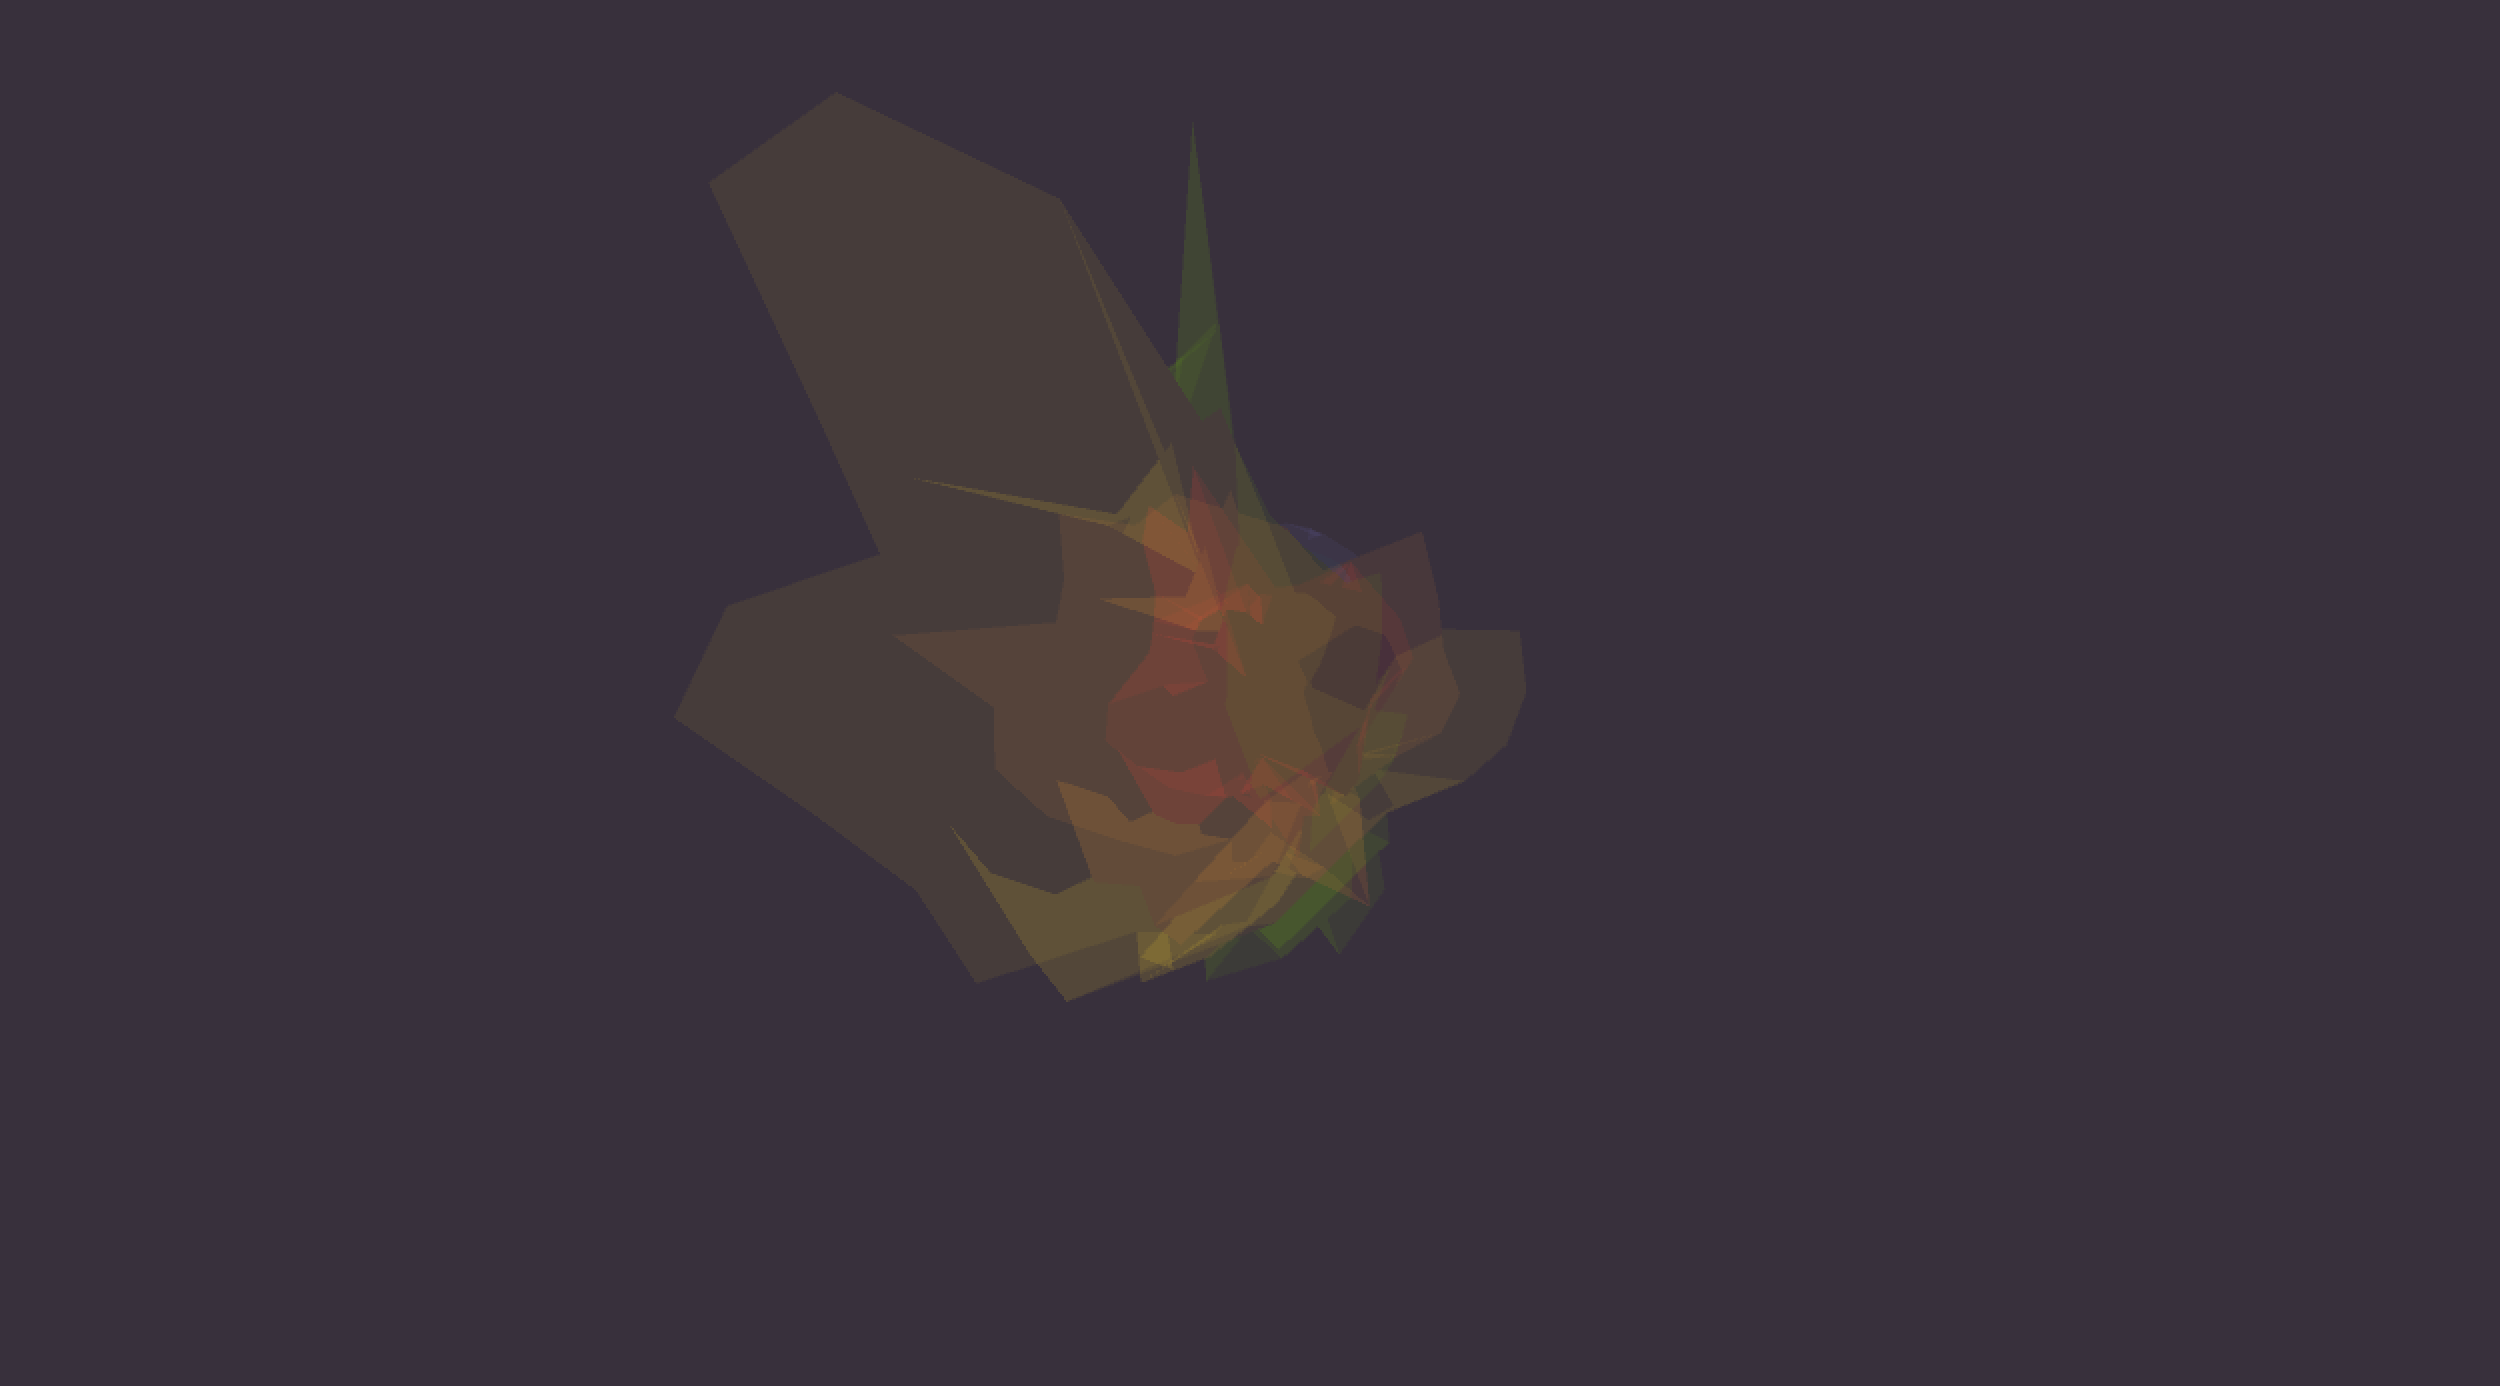
After loading in the data, I started to create the mesh by drawing triangles. Most of the functions required are the same as what they were in Processing. a slight different here is endShape(CLOSE); CLOSE is not required in Processing. Without CLOSE in P5.js, the surface will not be drawn. But fortunately, this is how I found a nice way to draw lines in P5.js. Since the lines WebGL drawn consists of many small triangles, it will freeze the scene when user tried to interact with the project. By drawing mesh without the surface, the line will remain at the correct location, and the line() function won't be needed any more. Due to the difference between the ways WebGL and Processing rendering scenes, the P5.js version transparent mesh has to look pale. Although it is not as elegant as it was in Processing, it is more logically reasonable in terms of what should be shown and what shouldn't.
P5.js
Processing
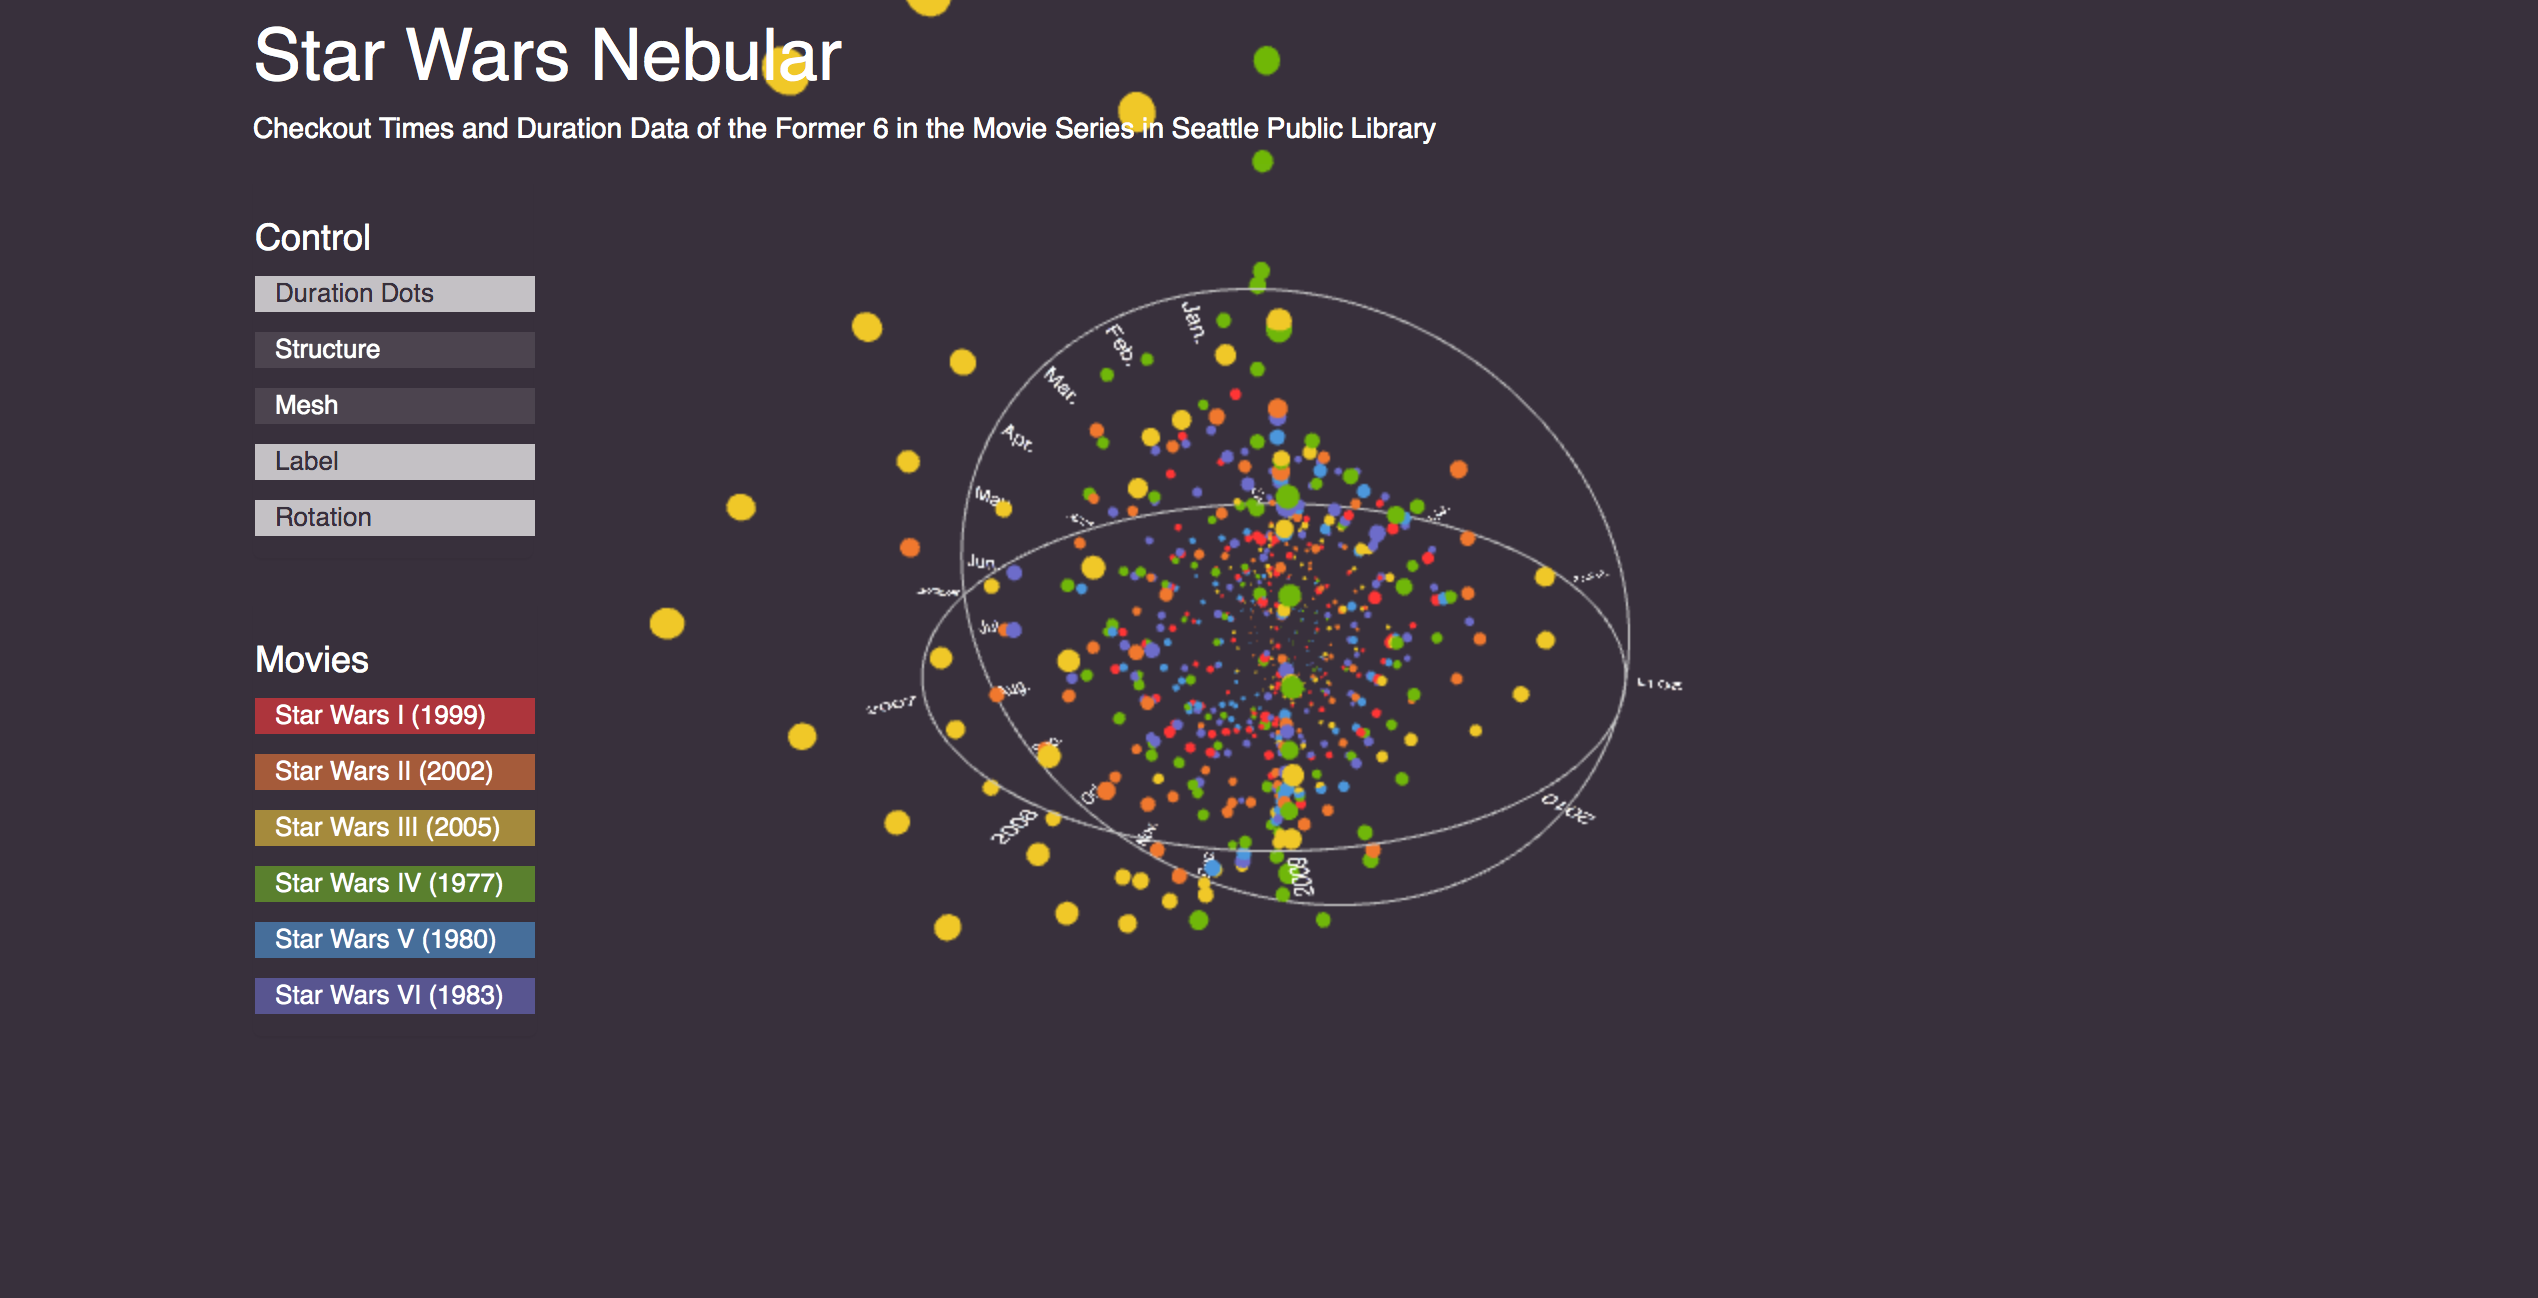
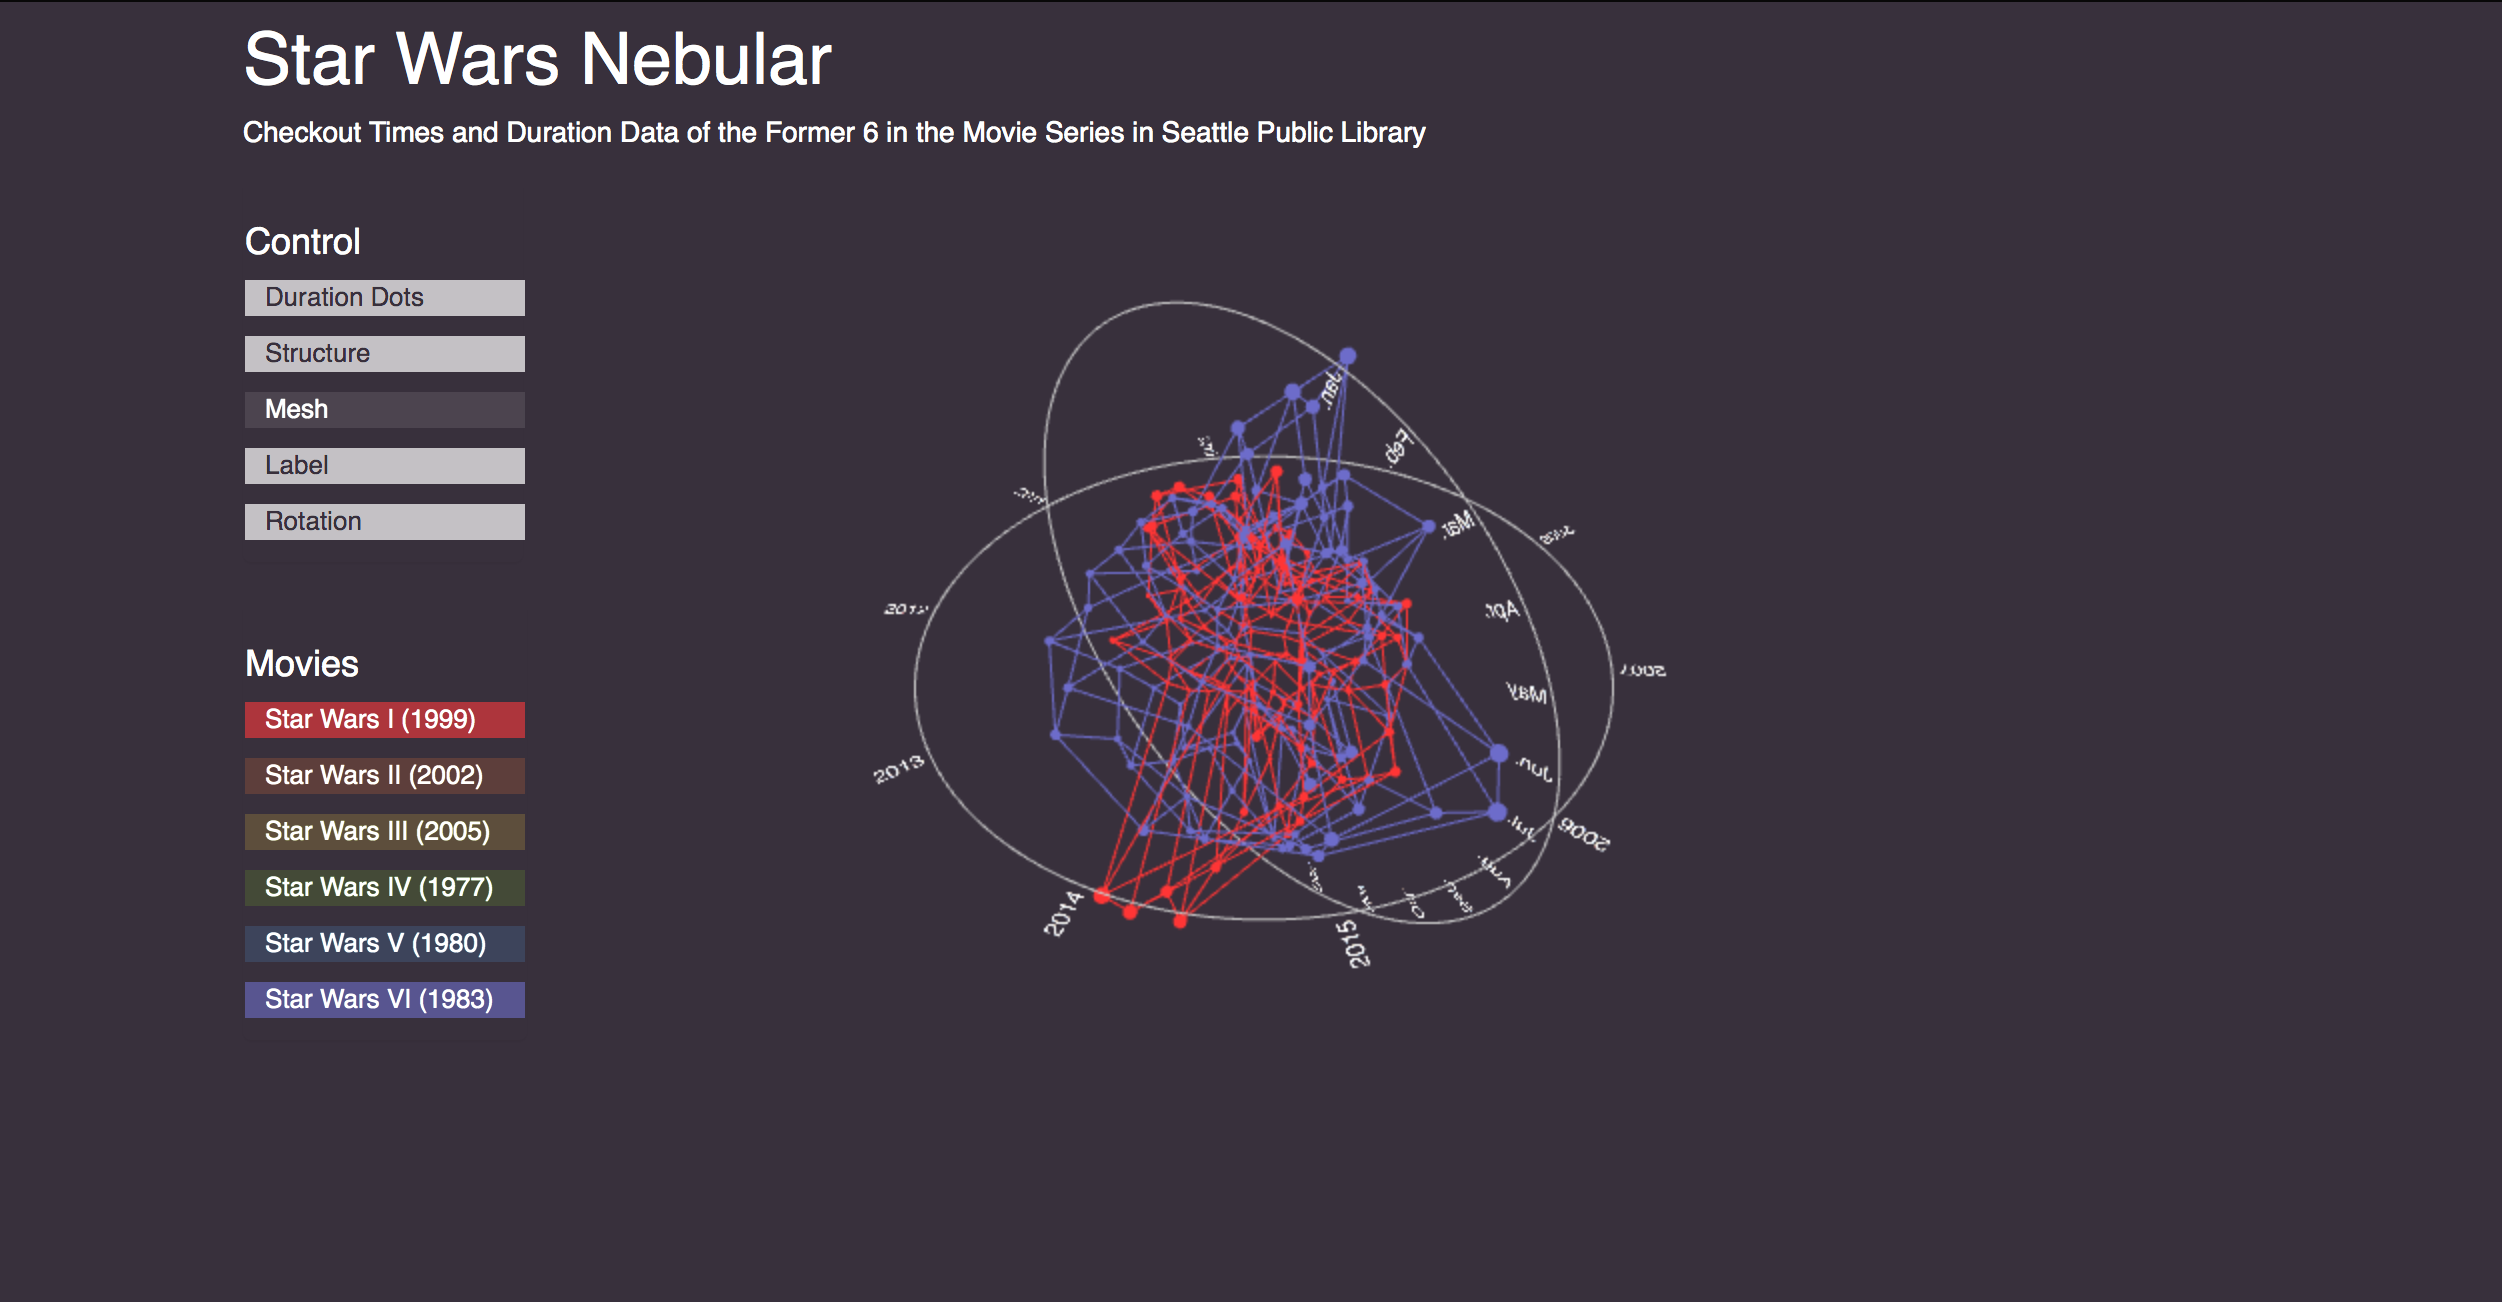
As for the duration dots which I called point() to draw in Processing, I used sphere() instead. And WebGL need a little moment to draw the spheres which may cause a little jamming when I switch the mode, I drew those spheres without showing them in setup().Next thing I wrote is the lable. The drawing of the label is a bit trickyer than it was in Processing, because there is no straight forward show-text-in-3D functionality provided by neigher WebGL nor P5.js. The solution is to render the text as a texture and stick it to a plane.
When the 3D works was done, I started to rebuild the user interface. Because this project is using WebGL, to generate a 2D heads-up display which will not move with the camera required the use of DOM element. In the HTML file, I added the title and two sections forbuttons. And in sketch.js, I get the sections and generated buttons in them in Javascript respectively. When adding hover effect in sketch.js, I realized that I cannot integrate them in a loop. Therefore, I have to manually access every button and add a hover effect and selection mode on them. This is the part which I hope it could be DRYer since I have simplified the code than it was in Processing 2 years ago. I also added a rotation button to stop and resume the default rotation as an amendment.
When I was testing new added buttons, I realized that the DOM elemnt might not be compatible with EasyCam, which is the cause of the abandonment of the UI in the firstpace. But after several turns of experiment, I found that the cause is not DOM elements but their CSS attributes. It is crutial to be very careful when manipulate CSS attributes which related to the width and height. Functions like “left: calc(-50vw + 50%);” will disable EasyCam which relies on the position of the mouse. I also found that if the div, not the buttons shown on the screen, which containing the buttons, are too wide that it covers the whole screen, EasyCam will act weird because the computer will consider the mouse movement as events related to the buttons as they all entangled together. There is a conflict of detect mouse event and location in screen between CSS and EasyCam. After restricting the width of divs, EasyCam works just fine.
Final result
Project