3D Visualisation of SPL Travel Books
MAT 259, 2018
Christina Last
Concept
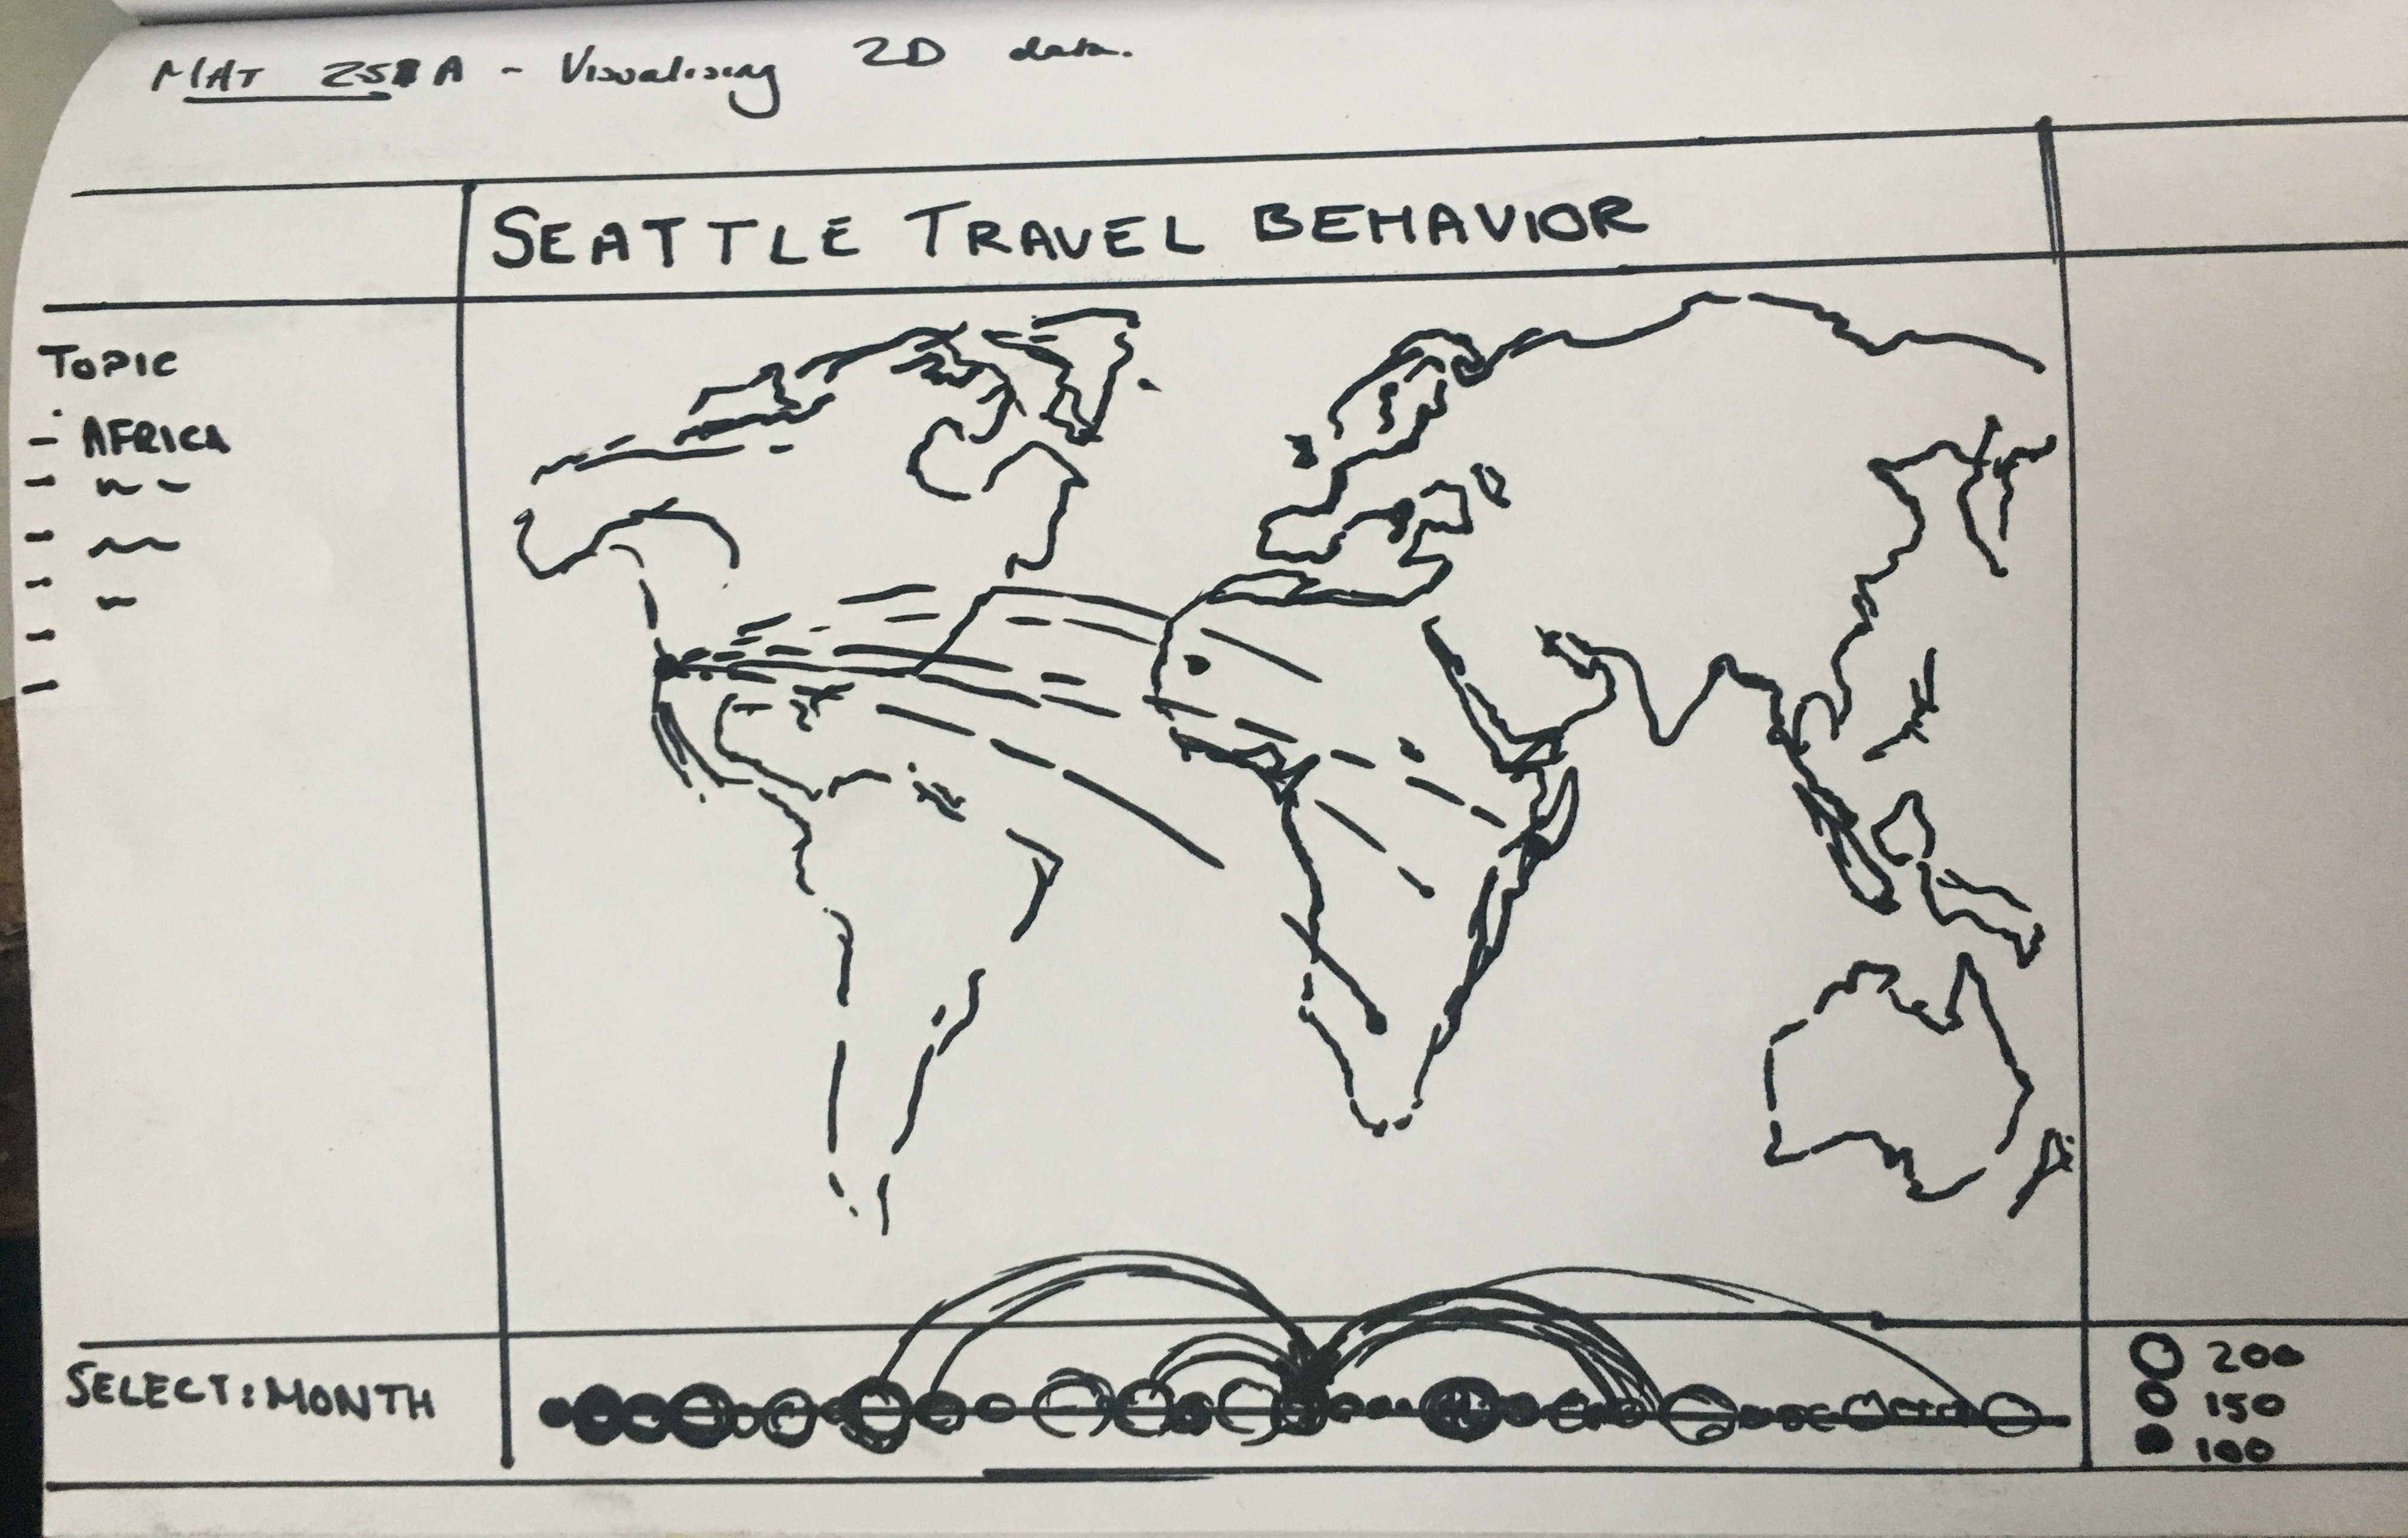
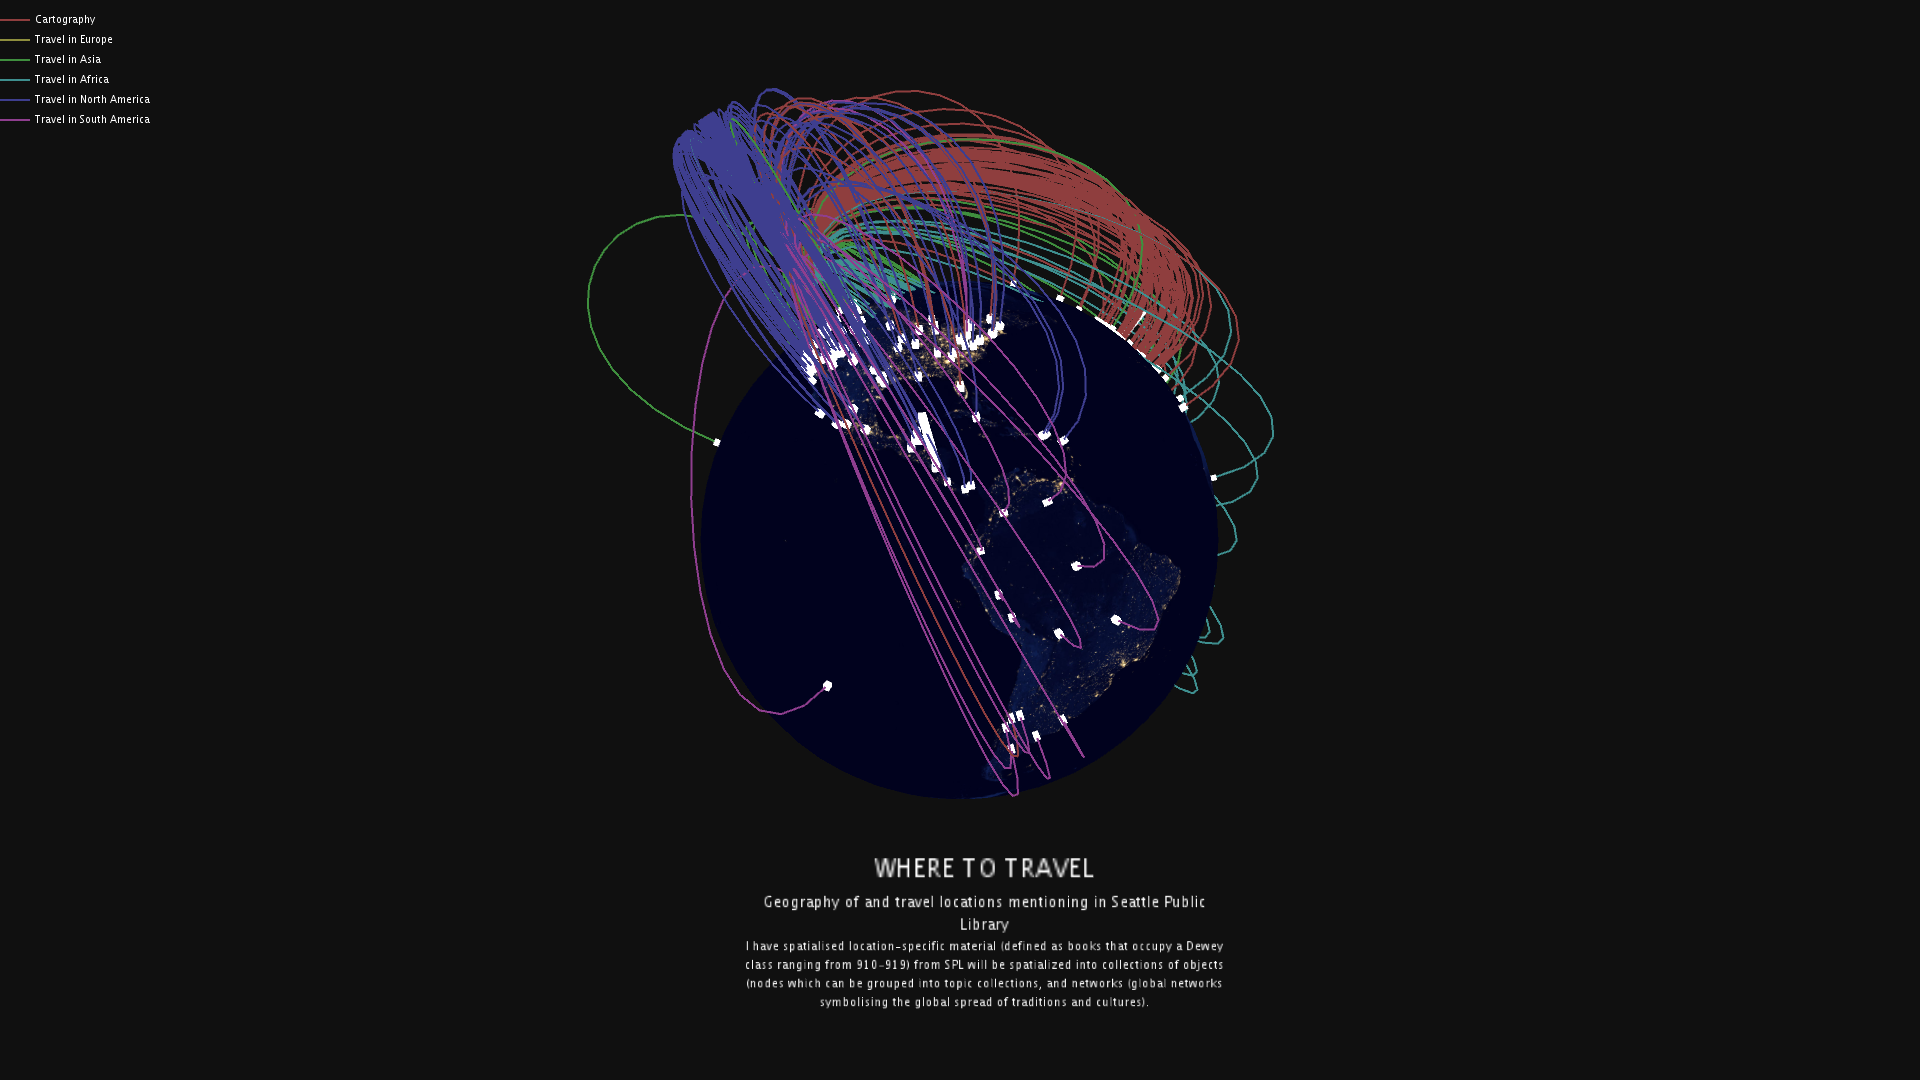
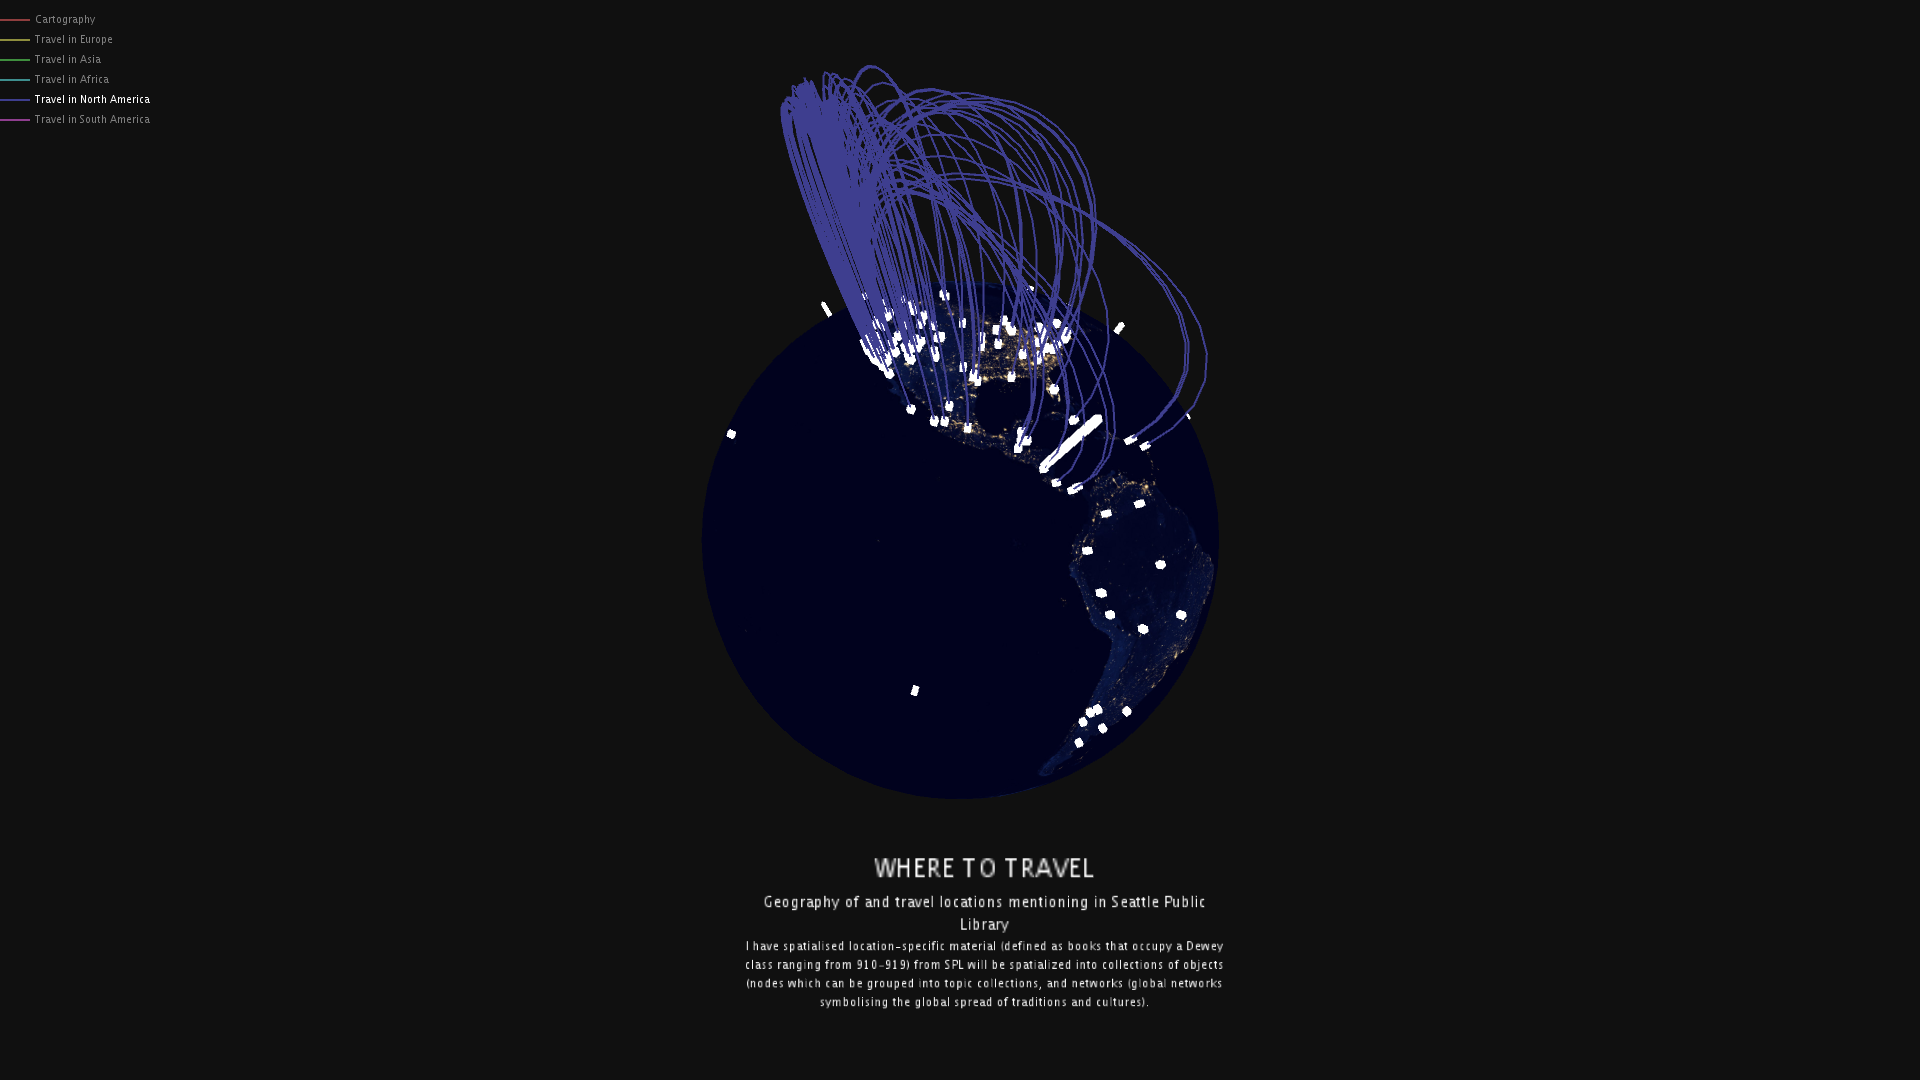
For my 3D visualisation I aim to create a map of the world in 3D, with each of the locations of the travel guides being linked by a curve to the Seattle Public Library. The metaphor of information flows across the globe is used to show how cultures, traditions and histories unique to specific locations can become globalised through library books.
I have spatialised location-specific material (defined as books that occupy a Dewey class ranging from 910-919) from SPL will be spatialized into collections of objects (nodes which can be grouped into topic collections, and networks (global networks symbolising the global spread of traditions and cultures). Such spatializations convey how location-specific material is related not just through geographic location, but through similarity (e.g. complementary topic neighbourhoods). The expected result is the development of search spaces that situate location-specific material in much more powerful ways than library shelves, supporting multiple paradigms of data discovery, including querying and browsing.
For this assignment I altered my SQL query to deliver multidimensional data. I requested thr total number of times a library item had been checked out, its Dewey Classification, item number, and a breakdown of the number of checkouts for each month of each year for the location-specific library items.
Query
Query for Selecting Dewey Classes
SELECT
COUNT(itemNumber) AS NumberOfTimes,
FLOOR(deweyClass) * 100 AS Dewey,
title
id, itemNumber,
COUNT(bibNumber) AS Counts,
SUM(CASE
WHEN (YEAR(cout) = 2006 AND MONTH(cout) = 1) THEN 1
ELSE 0
END) AS '2006-1',
SUM(CASE
WHEN (YEAR(cout) = 2006 AND MONTH(cout) = 2) THEN 1
ELSE 0
END) AS '2006-2',
...
SUM(CASE
WHEN (YEAR(cout) = 2017 AND MONTH(cout) = 10) THEN 1
ELSE 0
END) AS '2017-10',
SUM(CASE
WHEN (YEAR(cout) = 2017 AND MONTH(cout) = 11) THEN 1
ELSE 0
END) AS '2017-11',
SUM(CASE
WHEN (YEAR(cout) = 2017 AND MONTH(cout) = 12) THEN 1
ELSE 0
END) AS '2017-12'
FROM
spl_2016.inraw
WHERE
deweyClass >= 910
AND deweyClass <= 919
GROUP BY itemNumber, deweyClass , title
HAVING (COUNT(itemNumber) > 1)
ORDER BY NumberOfTimes DESC
LIMIT 100
Query for Geocoding place names in title
google_api <- "https://maps.googleapis.com/maps/api/geocode/json"
geocode <- function(address, verbose=FALSE)
r <- GET(google_api, query=list(address=address))
stop_for_status(r)
result <- content(r)
first <- result$results[[1]]
df <- as.data.frame(list(lat=first$geometry$location$lat, lon=first$geometry$location$lng))
return(df)
result[1,] <- geocode("Central America")
...
result[129,]<- geocode("Spanish Islands")
write.csv(result, "geocoded.csv", row.names=FALSE)
Preliminary sketches
Idea behind the visualisation is inspired by the New York Talk Exchange visualisation made by the Senseable City lab at MIT. This visualisation shows the flow of IP (Internet Protocol) data between locations. Volumes of Internet data flowing between New York and cities around the world. The size of the glow on a particular city location corresponds to the amount of IP traffic flowing between that place and New York City. A greater glow implies a greater IP flow.
My visualisation strategy is inspired by the global networks locating cultures traditions and histories I aim to represent the flow of information from locations around the world to Seattle public library.
My visualisation strategy is inspired by the global networks locating cultures traditions and histories I aim to represent the flow of information from locations around the world to Seattle public library.
Process
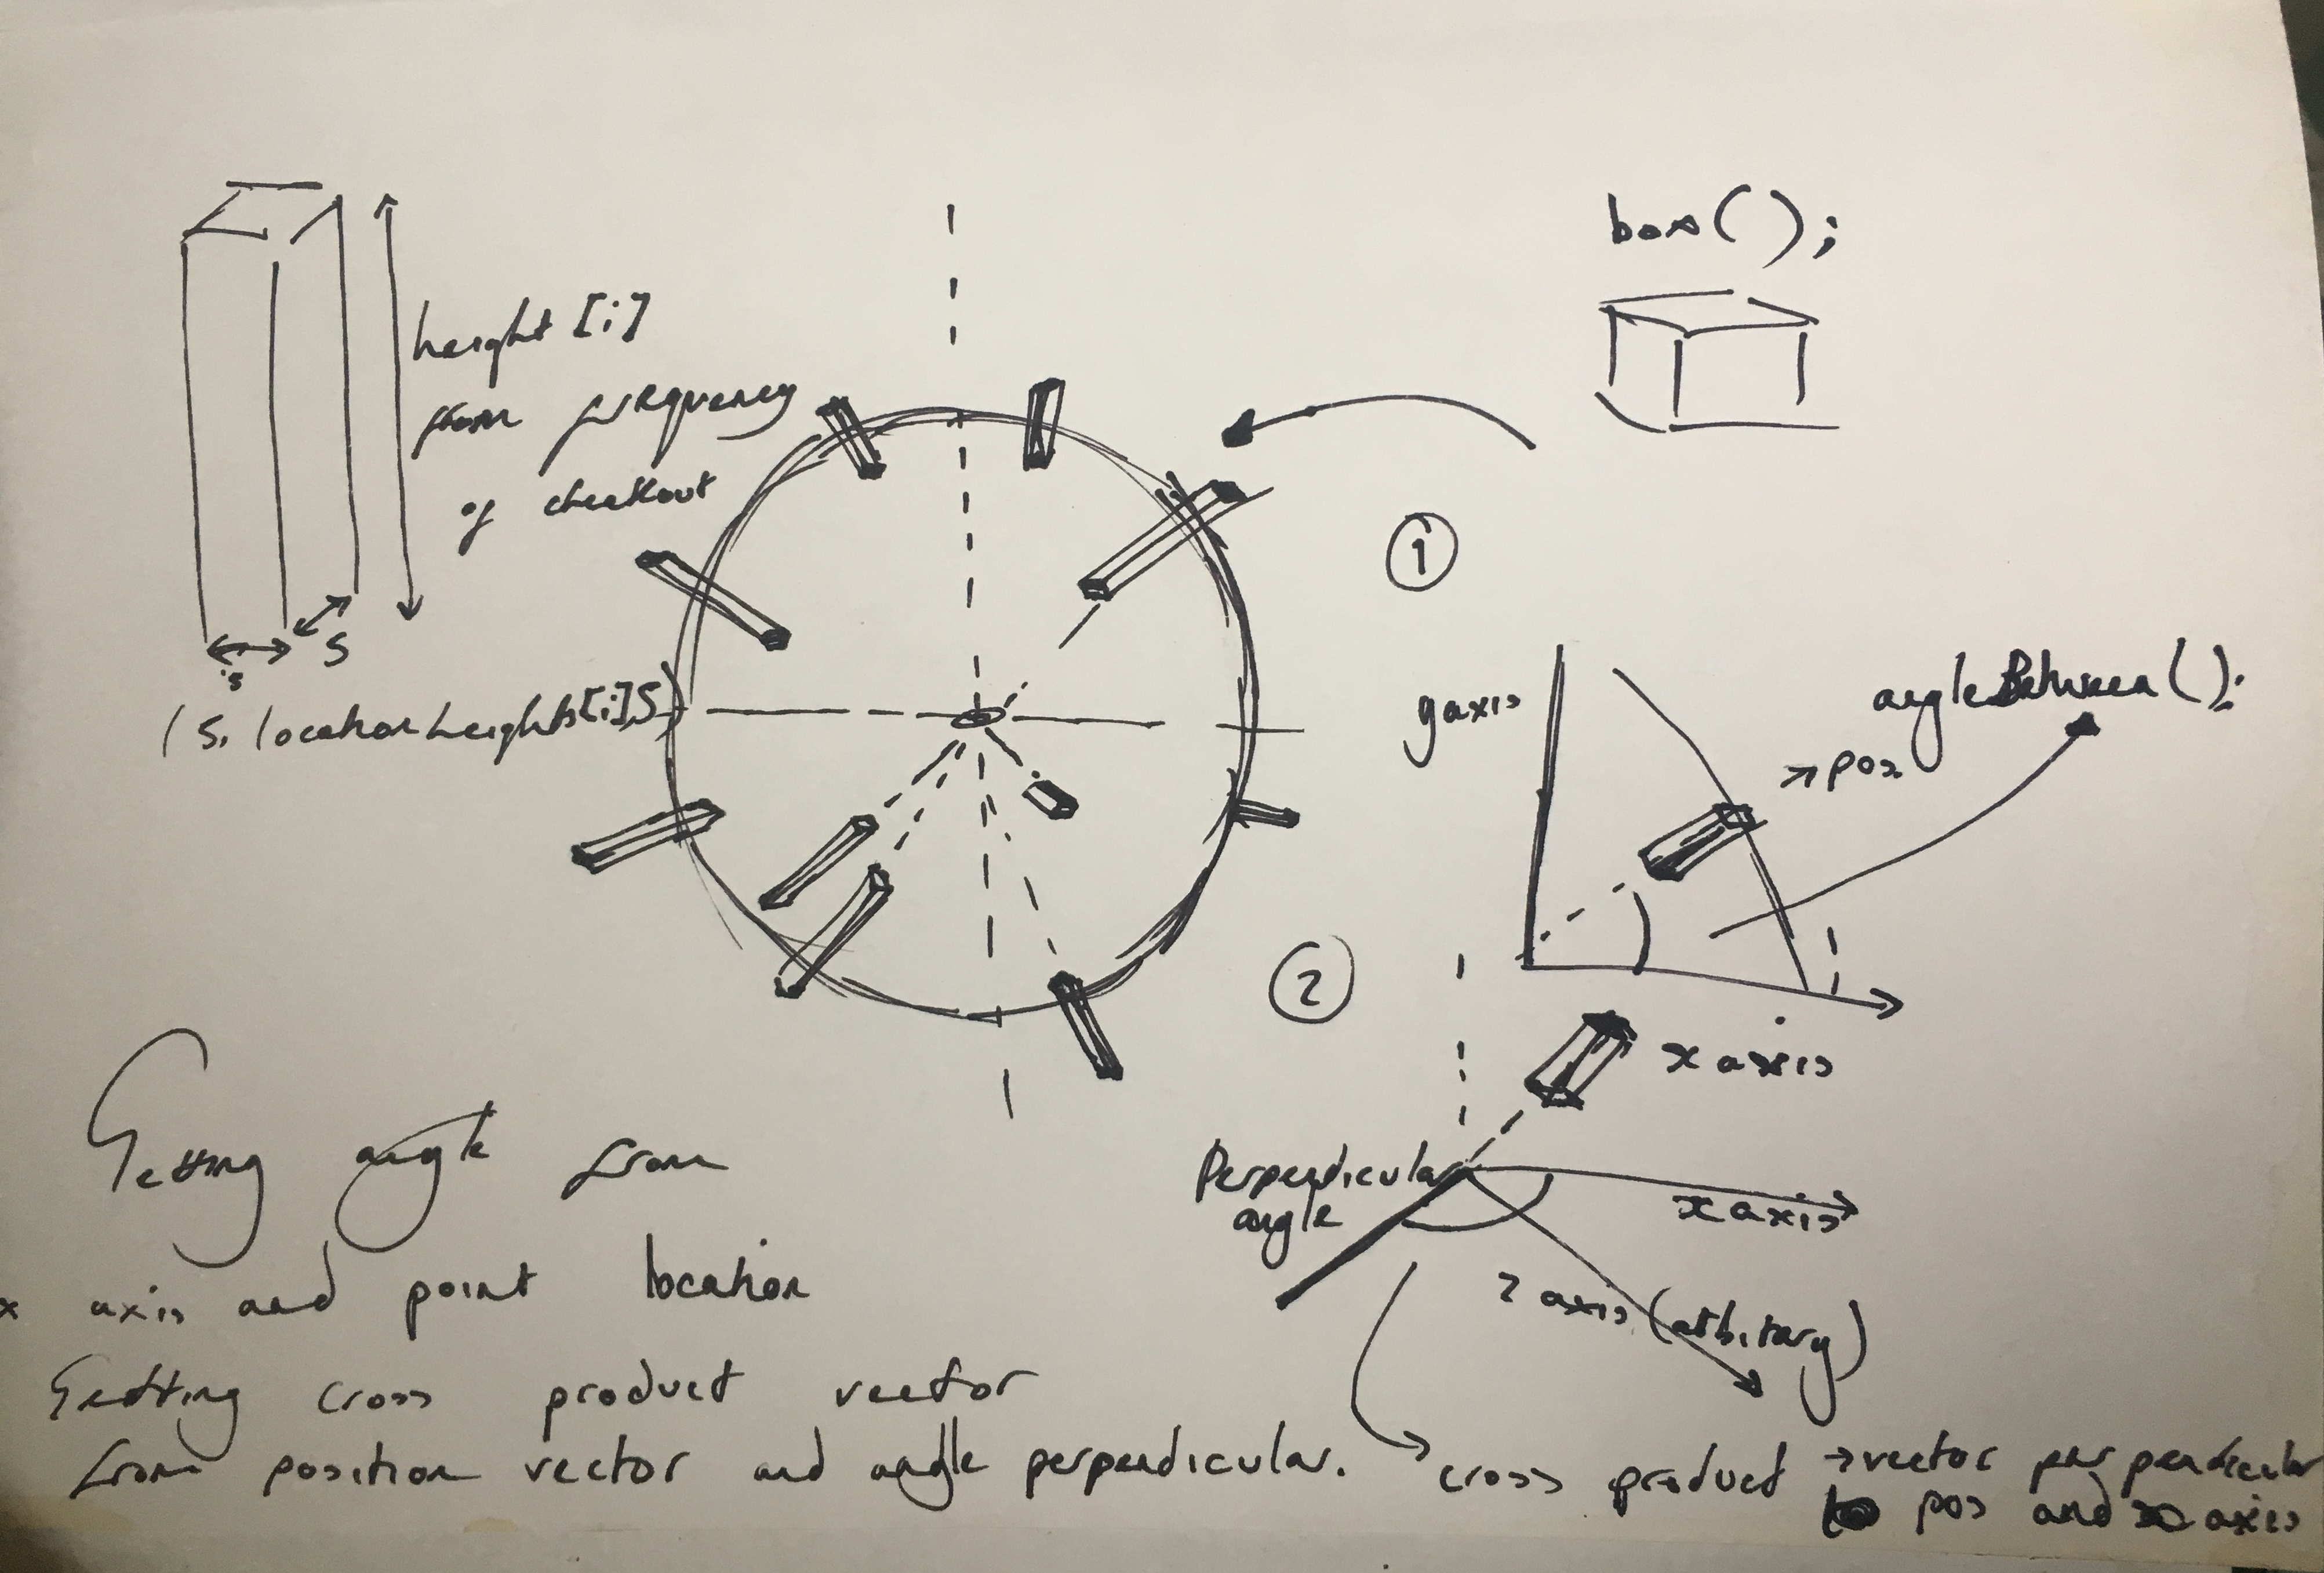
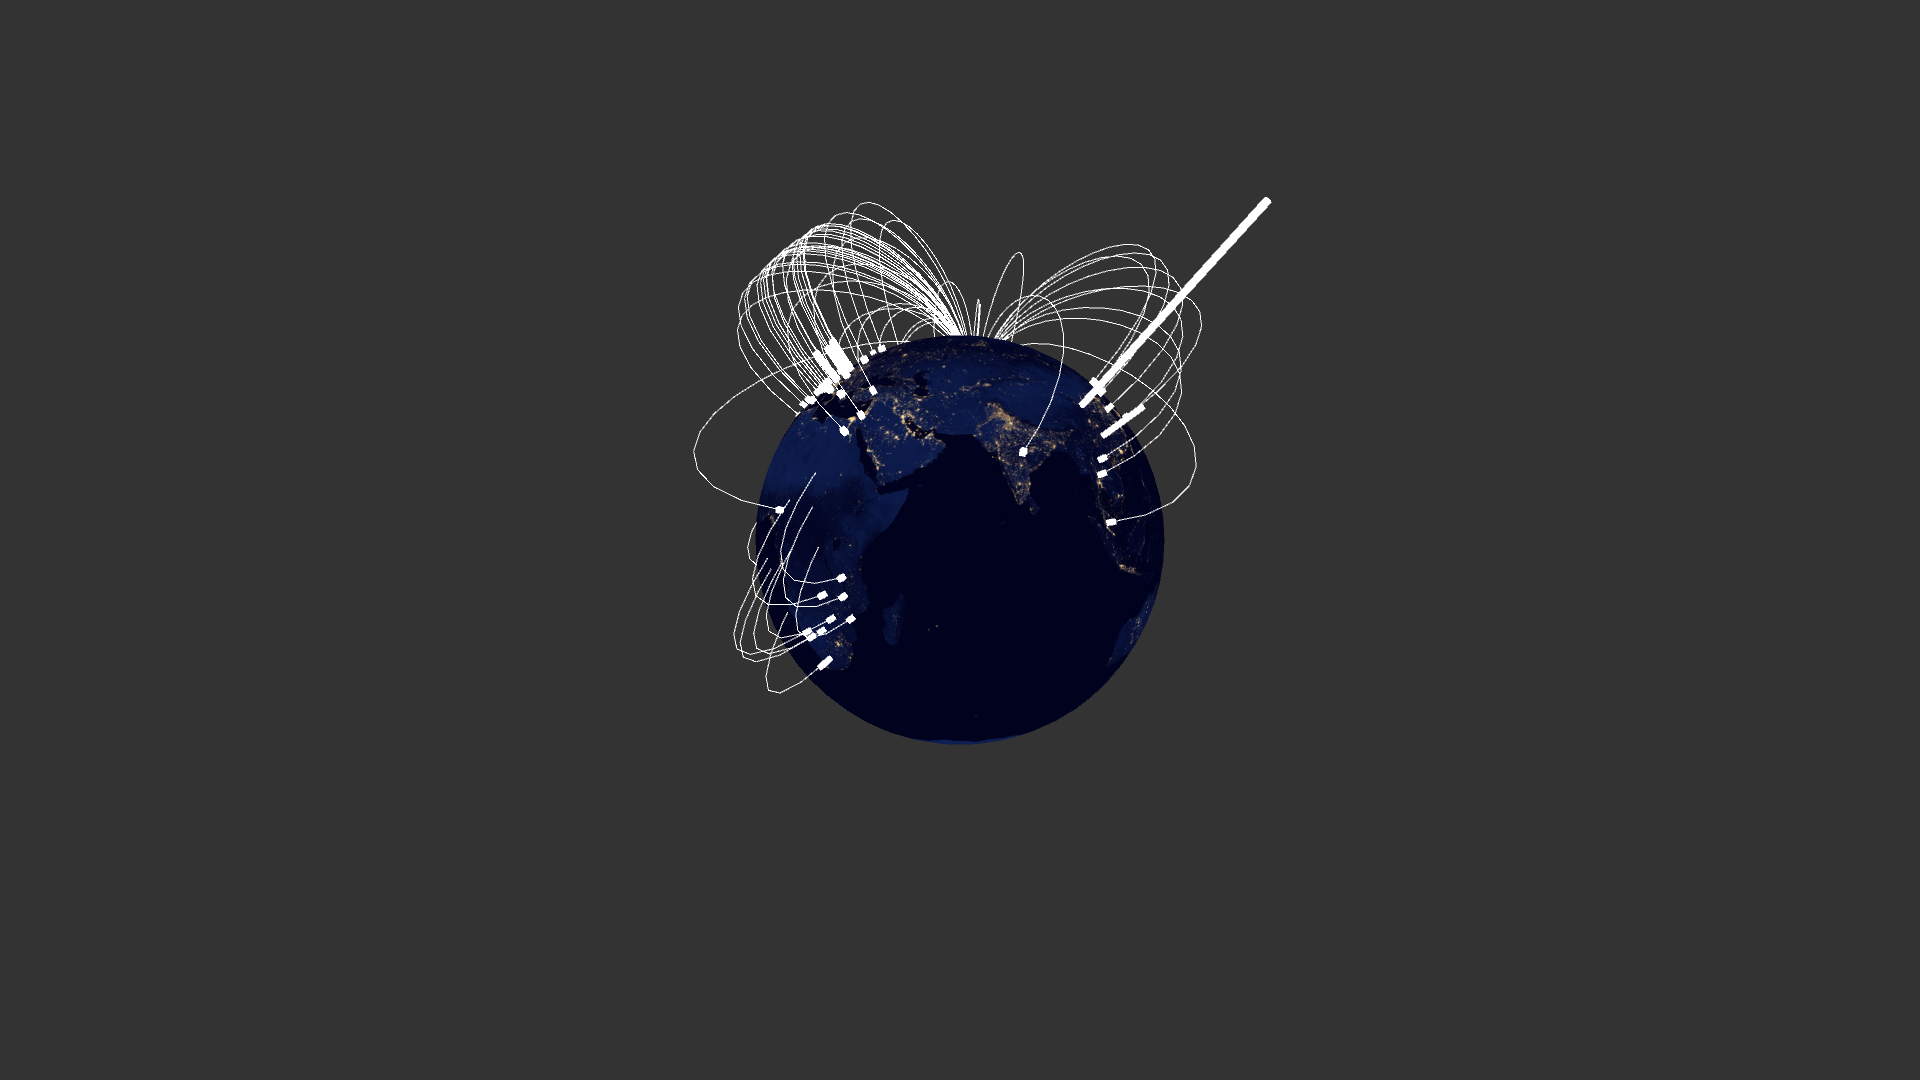
The geocoded results were then read into a 3D space, and located on a sphere. These location mark the geographic region which a library item features. The location of these boxes was computationally demanding because the 3D processing environment directs the Z axis toward the processing screen, whereas other cartesian transform algorithm we find online: x/y horizontal, z vertical. An alternative transformation algorithm was applied to display the correct latitude and longitude for all locations.
From the locations of boxes I used a method of extruding the boxes to symbolise the number of checkouts each book had. This was done by using the angle between the x axis and the location vectors for all locations and multiplying by the cross positions of the location vectors from the x axis.
I also wanted to visualise the flows of knowledge and history of these locations being fed into SPL. This involved using the Bezier function to simulate ta link between each location and the SPL.
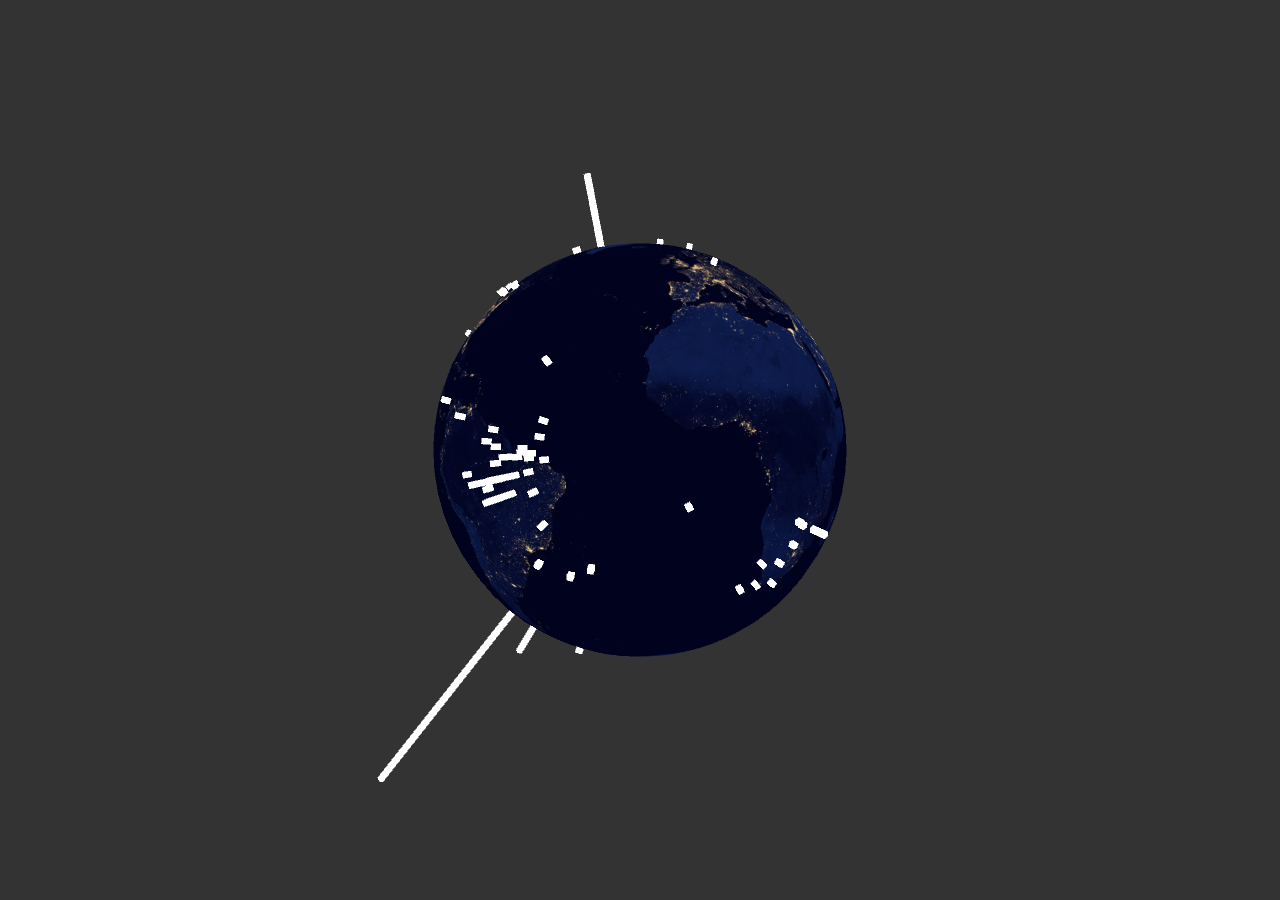
Final result
Overall, this project allowed by to explore how multi-dimensional data can occupy and inform 3D space. I have learnt how to reduce runtime by including more of my code in the setup() function and how to implement technically difficult geometric transformations into processing.
Code