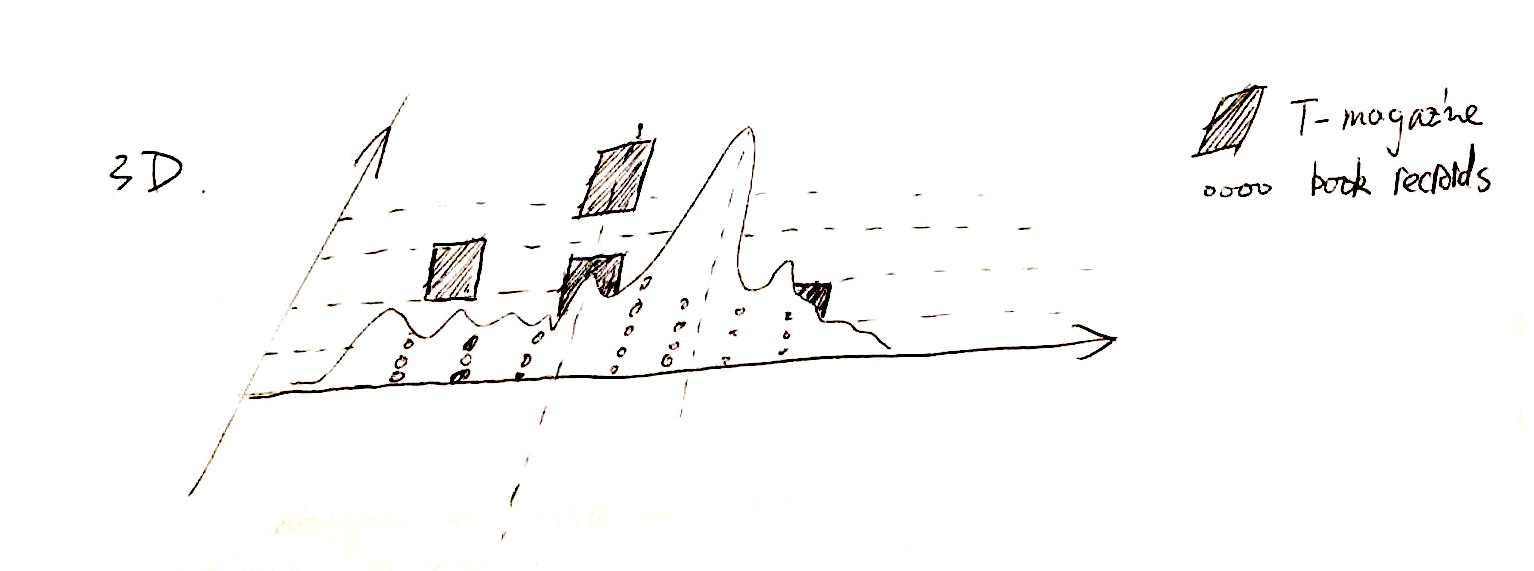
Based on the 2D version of Trump's campaign, I converted the information on a flat surface to be shown on two surfaces and extended to three viewing angles to cover all four sections.
Since the theory is based on Seattle Public Library's checking records, now all three other sources of information - Google Trend, Campaign Events (including major events one year in office) and Time magazine covers, can be compared with the library's bar graph (which will be placed by more creative representation in the future).
     SELECT
         Title, COUNT(bibNumber) AS Counts, bibNumber, Itemtype
     FROM
         spl_2016.inraw
     WHERE
         title = 'Trump The Art of the Deal'
             OR title = 'Trump Think Like a Billionaire'
             OR title = 'Youve Been Trumped'
     GROUP BY title , bibNumber , itemtype
     ORDER BY Counts DESC
     LIMIT 1000
The modified query combines different bibNumbers of the same title into one entry. Referenced the monthly analysis code from Rodger Luo's Blade Runner report, the data exported as a .cvs file from MySQL for further processing.
     SELECT
     Title,
     COUNT(title) AS Counts,
     SUM(CASE
         WHEN (YEAR(cout) = 2015 AND MONTH(cout) = 1) THEN 1
         ELSE 0
     END) AS '2015-1',
     SUM(CASE
         WHEN (YEAR(cout) = 2015 AND MONTH(cout) = 2) THEN 1
         ELSE 0
     END) AS '2015-2',
     SUM(CASE
         WHEN (YEAR(cout) = 2015 AND MONTH(cout) = 3) THEN 1
         ELSE 0
     END) AS '2015-3',
     SUM(CASE
         WHEN (YEAR(cout) = 2015 AND MONTH(cout) = 4) THEN 1
         ELSE 0
     END) AS '2015-4',
     SUM(CASE
         WHEN (YEAR(cout) = 2015 AND MONTH(cout) = 5) THEN 1
         ELSE 0
     END) AS '2015-5',
     SUM(CASE
         WHEN (YEAR(cout) = 2015 AND MONTH(cout) = 6) THEN 1
         ELSE 0
     END) AS '2015-6',
     SUM(CASE
         WHEN (YEAR(cout) = 2015 AND MONTH(cout) = 7) THEN 1
         ELSE 0
     END) AS '2015-7',
     SUM(CASE
         WHEN (YEAR(cout) = 2015 AND MONTH(cout) = 8) THEN 1
         ELSE 0
     END) AS '2015-8',
     SUM(CASE
         WHEN (YEAR(cout) = 2015 AND MONTH(cout) = 9) THEN 1
         ELSE 0
     END) AS '2015-9',
     SUM(CASE
         WHEN (YEAR(cout) = 2015 AND MONTH(cout) = 10) THEN 1
         ELSE 0
     END) AS '2015-10',
     SUM(CASE
         WHEN (YEAR(cout) = 2015 AND MONTH(cout) = 11) THEN 1
         ELSE 0
     END) AS '2015-11',
     SUM(CASE
         WHEN (YEAR(cout) = 2015 AND MONTH(cout) = 12) THEN 1
         ELSE 0
     END) AS '2015-12',
     SUM(CASE
         WHEN (YEAR(cout) = 2016 AND MONTH(cout) = 1) THEN 1
         ELSE 0
     END) AS '2016-1',
     SUM(CASE
         WHEN (YEAR(cout) = 2016 AND MONTH(cout) = 2) THEN 1
         ELSE 0
     END) AS '2016-2',
     SUM(CASE
         WHEN (YEAR(cout) = 2016 AND MONTH(cout) = 3) THEN 1
         ELSE 0
     END) AS '2016-3',
     SUM(CASE
         WHEN (YEAR(cout) = 2016 AND MONTH(cout) = 4) THEN 1
         ELSE 0
     END) AS '2016-4',
     SUM(CASE
         WHEN (YEAR(cout) = 2016 AND MONTH(cout) = 5) THEN 1
         ELSE 0
     END) AS '2016-5',
     SUM(CASE
         WHEN (YEAR(cout) = 2016 AND MONTH(cout) = 6) THEN 1
         ELSE 0
     END) AS '2016-6',
     SUM(CASE
         WHEN (YEAR(cout) = 2016 AND MONTH(cout) = 7) THEN 1
         ELSE 0
     END) AS '2016-7',
     SUM(CASE
         WHEN (YEAR(cout) = 2016 AND MONTH(cout) = 8) THEN 1
         ELSE 0
     END) AS '2016-8',
     SUM(CASE
         WHEN (YEAR(cout) = 2016 AND MONTH(cout) = 9) THEN 1
         ELSE 0
     END) AS '2016-9',
     SUM(CASE
         WHEN (YEAR(cout) = 2016 AND MONTH(cout) = 10) THEN 1
         ELSE 0
     END) AS '2016-10',
     SUM(CASE
         WHEN (YEAR(cout) = 2016 AND MONTH(cout) = 11) THEN 1
         ELSE 0
     END) AS '2016-11',
     SUM(CASE
         WHEN (YEAR(cout) = 2016 AND MONTH(cout) = 12) THEN 1
         ELSE 0
     END) AS '2016-12',
     SUM(CASE
         WHEN (YEAR(cout) = 2017 AND MONTH(cout) = 1) THEN 1
         ELSE 0
     END) AS '2017-1',
     SUM(CASE
         WHEN (YEAR(cout) = 2017 AND MONTH(cout) = 2) THEN 1
         ELSE 0
     END) AS '2017-2',
     SUM(CASE
         WHEN (YEAR(cout) = 2017 AND MONTH(cout) = 3) THEN 1
         ELSE 0
     END) AS '2017-3',
     SUM(CASE
         WHEN (YEAR(cout) = 2017 AND MONTH(cout) = 4) THEN 1
         ELSE 0
     END) AS '2017-4',
     SUM(CASE
         WHEN (YEAR(cout) = 2017 AND MONTH(cout) = 5) THEN 1
         ELSE 0
     END) AS '2017-5',
     SUM(CASE
         WHEN (YEAR(cout) = 2017 AND MONTH(cout) = 6) THEN 1
         ELSE 0
     END) AS '2017-6',
     SUM(CASE
         WHEN (YEAR(cout) = 2017 AND MONTH(cout) = 7) THEN 1
         ELSE 0
     END) AS '2017-7',
     SUM(CASE
         WHEN (YEAR(cout) = 2017 AND MONTH(cout) = 8) THEN 1
         ELSE 0
     END) AS '2017-8',
     SUM(CASE
         WHEN (YEAR(cout) = 2017 AND MONTH(cout) = 9) THEN 1
         ELSE 0
     END) AS '2017-9',
     SUM(CASE
         WHEN (YEAR(cout) = 2017 AND MONTH(cout) = 10) THEN 1
         ELSE 0
     END) AS '2017-10',
     SUM(CASE
         WHEN (YEAR(cout) = 2017 AND MONTH(cout) = 11) THEN 1
         ELSE 0
     END) AS '2017-11',
     SUM(CASE
         WHEN (YEAR(cout) = 2017 AND MONTH(cout) = 12) THEN 1
         ELSE 0
     END) AS '2017-12'
                    FROM
     spl_2016.outraw
                    WHERE
     title = 'Trump The Art of the Deal'
         OR title = 'Trump Think Like a Billionaire'
         OR title = 'Youve Been Trumped'
                    GROUP BY title
                    ORDER BY Counts DESC
I tried different combinations of text, graph and picture, some have the text moving its angle with the mouse so the text is always on top of other content, which can be very confusing as user loose sense of the surfaces.
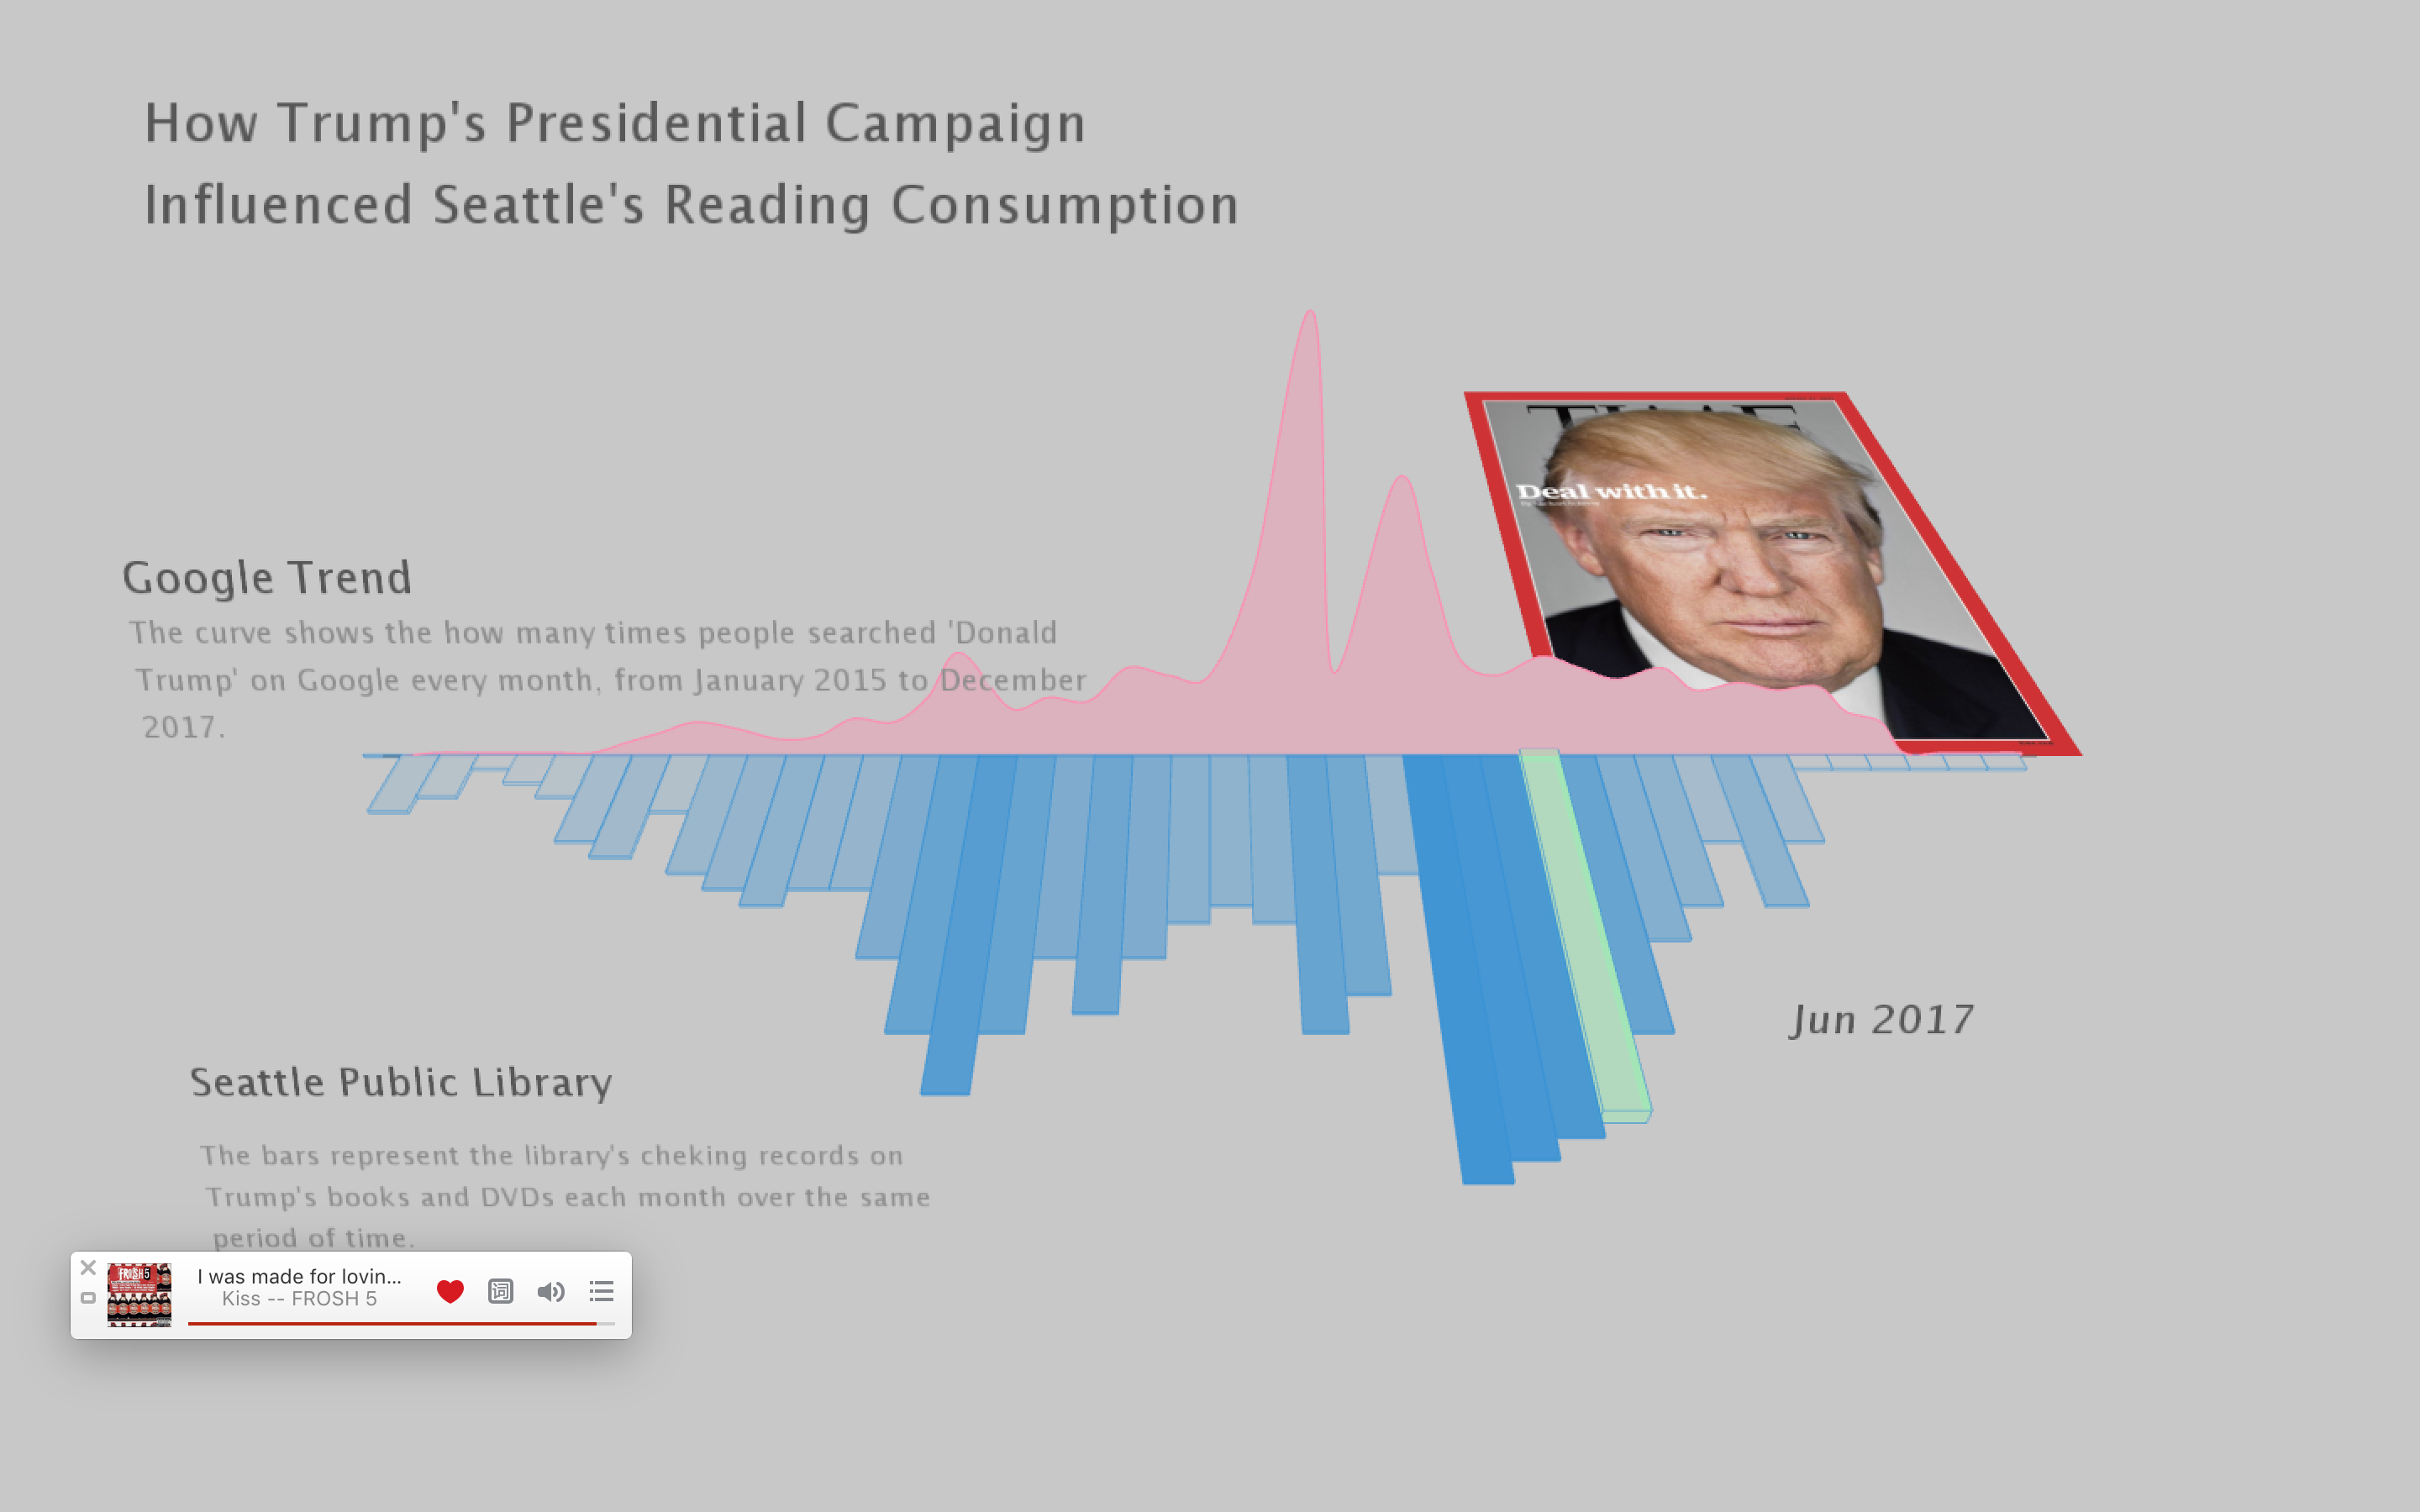
The app will start in this angle which looks just like the 2D version, but once the mouse is moved, the user will see the content actually extended to four direction in space.
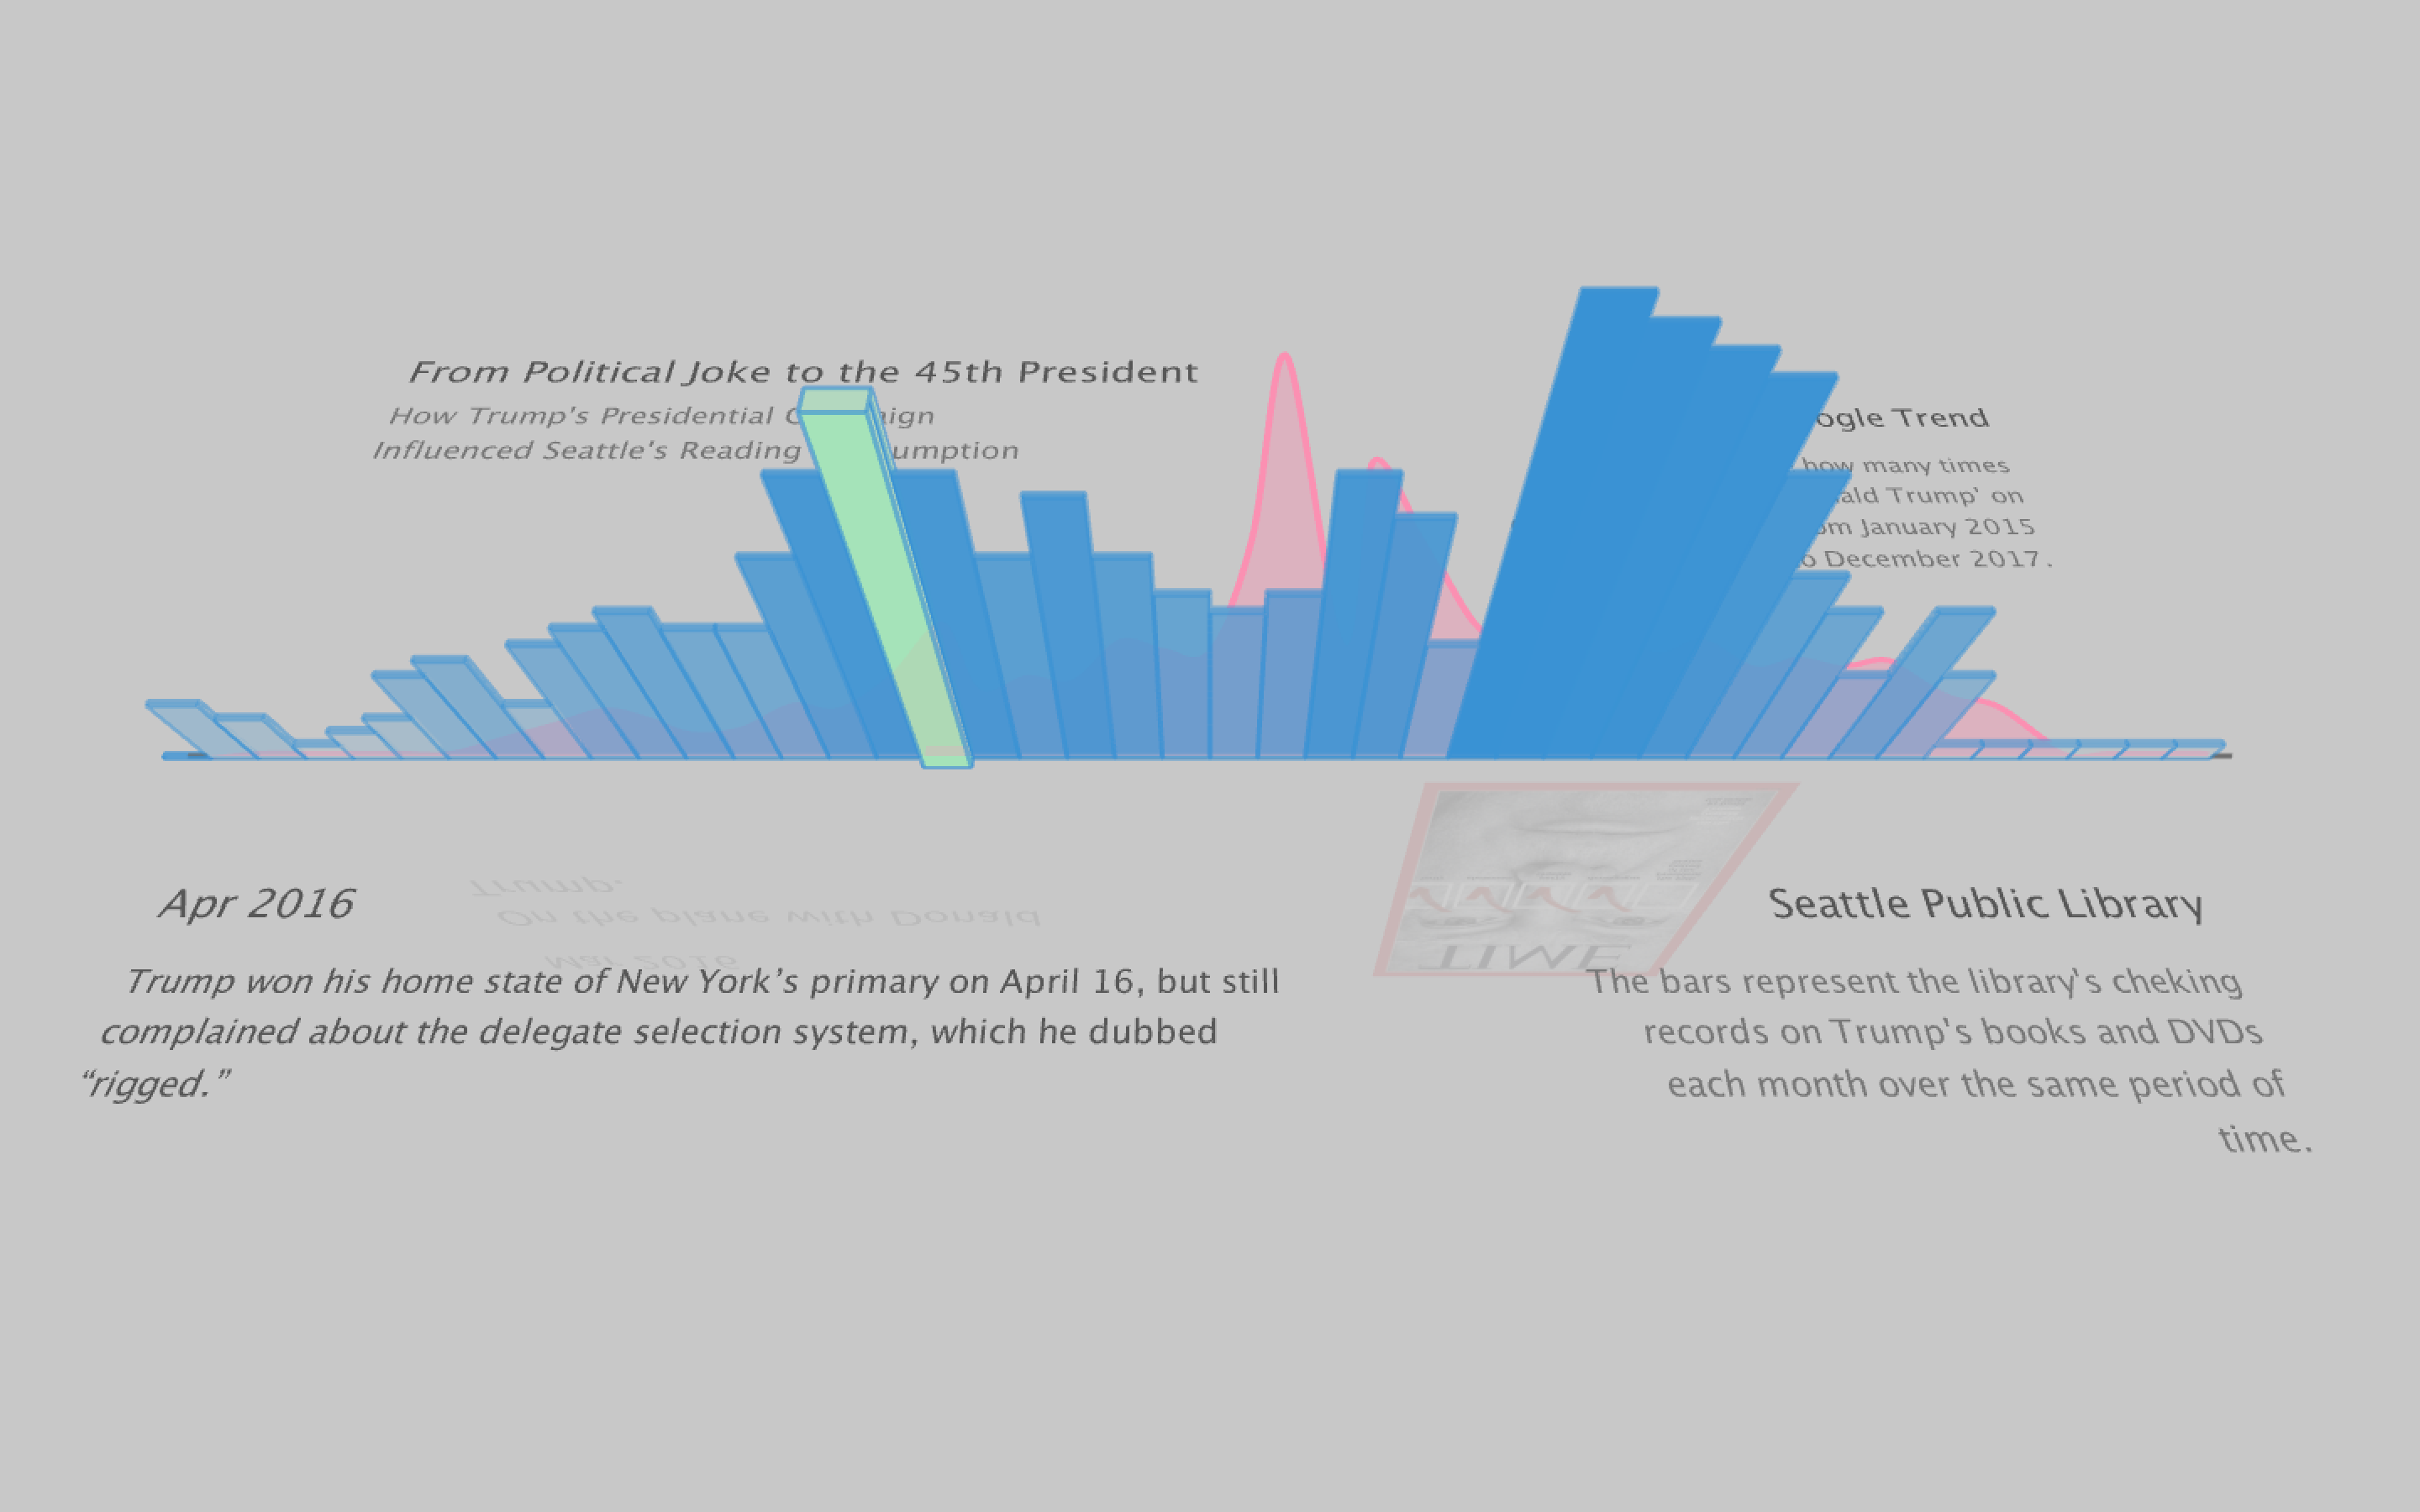
The lower angle view provides major events during the year long campaign, plus other tops stories during his one year in office. We can vaguely see some pictures floating behind, this might help guide the user to view from different angle.
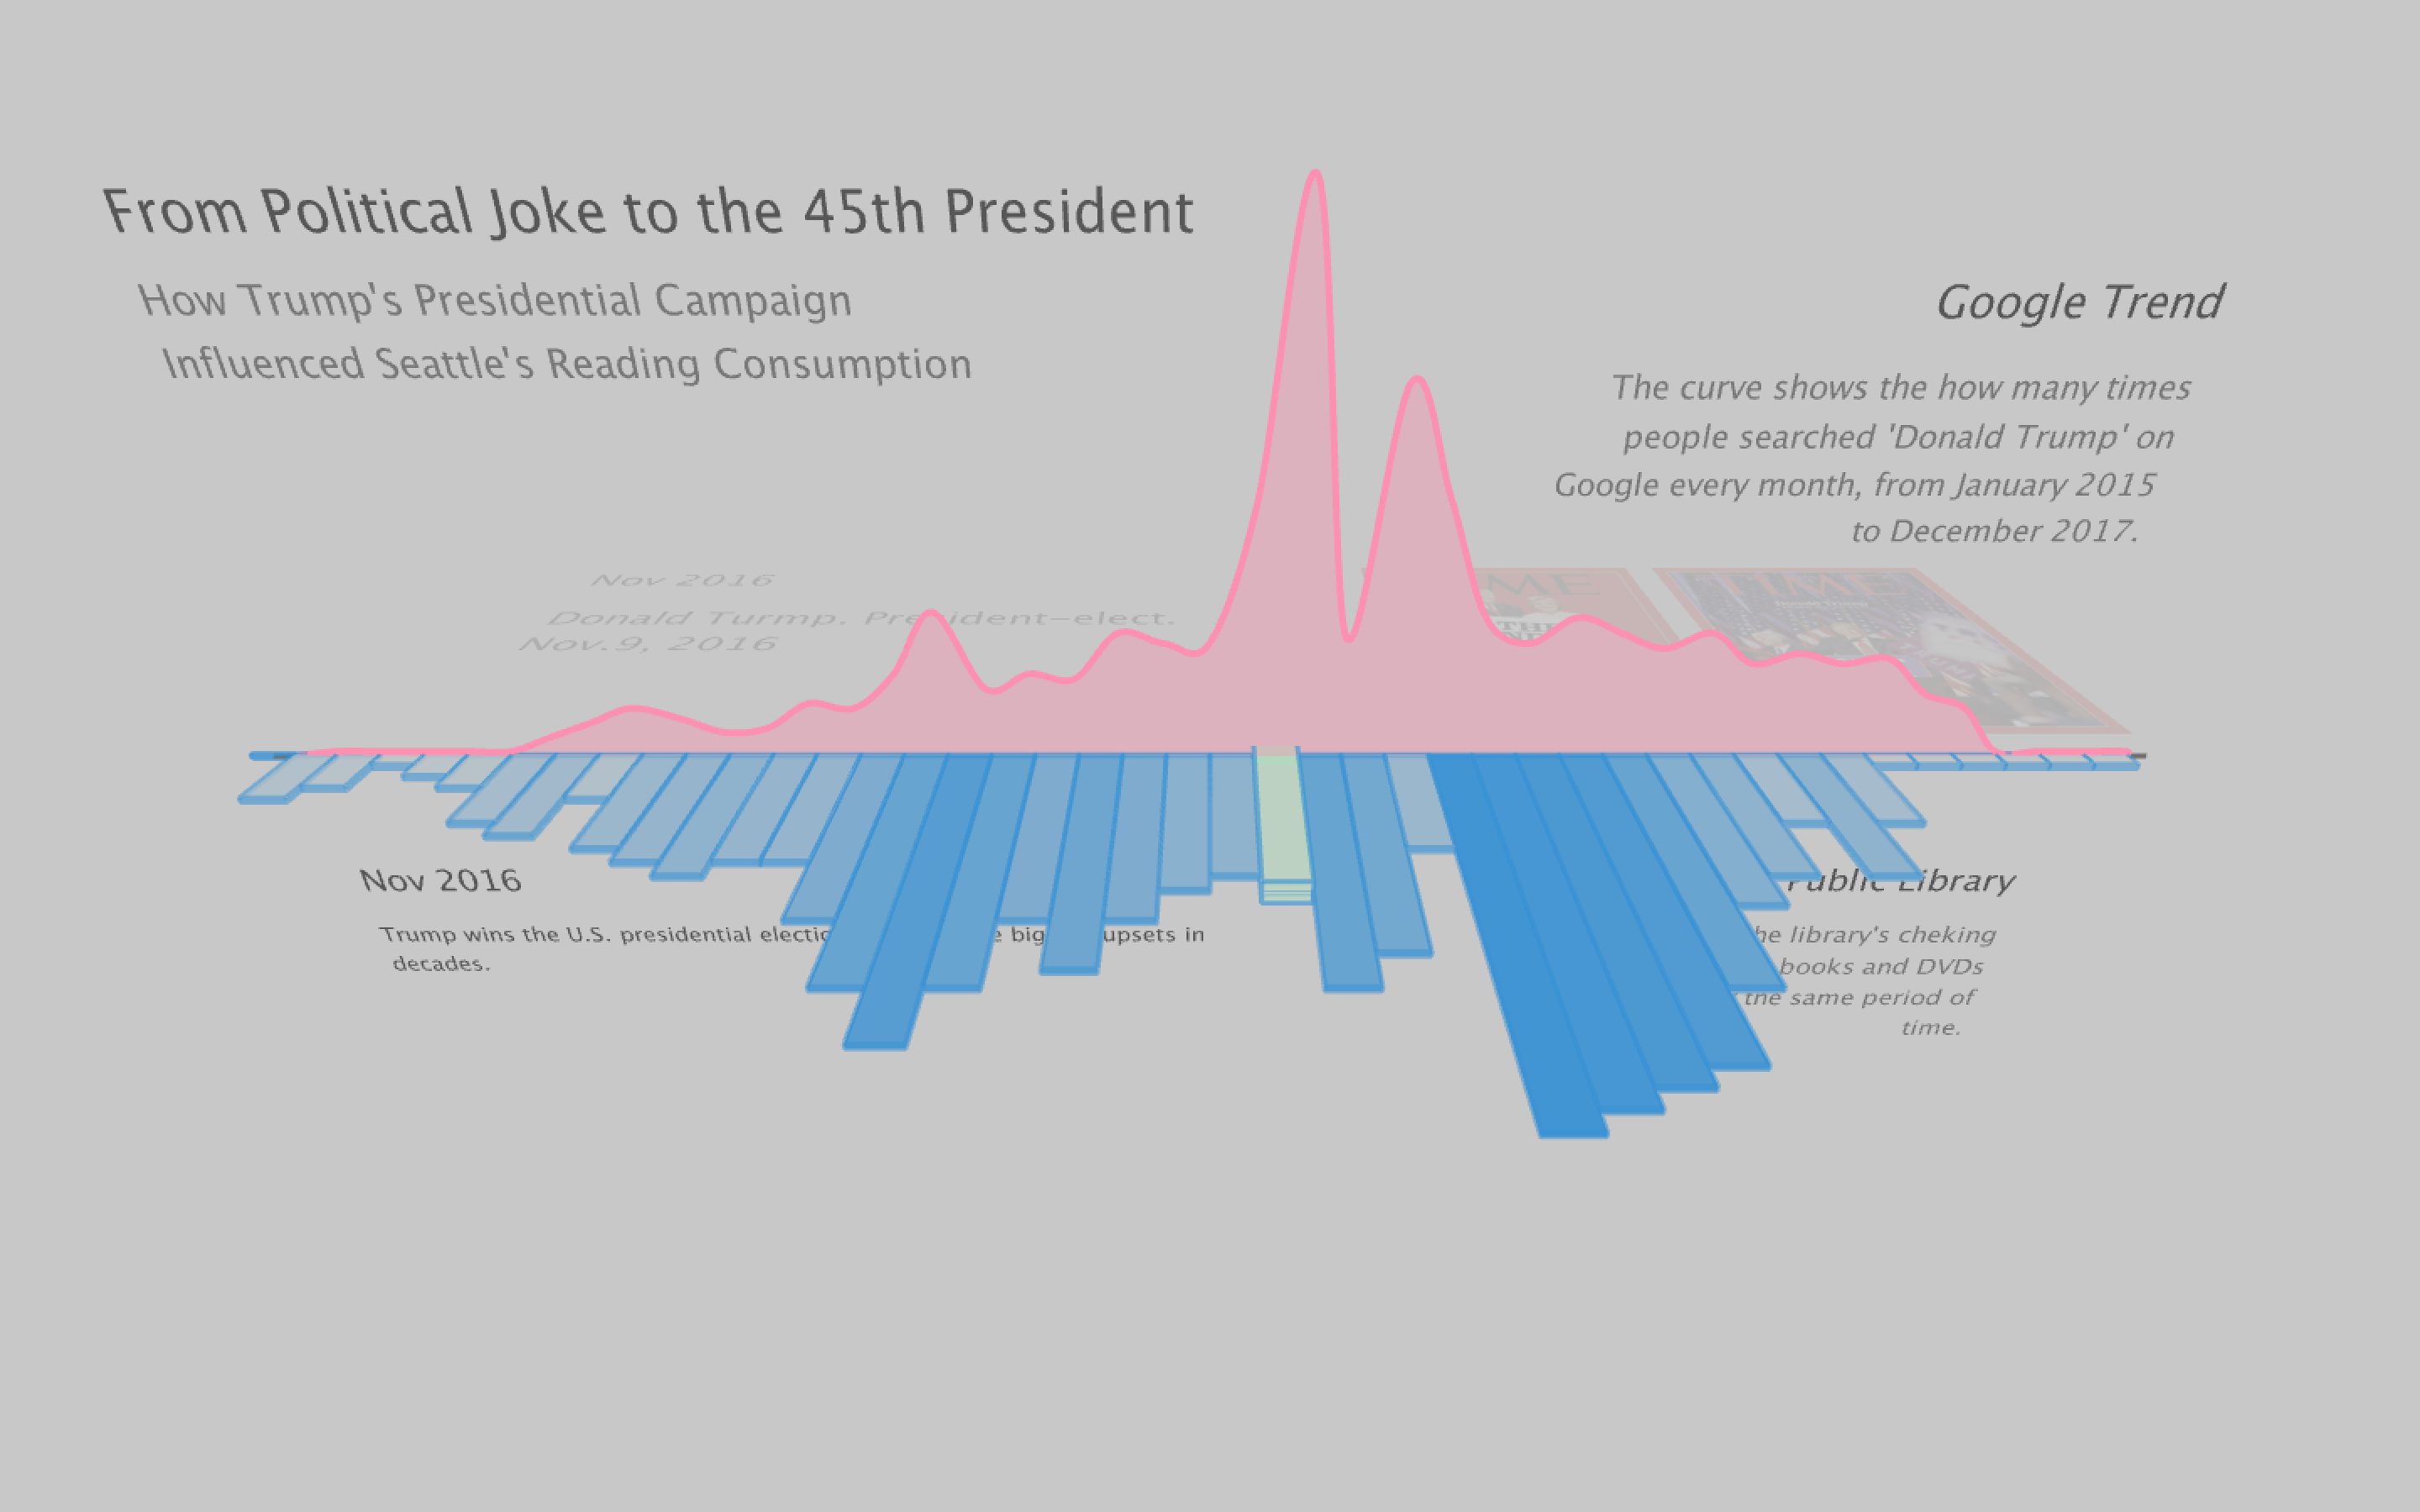
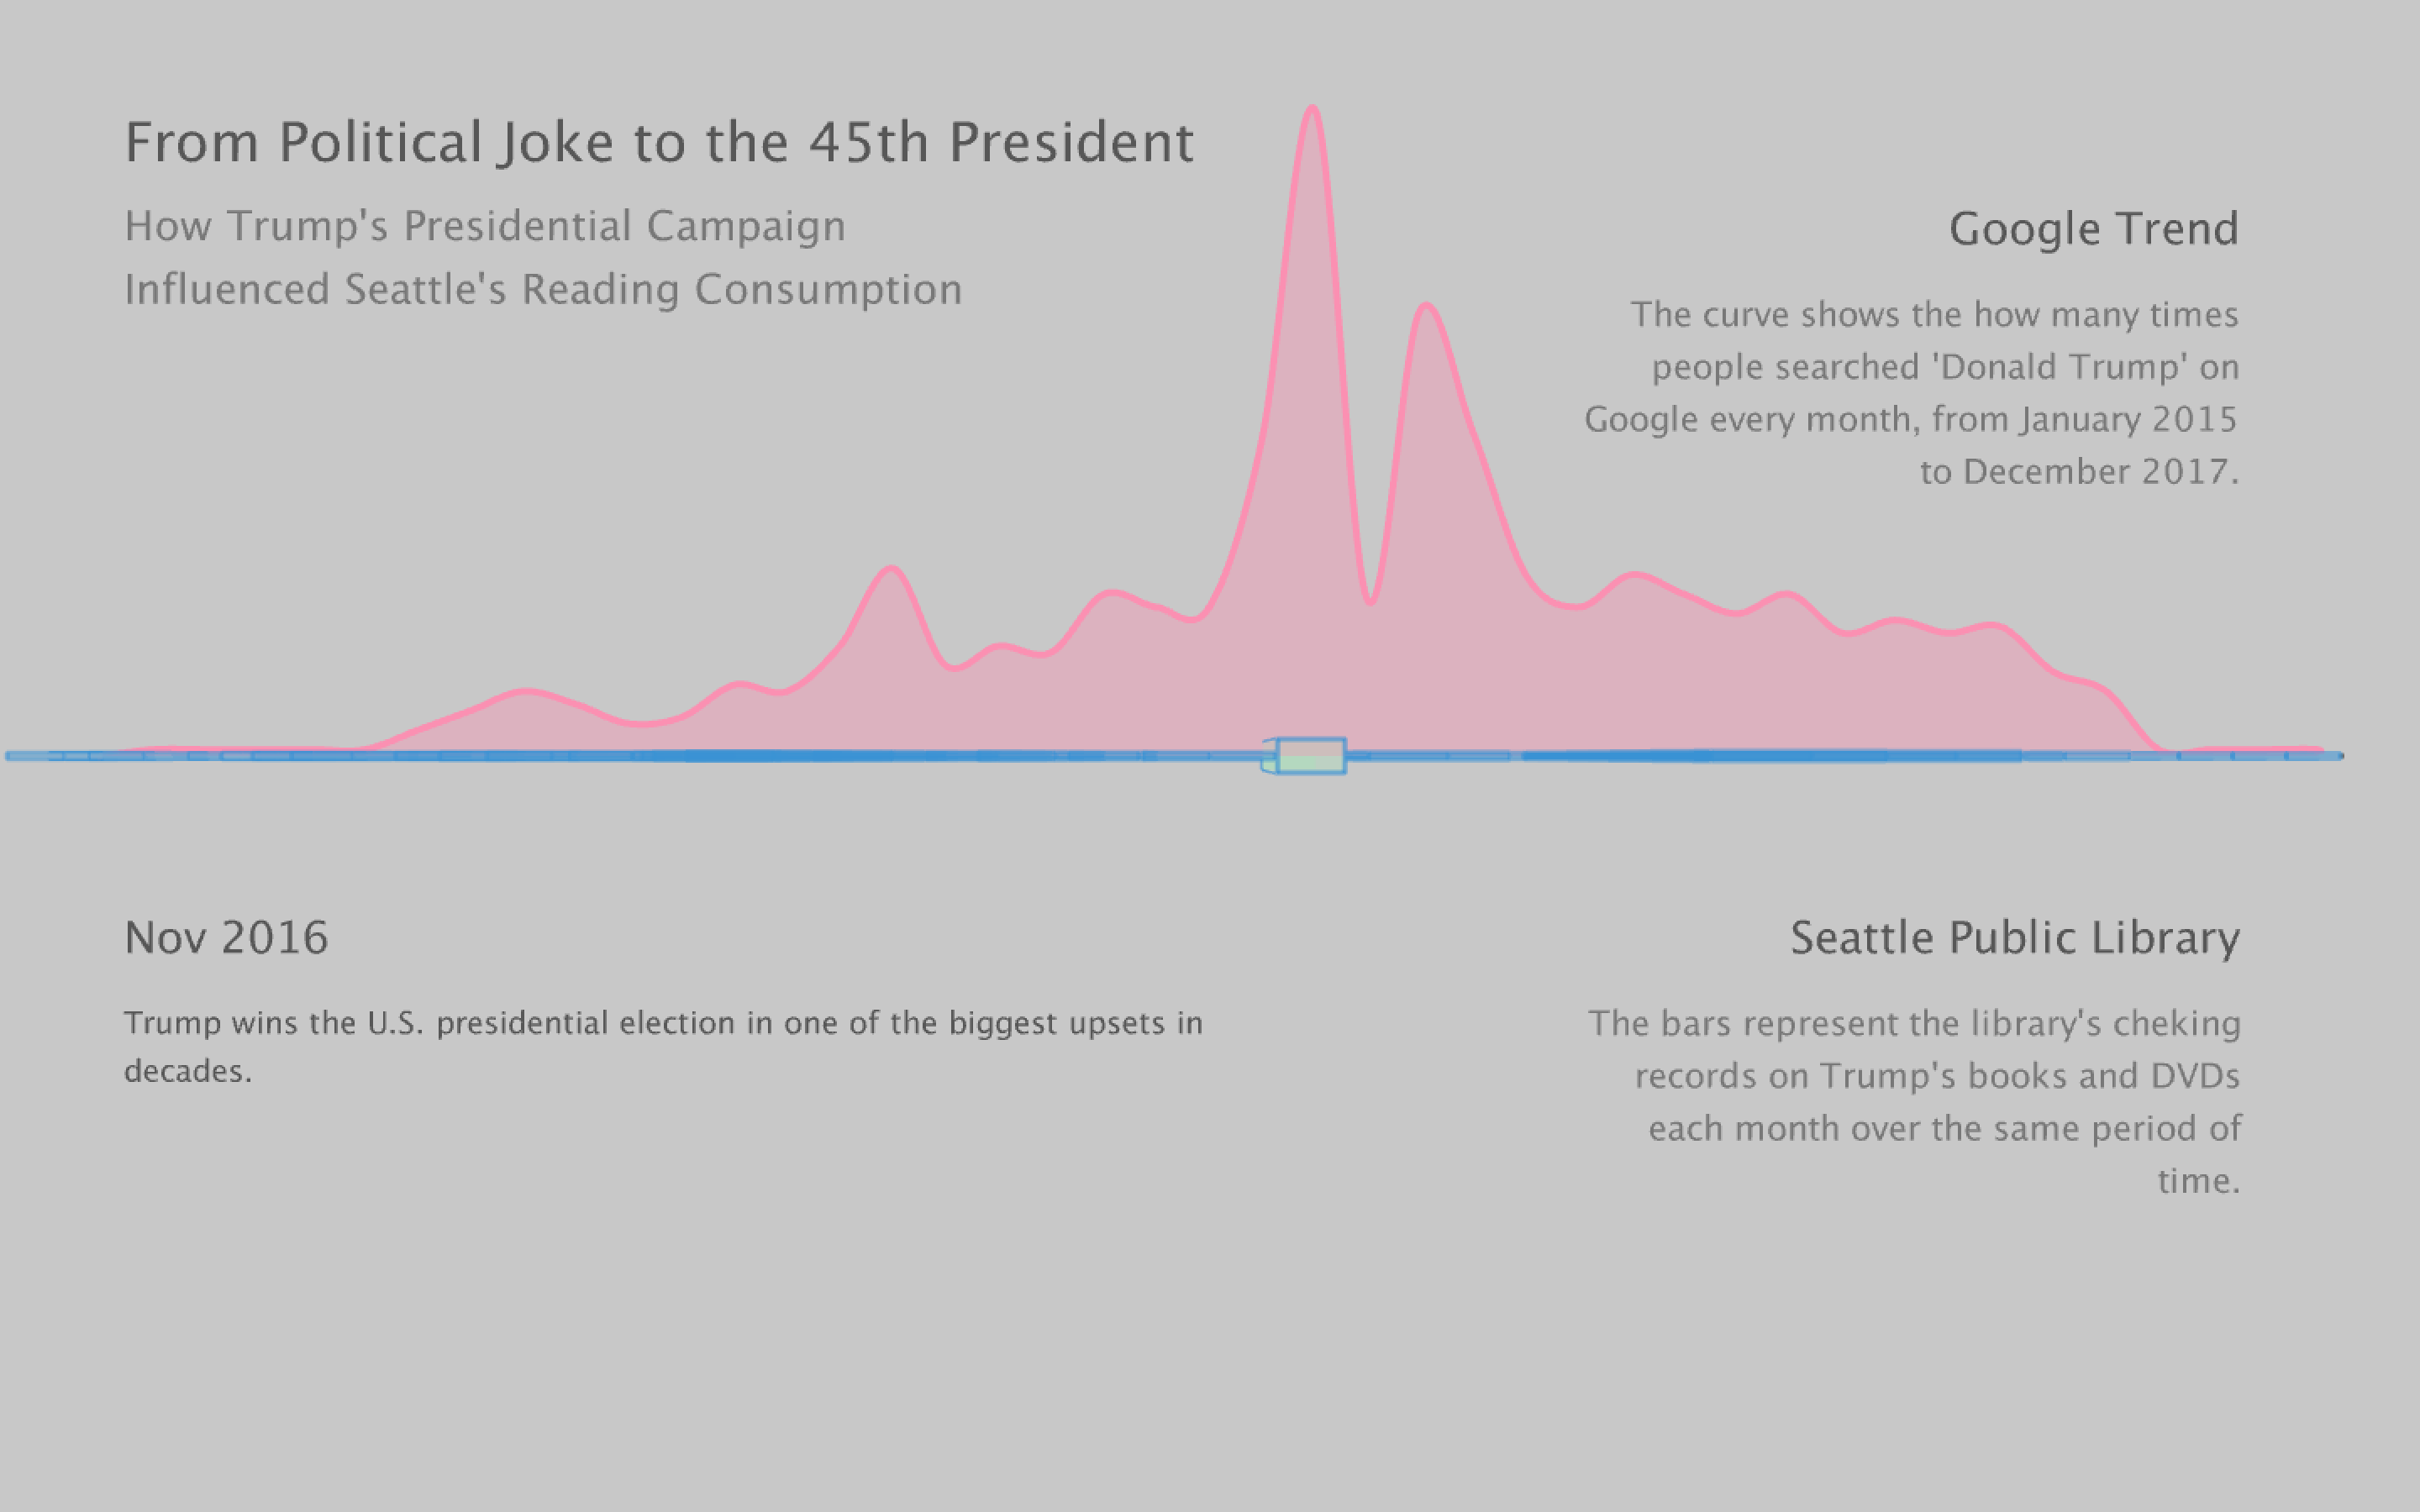
This overlooking angle provides a clear view of the entire structure. It shows how information from four different sources lies on two layers and extended into four directions. It's also the best view to see the correlation between Google Trend and Library records.
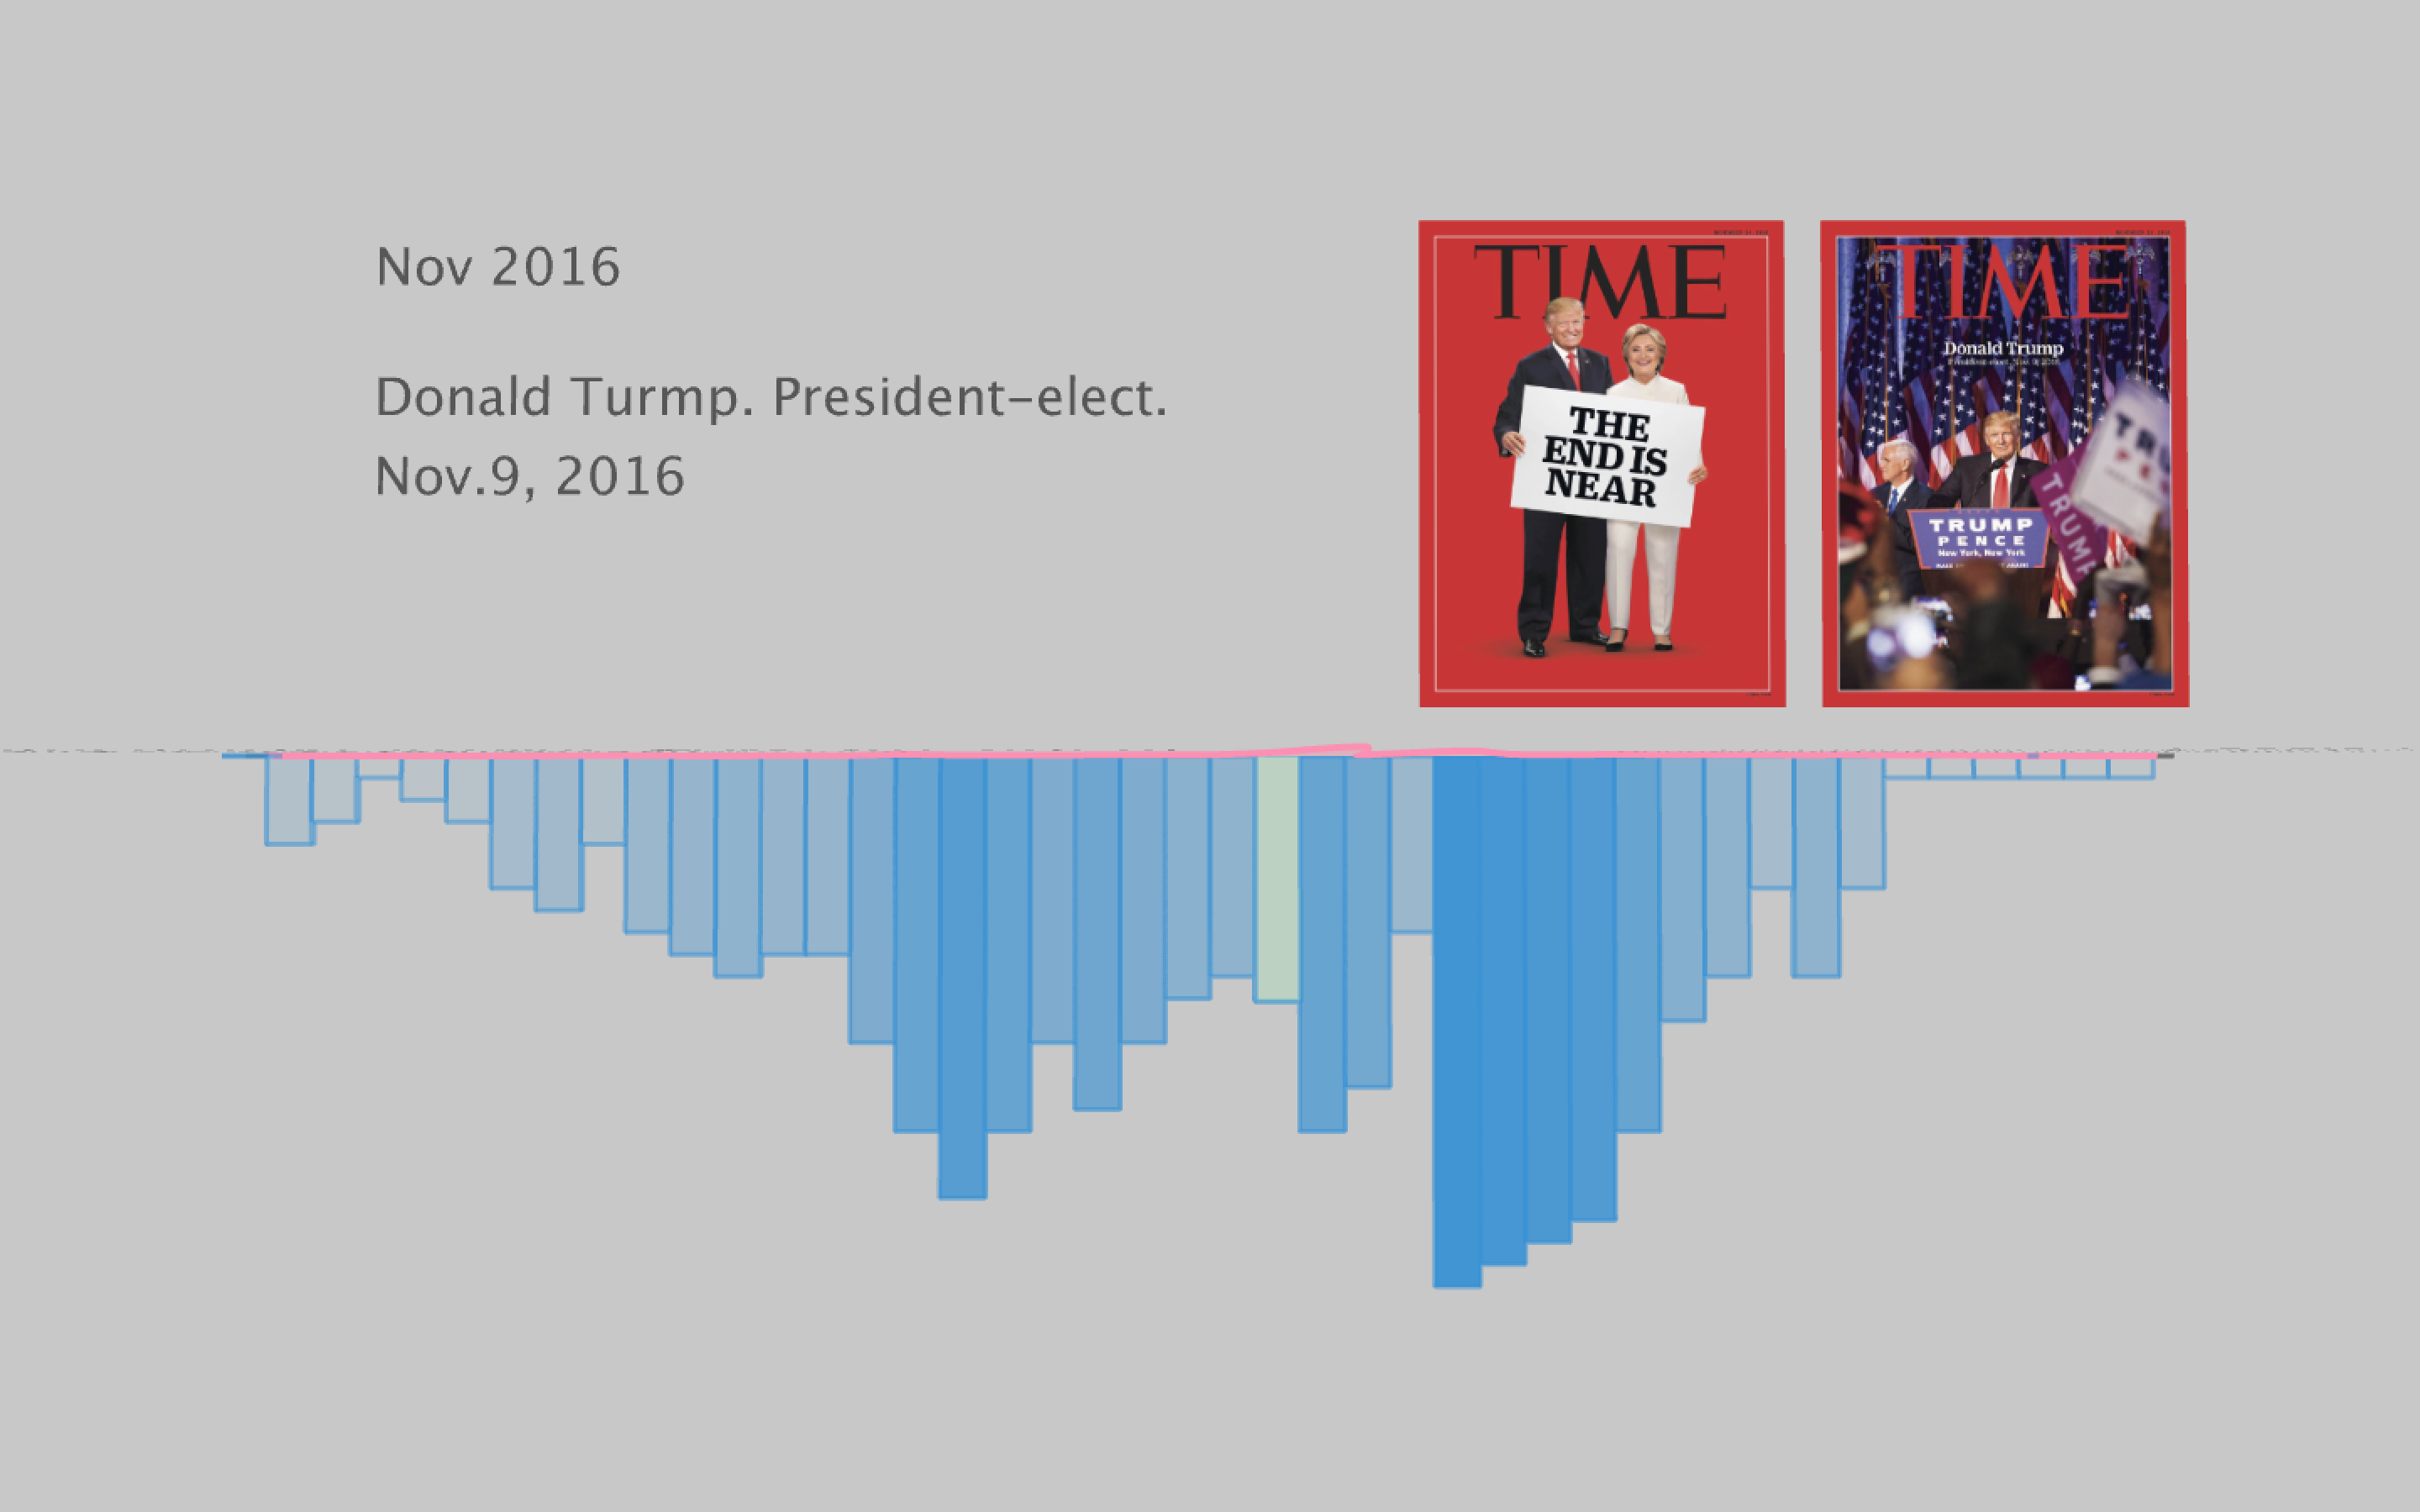
If the mouse moves higher the user will see from the top, where showed all the Time magazine covers that have Trump on it. To be seen on Time's cover is major, especially with such frequent appearance.
I found many projects using free-view mouse interaction often lead to confusion. The reason that I constrained the viewing angle is actually making the information easier to be shown. There is no learning curve since the user can only move the move in two directions, X and Y. So I designed three areas - the top 20% of the screen fix the viewing angle in the top view, the middle 30% fix the viewing angle in the overlook view and the bottom 20% fix the viewing angle in the lower angle. So that the user can move on the X axis stress free.
Updated Version
The original work was designed to be controlled with mouse, but I wanted to try a hand / motion based interactive for a visualization work. This seems to be a suitable case for its straightforward controls designs.
To achieve motion control through hand or body gesture, a motion detection method was applied in the background. A position calculated based on hand movement (or any body part) replaced the cursor position and achieved the camera control via hand / body movement as demoed in the video above.
All work is developed within Processing
Mouse Control Version: Source Code + Data
Motion Control Version: Source Code + Data