Dynamical Representation of Supply and Demand
MAT 259, 2018
Benson Li
Concept
For this project, I would like to map statistics from my dataset to the parameters of a physical system. The specific statistics are:
1. the current supply in the library of each "title" that I am considering
2. the time difference between when a specific book is checked into the library and when it is checked out again.
These values will be mapped respectively to:
1. The strength of a 1/r radial field.
2. the strength of a 1/r circulation field. also the color of the particles.
This field is what will dictate the motion of many particles, which will exist inside a box. Because the values of the current supply and time difference will change over time, the particles' motions will thus be governed by a time varying acceleration field.
To summarize, the behavior of the particles in relation to the supply and demand is roughly:
1. as supply goes up, the strength of the radial field increases and pulls the particles into the center, making the system more ordered.
2. as supply goes down, the radial strength decreases , so particles are able to explore a greater region of the cube. To emphasis this, I have added a springlike noise field.
3. as demand goes up, circulation goes up, and the system will move circulate faster. Note that I will be using an exponentially smoothed time_diffs, rather than a average or instantaneous one.
Query
SELECT
itemNumber, title, cout, cin
FROM
spl_2016.inraw
WHERE
(deweyClass< 5.121 AND deweyClass> 5.09)--> all same except (6.451,6.29) (4.671,4.59) (5.134,5.132)
ORDER BY itemNumber
The python script "times.py" takes the the csvs generated from the sql query and converts it into a time_diff and influx array for each title. The steps required to do so are:
1. shift checkin column down relative to checkout
2. calculate diff across the row
3. filter out negative time diffs and time diffs over 150(to prevent outliers from significantly affecting the data)
4. convert checkout and checkin time to relative position in an array
5. creates the influx array by adding +/- 1 to the influx array according to the relative position from step 4.
6. "hashes" the time _diffs from step 3 by inserting the time_diffs values into the array at the location specified by the value obtained in step4.
7. averages the time_diff array by dividing it by the influx_array elementwise
8. Along the way, also calculates max supply for each title,as well as a global max supply and global max/min time_diffs
Process
First, I created a particle system with flowfield with some noise, independent of the dataset
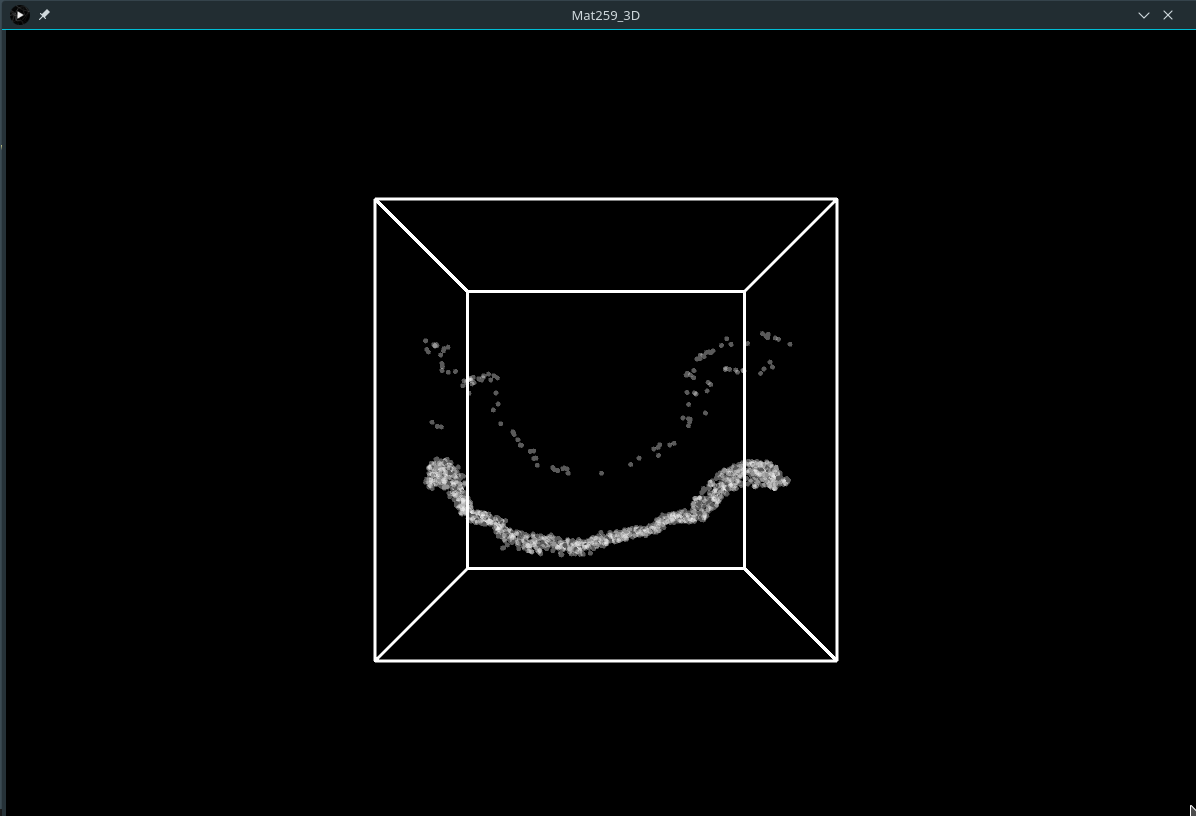
Then, I switched from a velocity flowfield to an acceleration one, with a max speed constraint on the particles.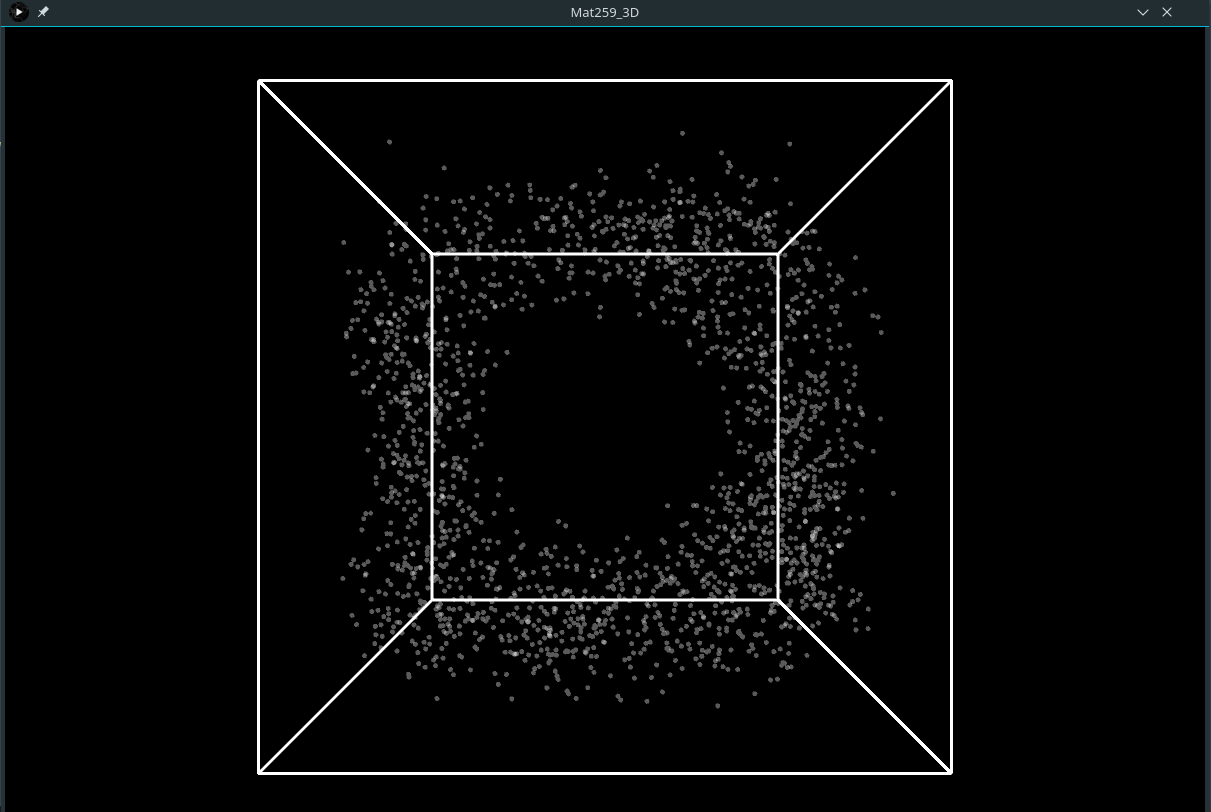
Then, I made the flowfield dependent on the data and create 4 systems for each of my titles/categories.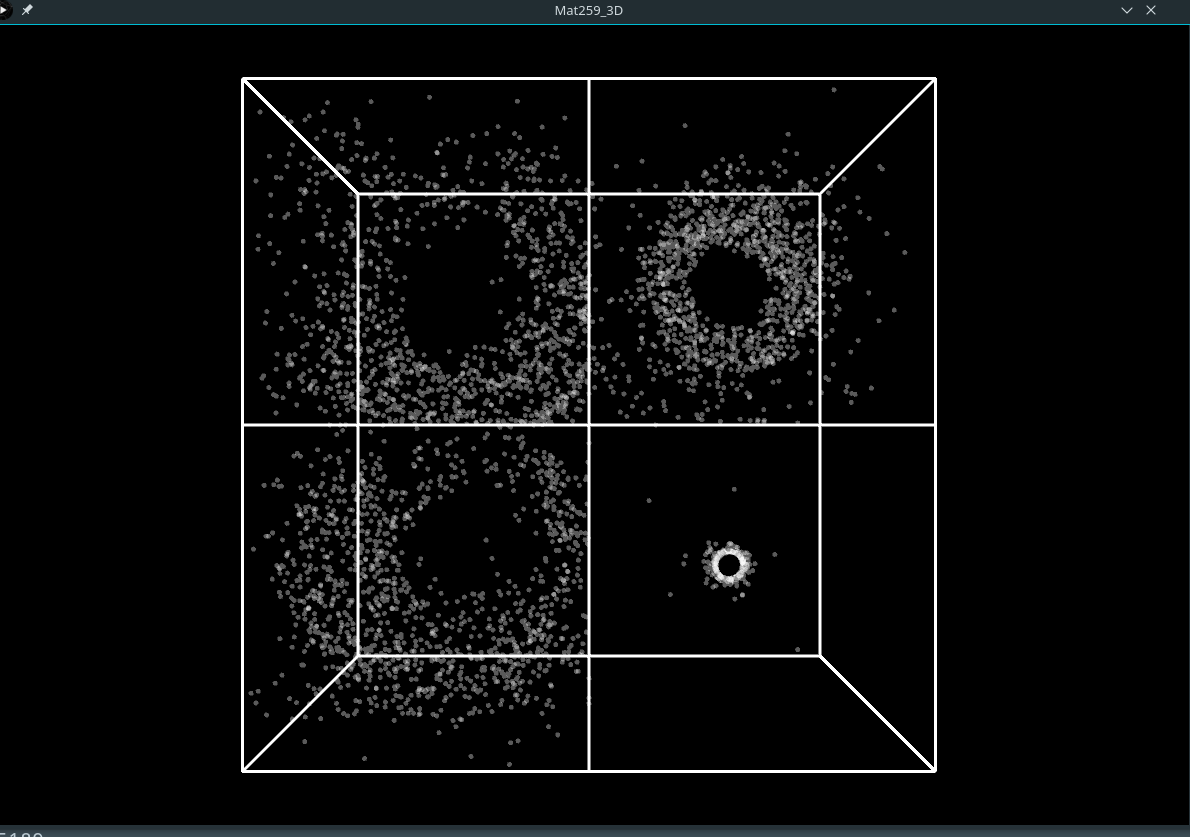
Began labeling and adding a user interface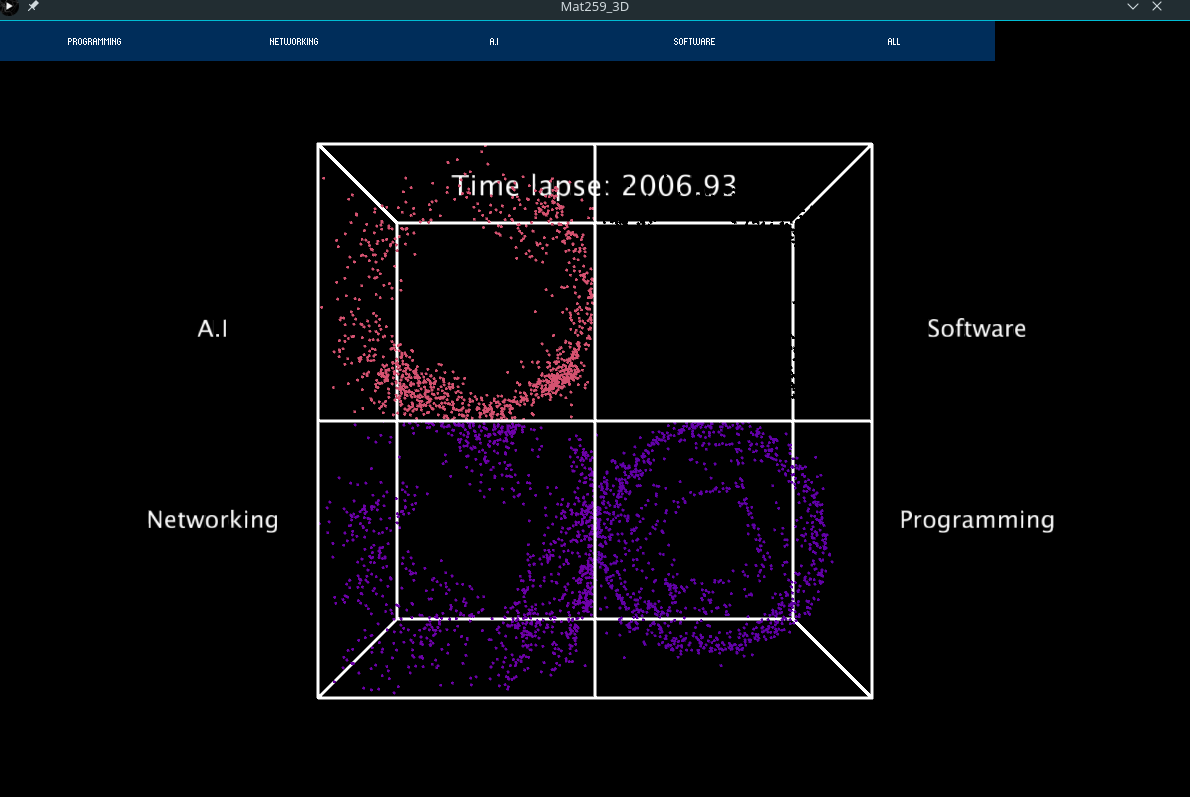
Then, I switched from a velocity flowfield to an acceleration one, with a max speed constraint on the particles.
Then, I made the flowfield dependent on the data and create 4 systems for each of my titles/categories.
Began labeling and adding a user interface
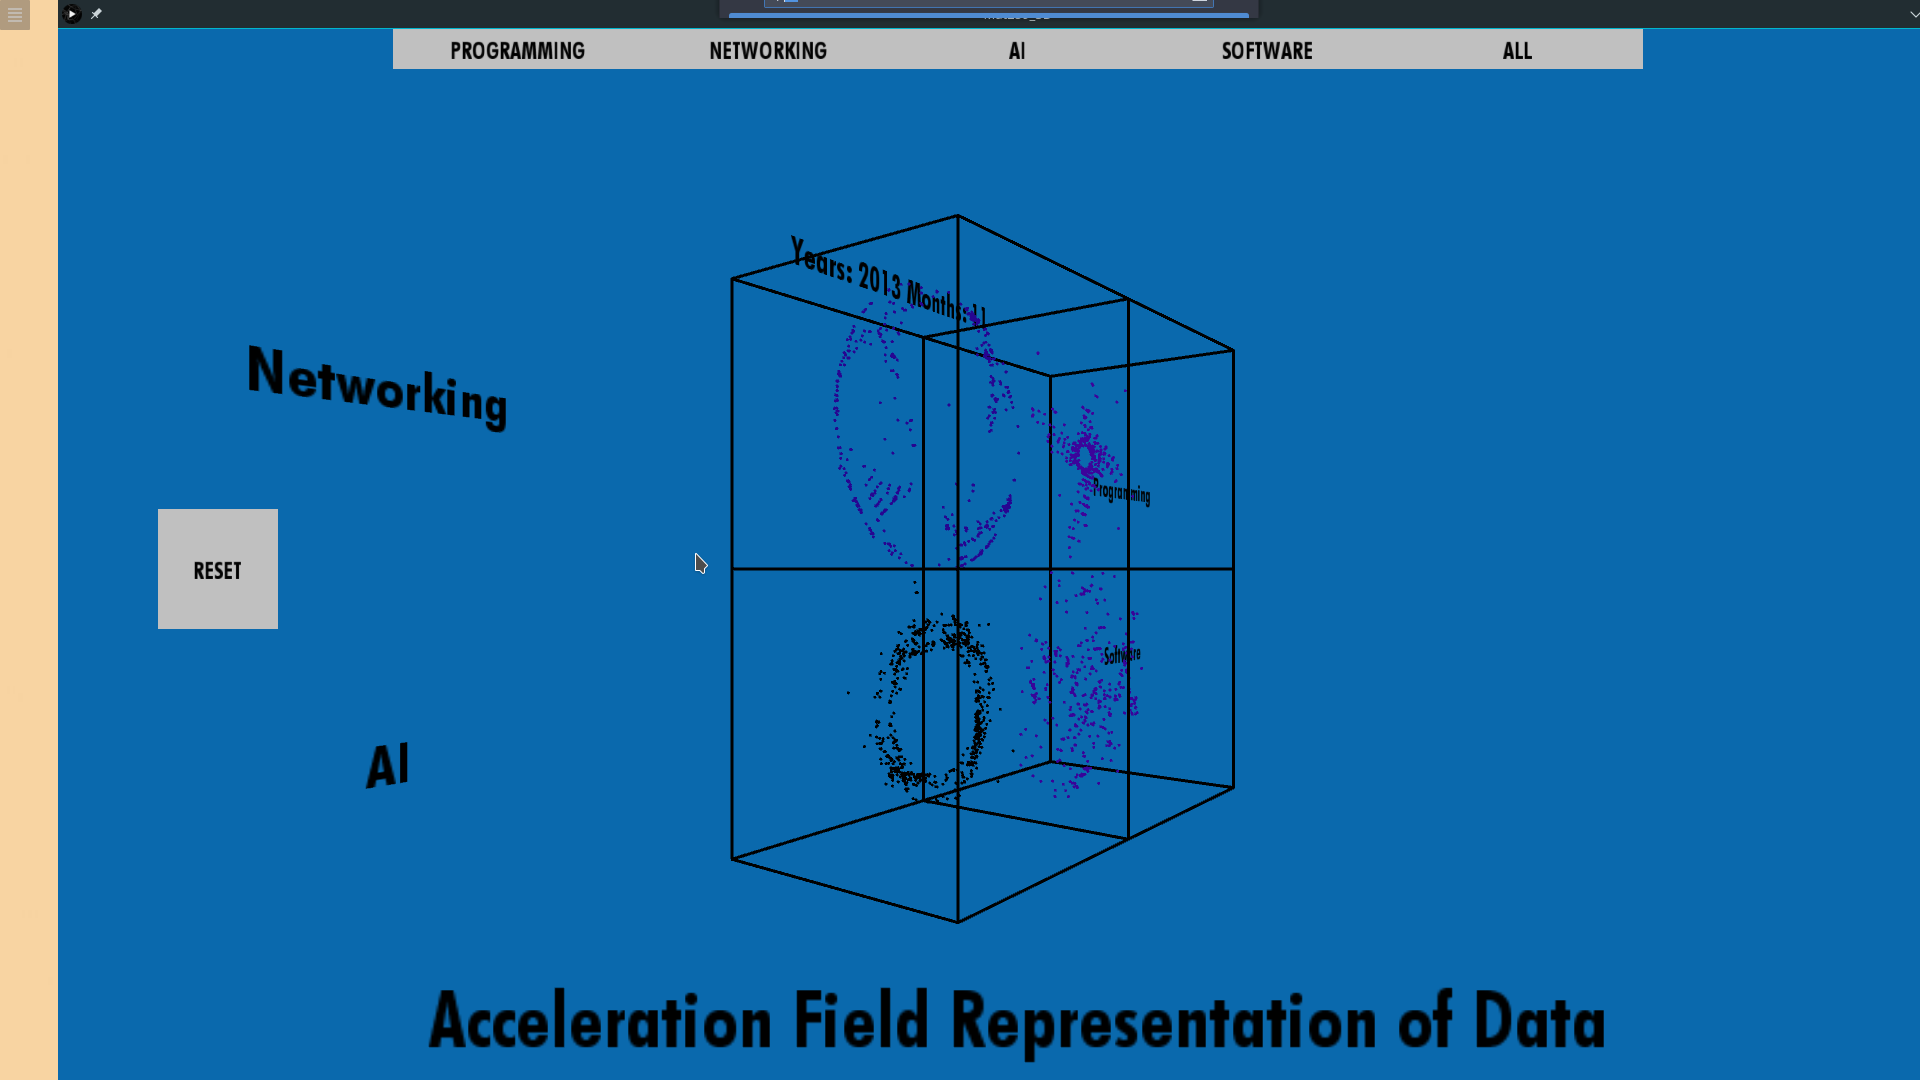
Final result
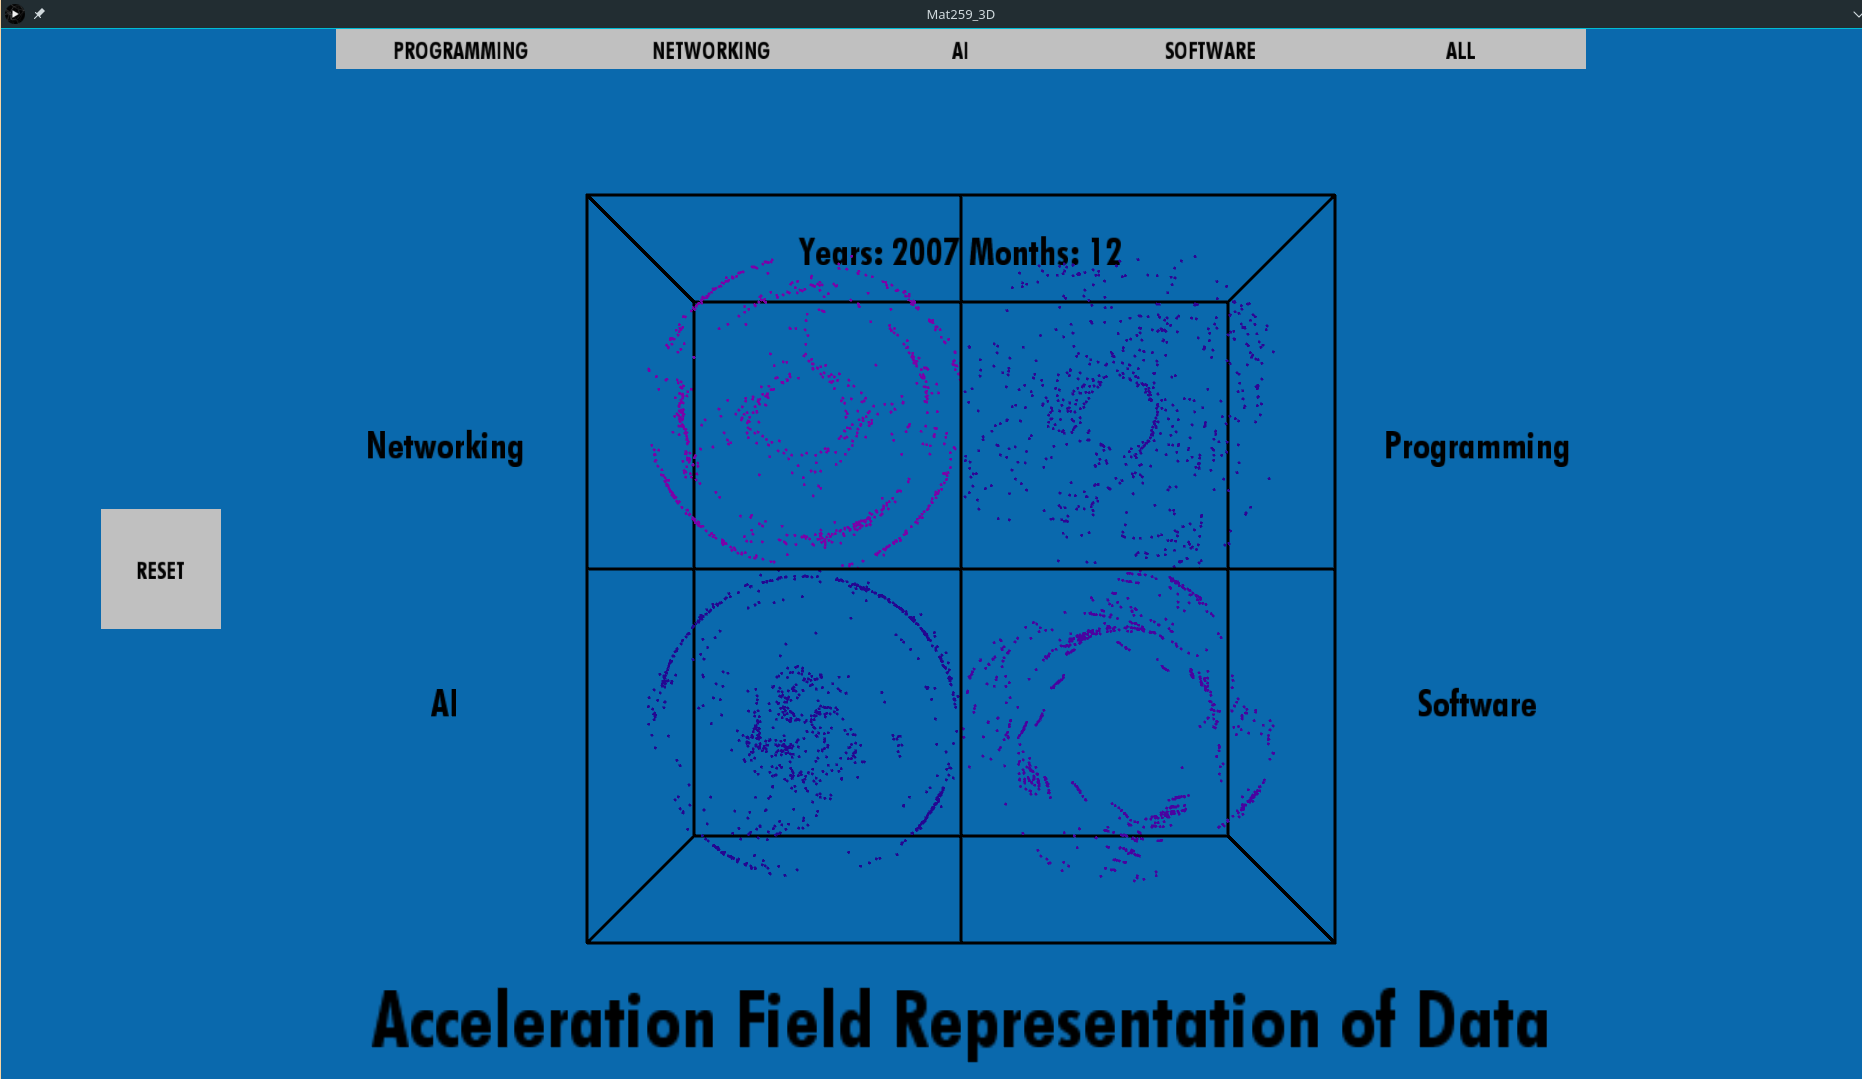
The buttons on top allow you to look the particle system that corresponds to each of the titles individually.
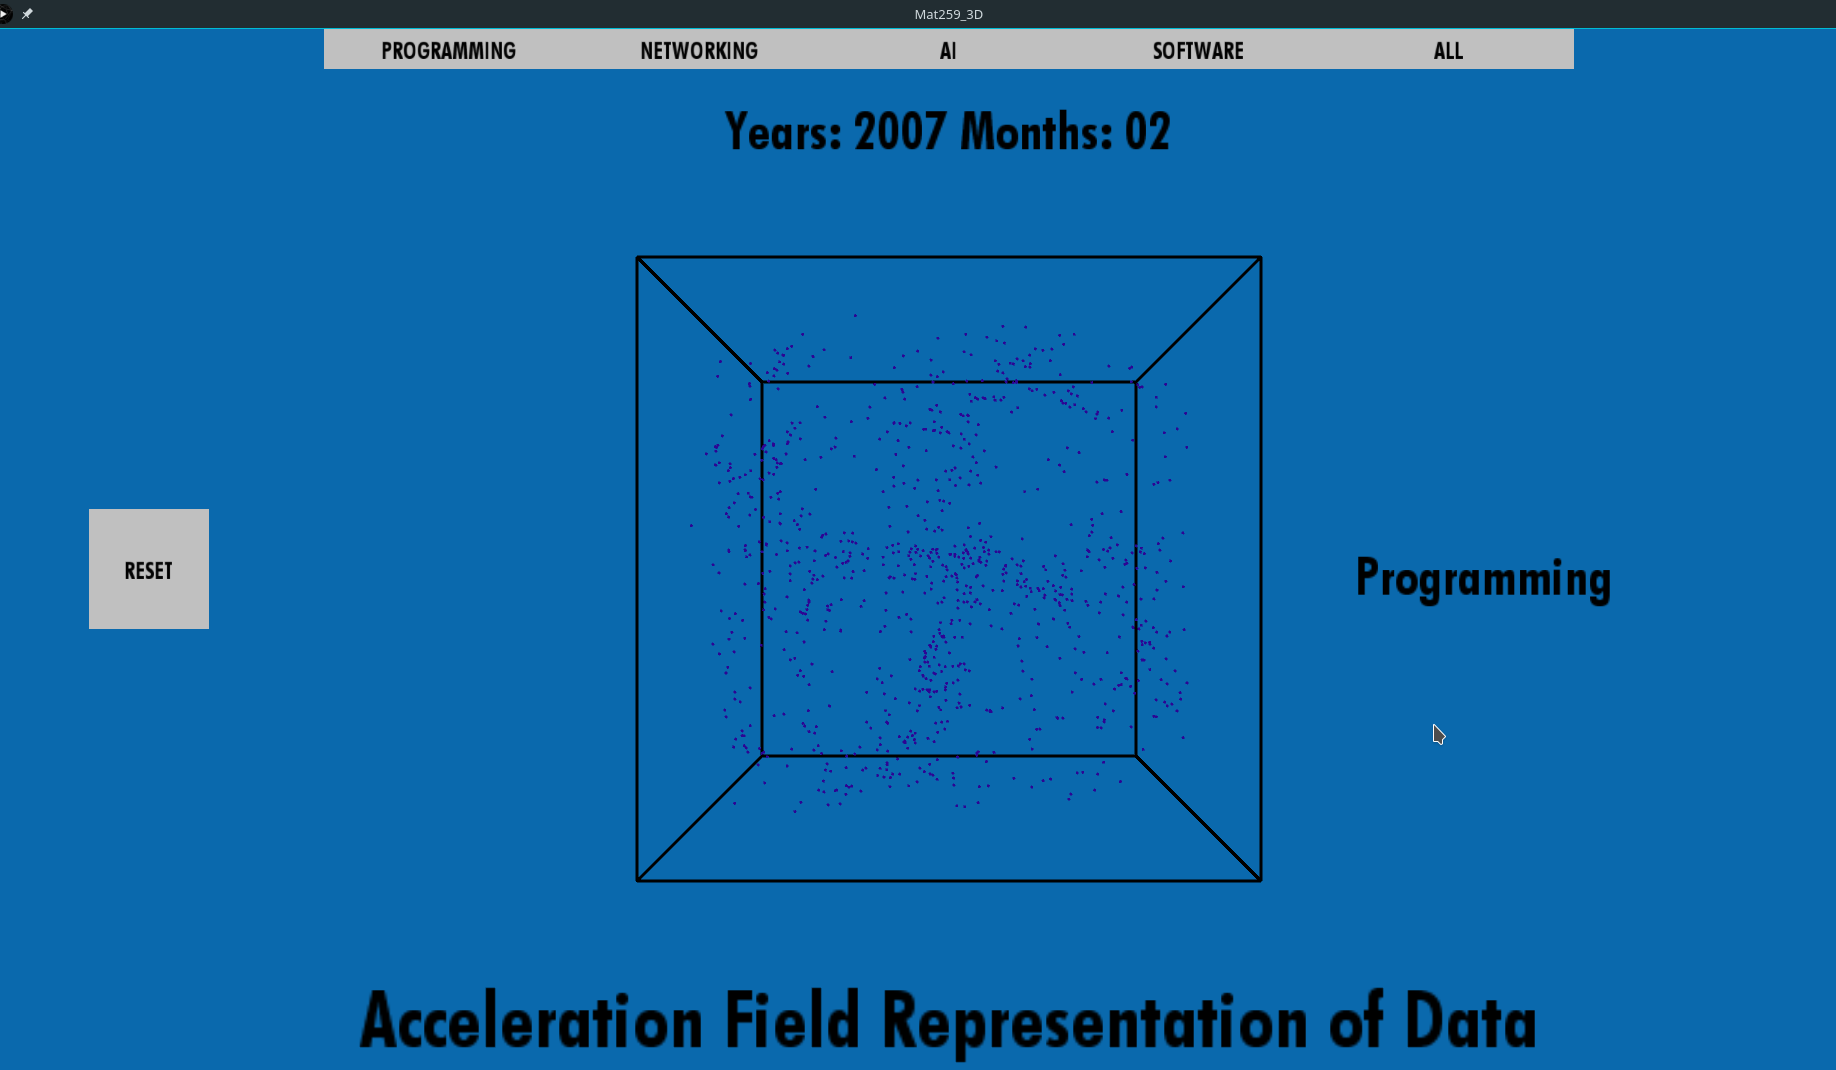
The reset button will bring you back to looking at all 4 systems at once. You can also click and drag the mouse to rotate the view left/right.
Code