2D Matrix Project
MAT 259, 2018
Echo Theohar
Concept
I realized that my last data query needed to be expanded, so I decided to choose a different point of focus. I looked at four of the top most popular political philosophy texts in US universities, which were Capital (Marx), Leviathan(Hobbes), The Communist Manifesto (Marx), and the Republic (Plato). I was interested in seeing the trends of the books and which ones would sustain popularity over time.
Query
Here is an example of the types of queries I ran. The first is to look for items, while the second isolated checkouts per year. They are all basically the same, I just switched out book titles. Each query took about 40 seconds:
CODE: SELECT ALL
SELECT
Title, COUNT(bibNumber) AS Counts, bibNumber, itemtype
FROM
spl_2016.inraw
WHERE
title LIKE 'communist manifesto'
AND (itemtype = 'acbk')
GROUP BY title , bibnumber, itemtype
ORDER BY Counts DESC
LIMIT 1000
Title, COUNT(bibNumber) AS Counts, bibNumber, itemtype, year(cout)
FROM
spl_2016.inraw
WHERE
title LIKE 'communist manifesto'
AND (itemtype = 'acbk')
AND year(cout) > 2005
GROUP BY title , bibnumber, itemtype, year(cout)
ORDER BY year(cout) DESC
LIMIT 1000
Preliminary sketches
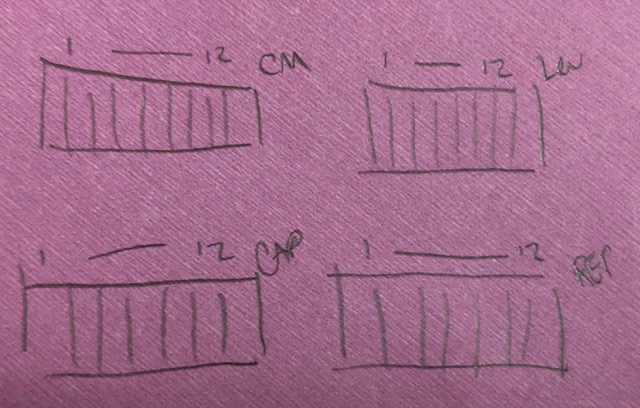
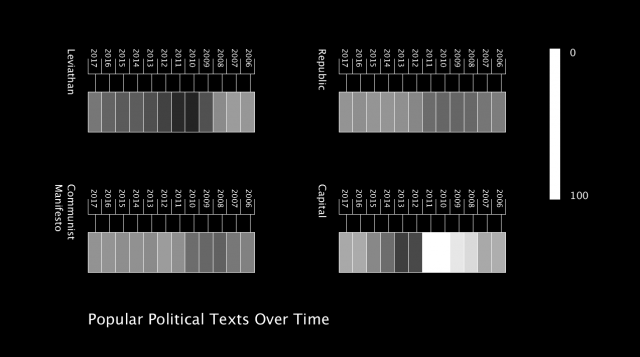
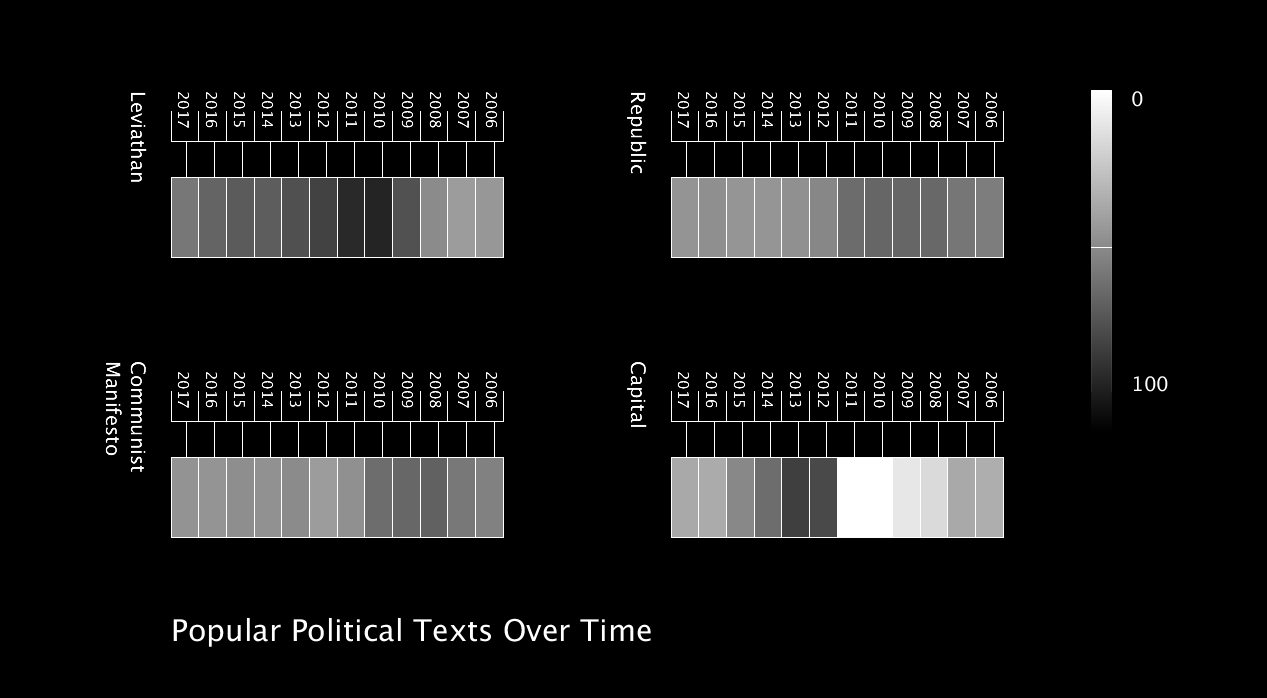
In my first sketch, I tried to imagine my data in Rodger's 2D Matrix demo he provided during class. I wanted to retain the color mapping that Ridger provided in his matrix, but break it up into 4 sections so that patterns could be compared between books in a different visual format.
Process
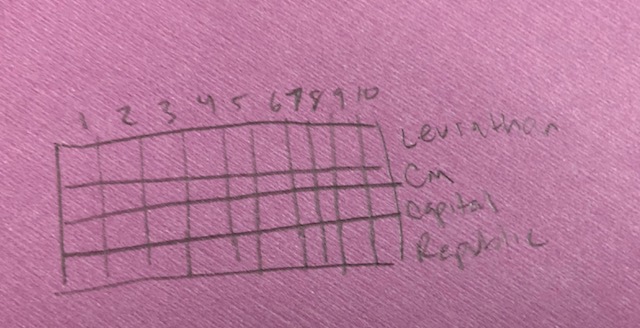
I began the project by breaking up my work into "grids". I made room for each of the books to map a set of 12 months and added my keys and title last.
After I made all my visualizations, I was not sure if I made a mistake or if the SPL library has a hiccup, but in my results Capital did not have ANY checkouts at all in 2010 or 2011. Generally all the checkout numbers were very low. Also, it seemed that most checkouts were peak for Leviathan, or that it has a higher total amount of checkouts over 12 years. I found it kind of strange that the numbers were so low all across the board, but I think that may be because the books are most likely available as PDFs online, or they are given out by college professors.
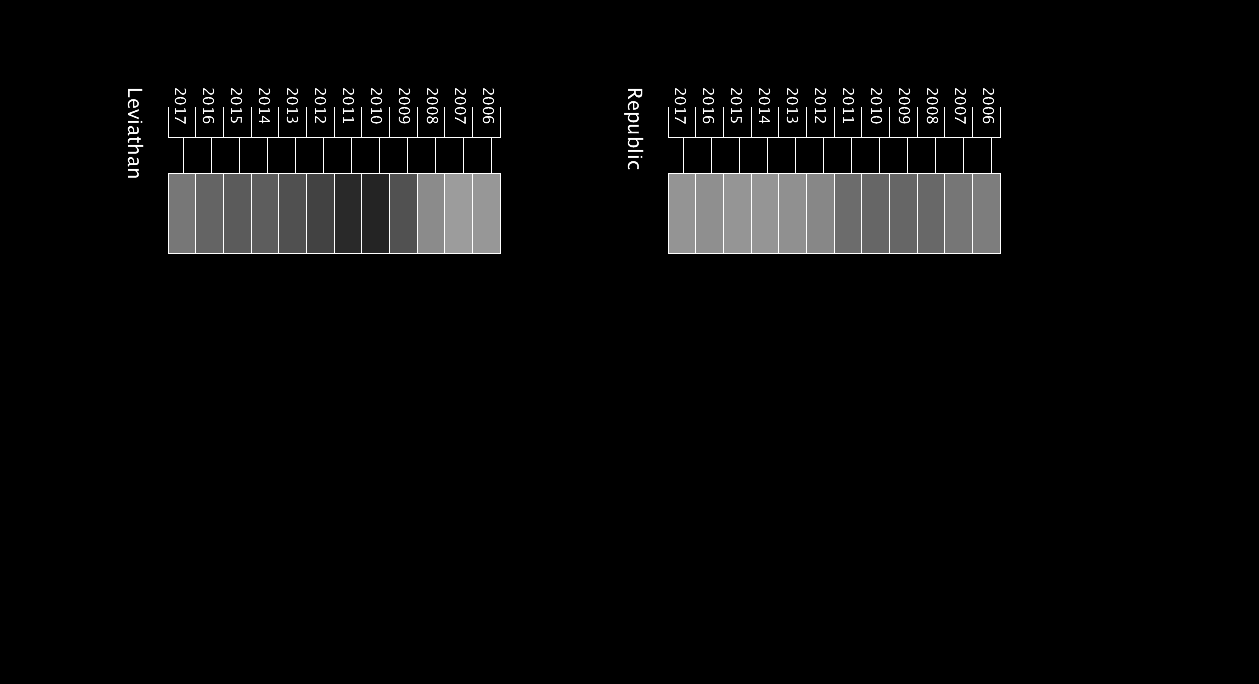
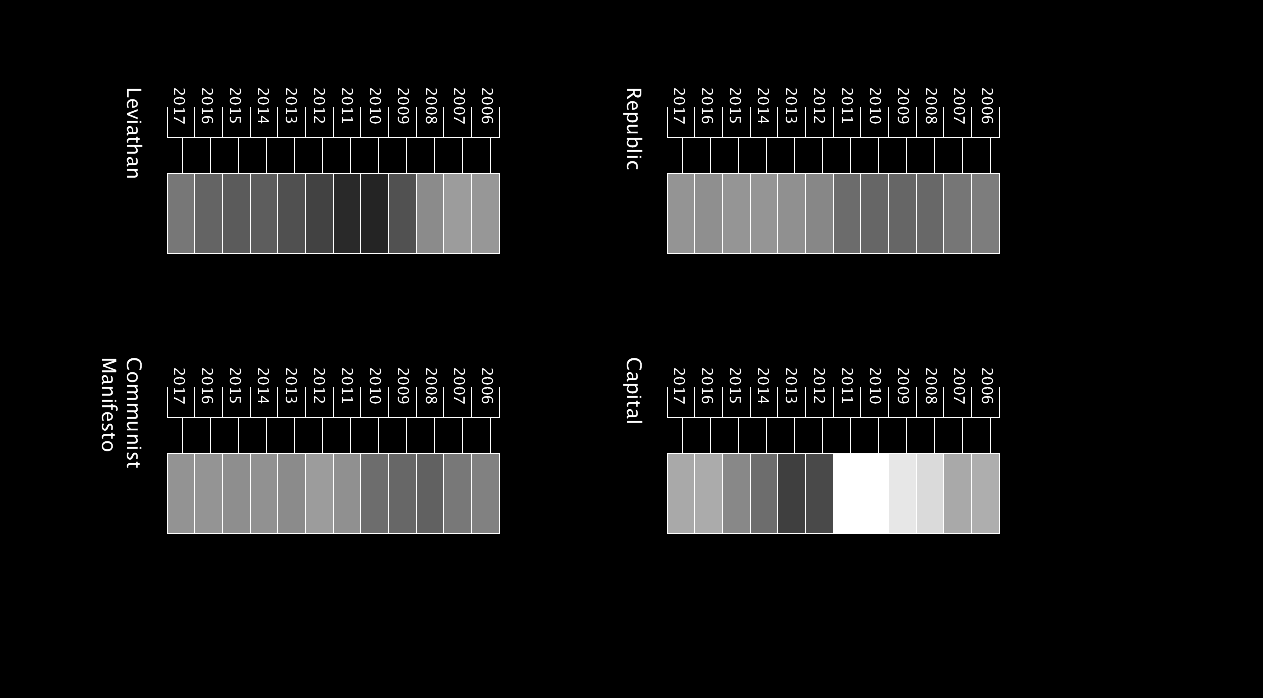
After I made all my visualizations, I was not sure if I made a mistake or if the SPL library has a hiccup, but in my results Capital did not have ANY checkouts at all in 2010 or 2011. Generally all the checkout numbers were very low. Also, it seemed that most checkouts were peak for Leviathan, or that it has a higher total amount of checkouts over 12 years. I found it kind of strange that the numbers were so low all across the board, but I think that may be because the books are most likely available as PDFs online, or they are given out by college professors.
Final result
Here is what my first and second version look like. I added a gradient representative of the values on the right in the second iteration.
Code