I'm curious to see how politics influence people on their reading materials. If we search the name of the current president Donald Trump on Amazon books, we can find as many as six pages of results. He co-authored most of these books. I believe that if people are curious about their presidential candidate, frequent library visitors might be interested in book by him or about him.
Trump's campaign started in June 2015 and since then he has been a frequent visitor of media headlines. I assume that a correlation between major milestones during his campaign and the checked-in/out records of his books in the Seattle Public Library.
Since we only care about correlation between Trump's campaign and related titles, there is no need to count the same title Trump: The Art of the Deal in with four different bibNumbers. Even though they are different media, three books and one CD.
     SELECT
         Title, COUNT(bibNumber) AS Counts, bibNumber, Itemtype
     FROM
         spl_2016.inraw
     WHERE
         title = 'Trump The Art of the Deal'
             OR title = 'Trump Think Like a Billionaire'
             OR title = 'Youve Been Trumped'
     GROUP BY title , bibNumber , itemtype
     ORDER BY Counts DESC
     LIMIT 1000
The modified query combines different bibNumbers of the same title into one entry. Referenced the monthly analysis code from Rodger Luo's Blade Runner report, the data exported as a .cvs file from MySQL for further processing.
     SELECT
     Title,
     COUNT(title) AS Counts,
     SUM(CASE
         WHEN (YEAR(cout) = 2015 AND MONTH(cout) = 1) THEN 1
         ELSE 0
     END) AS '2015-1',
     SUM(CASE
         WHEN (YEAR(cout) = 2015 AND MONTH(cout) = 2) THEN 1
         ELSE 0
     END) AS '2015-2',
     SUM(CASE
         WHEN (YEAR(cout) = 2015 AND MONTH(cout) = 3) THEN 1
         ELSE 0
     END) AS '2015-3',
     SUM(CASE
         WHEN (YEAR(cout) = 2015 AND MONTH(cout) = 4) THEN 1
         ELSE 0
     END) AS '2015-4',
     SUM(CASE
         WHEN (YEAR(cout) = 2015 AND MONTH(cout) = 5) THEN 1
         ELSE 0
     END) AS '2015-5',
     SUM(CASE
         WHEN (YEAR(cout) = 2015 AND MONTH(cout) = 6) THEN 1
         ELSE 0
     END) AS '2015-6',
     SUM(CASE
         WHEN (YEAR(cout) = 2015 AND MONTH(cout) = 7) THEN 1
         ELSE 0
     END) AS '2015-7',
     SUM(CASE
         WHEN (YEAR(cout) = 2015 AND MONTH(cout) = 8) THEN 1
         ELSE 0
     END) AS '2015-8',
     SUM(CASE
         WHEN (YEAR(cout) = 2015 AND MONTH(cout) = 9) THEN 1
         ELSE 0
     END) AS '2015-9',
     SUM(CASE
         WHEN (YEAR(cout) = 2015 AND MONTH(cout) = 10) THEN 1
         ELSE 0
     END) AS '2015-10',
     SUM(CASE
         WHEN (YEAR(cout) = 2015 AND MONTH(cout) = 11) THEN 1
         ELSE 0
     END) AS '2015-11',
     SUM(CASE
         WHEN (YEAR(cout) = 2015 AND MONTH(cout) = 12) THEN 1
         ELSE 0
     END) AS '2015-12',
     SUM(CASE
         WHEN (YEAR(cout) = 2016 AND MONTH(cout) = 1) THEN 1
         ELSE 0
     END) AS '2016-1',
     SUM(CASE
         WHEN (YEAR(cout) = 2016 AND MONTH(cout) = 2) THEN 1
         ELSE 0
     END) AS '2016-2',
     SUM(CASE
         WHEN (YEAR(cout) = 2016 AND MONTH(cout) = 3) THEN 1
         ELSE 0
     END) AS '2016-3',
     SUM(CASE
         WHEN (YEAR(cout) = 2016 AND MONTH(cout) = 4) THEN 1
         ELSE 0
     END) AS '2016-4',
     SUM(CASE
         WHEN (YEAR(cout) = 2016 AND MONTH(cout) = 5) THEN 1
         ELSE 0
     END) AS '2016-5',
     SUM(CASE
         WHEN (YEAR(cout) = 2016 AND MONTH(cout) = 6) THEN 1
         ELSE 0
     END) AS '2016-6',
     SUM(CASE
         WHEN (YEAR(cout) = 2016 AND MONTH(cout) = 7) THEN 1
         ELSE 0
     END) AS '2016-7',
     SUM(CASE
         WHEN (YEAR(cout) = 2016 AND MONTH(cout) = 8) THEN 1
         ELSE 0
     END) AS '2016-8',
     SUM(CASE
         WHEN (YEAR(cout) = 2016 AND MONTH(cout) = 9) THEN 1
         ELSE 0
     END) AS '2016-9',
     SUM(CASE
         WHEN (YEAR(cout) = 2016 AND MONTH(cout) = 10) THEN 1
         ELSE 0
     END) AS '2016-10',
     SUM(CASE
         WHEN (YEAR(cout) = 2016 AND MONTH(cout) = 11) THEN 1
         ELSE 0
     END) AS '2016-11',
     SUM(CASE
         WHEN (YEAR(cout) = 2016 AND MONTH(cout) = 12) THEN 1
         ELSE 0
     END) AS '2016-12',
     SUM(CASE
         WHEN (YEAR(cout) = 2017 AND MONTH(cout) = 1) THEN 1
         ELSE 0
     END) AS '2017-1',
     SUM(CASE
         WHEN (YEAR(cout) = 2017 AND MONTH(cout) = 2) THEN 1
         ELSE 0
     END) AS '2017-2',
     SUM(CASE
         WHEN (YEAR(cout) = 2017 AND MONTH(cout) = 3) THEN 1
         ELSE 0
     END) AS '2017-3',
     SUM(CASE
         WHEN (YEAR(cout) = 2017 AND MONTH(cout) = 4) THEN 1
         ELSE 0
     END) AS '2017-4',
     SUM(CASE
         WHEN (YEAR(cout) = 2017 AND MONTH(cout) = 5) THEN 1
         ELSE 0
     END) AS '2017-5',
     SUM(CASE
         WHEN (YEAR(cout) = 2017 AND MONTH(cout) = 6) THEN 1
         ELSE 0
     END) AS '2017-6',
     SUM(CASE
         WHEN (YEAR(cout) = 2017 AND MONTH(cout) = 7) THEN 1
         ELSE 0
     END) AS '2017-7',
     SUM(CASE
         WHEN (YEAR(cout) = 2017 AND MONTH(cout) = 8) THEN 1
         ELSE 0
     END) AS '2017-8',
     SUM(CASE
         WHEN (YEAR(cout) = 2017 AND MONTH(cout) = 9) THEN 1
         ELSE 0
     END) AS '2017-9',
     SUM(CASE
         WHEN (YEAR(cout) = 2017 AND MONTH(cout) = 10) THEN 1
         ELSE 0
     END) AS '2017-10',
     SUM(CASE
         WHEN (YEAR(cout) = 2017 AND MONTH(cout) = 11) THEN 1
         ELSE 0
     END) AS '2017-11',
     SUM(CASE
         WHEN (YEAR(cout) = 2017 AND MONTH(cout) = 12) THEN 1
         ELSE 0
     END) AS '2017-12'
                    FROM
     spl_2016.outraw
                    WHERE
     title = 'Trump The Art of the Deal'
         OR title = 'Trump Think Like a Billionaire'
         OR title = 'Youve Been Trumped'
                    GROUP BY title
                    ORDER BY Counts DESC
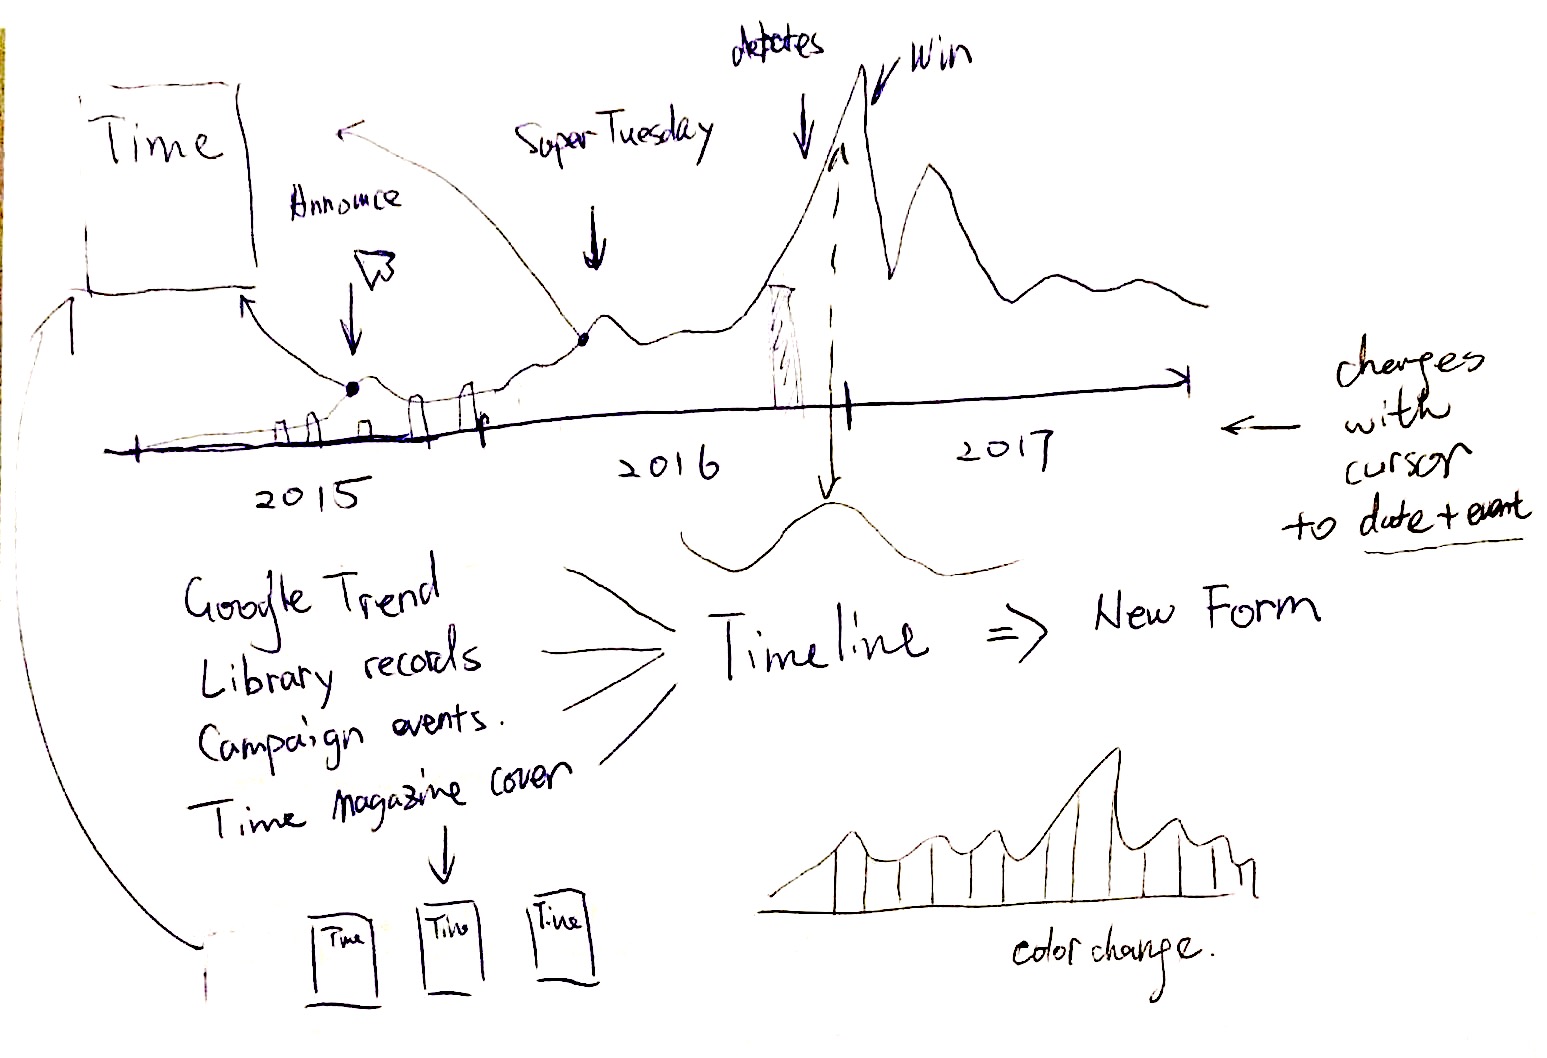
This is the initial sketch when I tried to figure out how to present information from four different sources: Seattle Public Library, Google Trend, Campaign Milestones and Time magazine covers on a single timeline. I realized that if all these elements have to stay on the same plane, then what I can bring to make this flat plane more vivid is some interactive effects, like actions triggered by mouse movements.
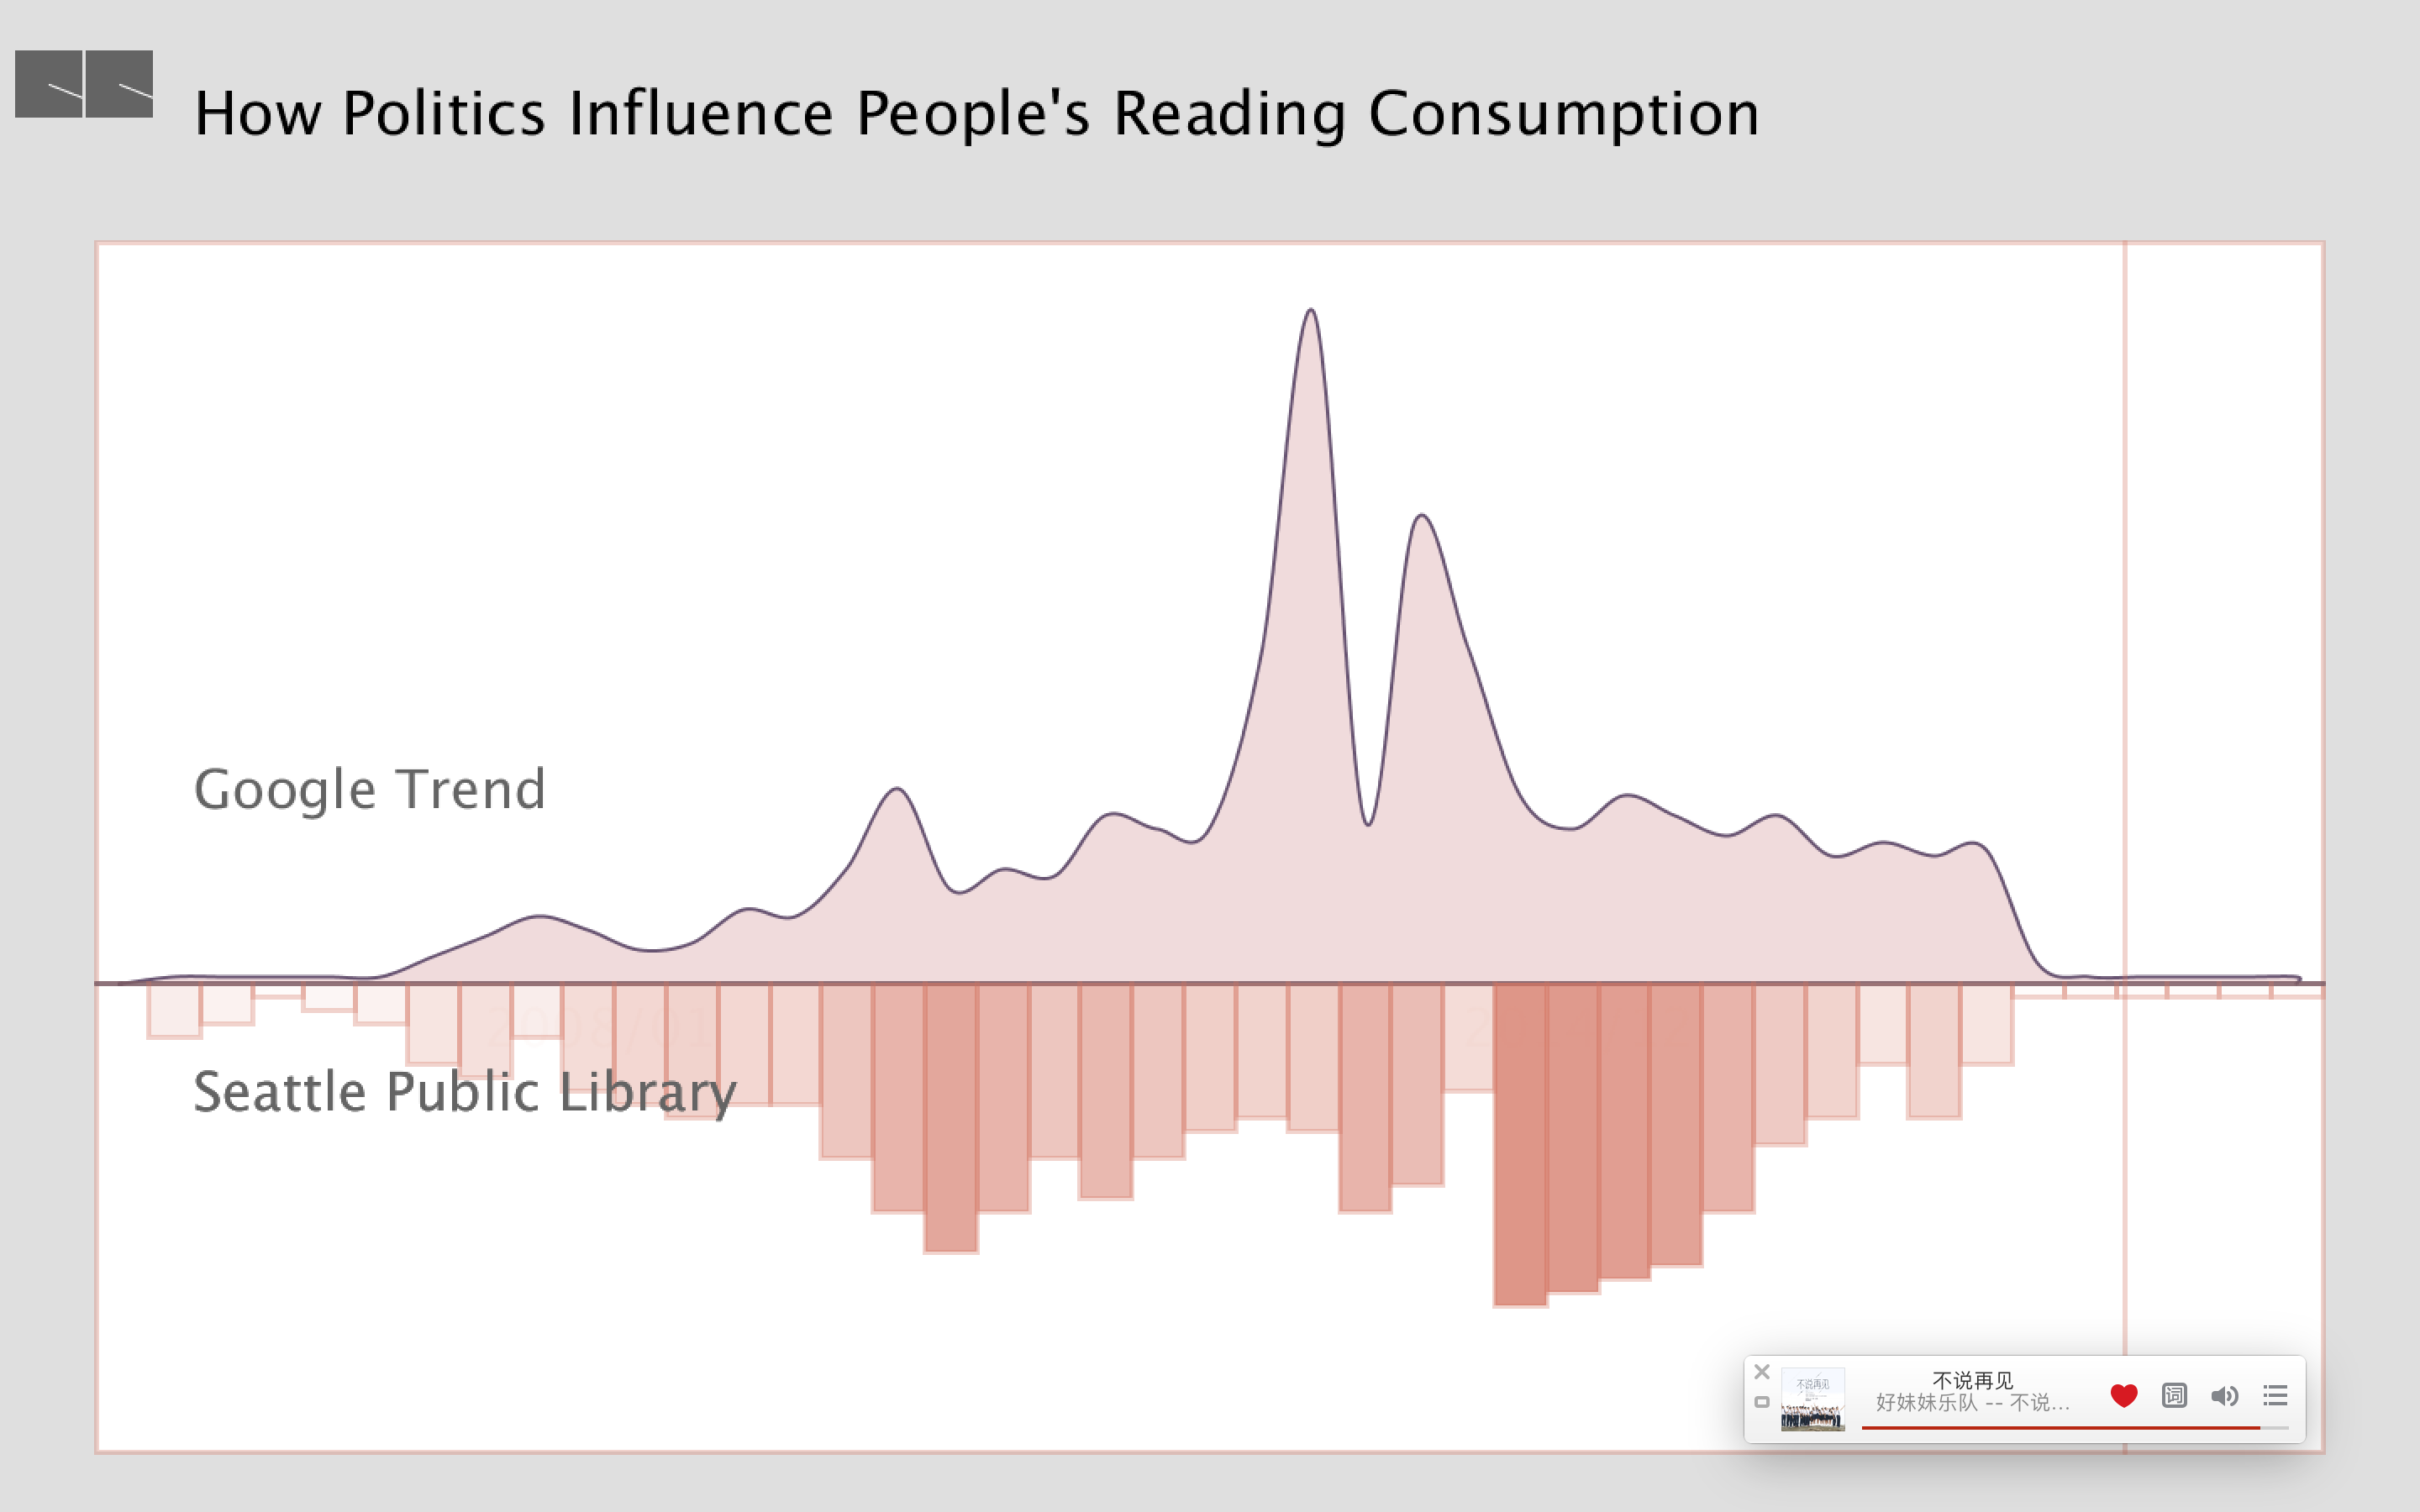
I spent a lot time coding and little time designing. This first draft helped me realize how important coherent color means to a visualization work.
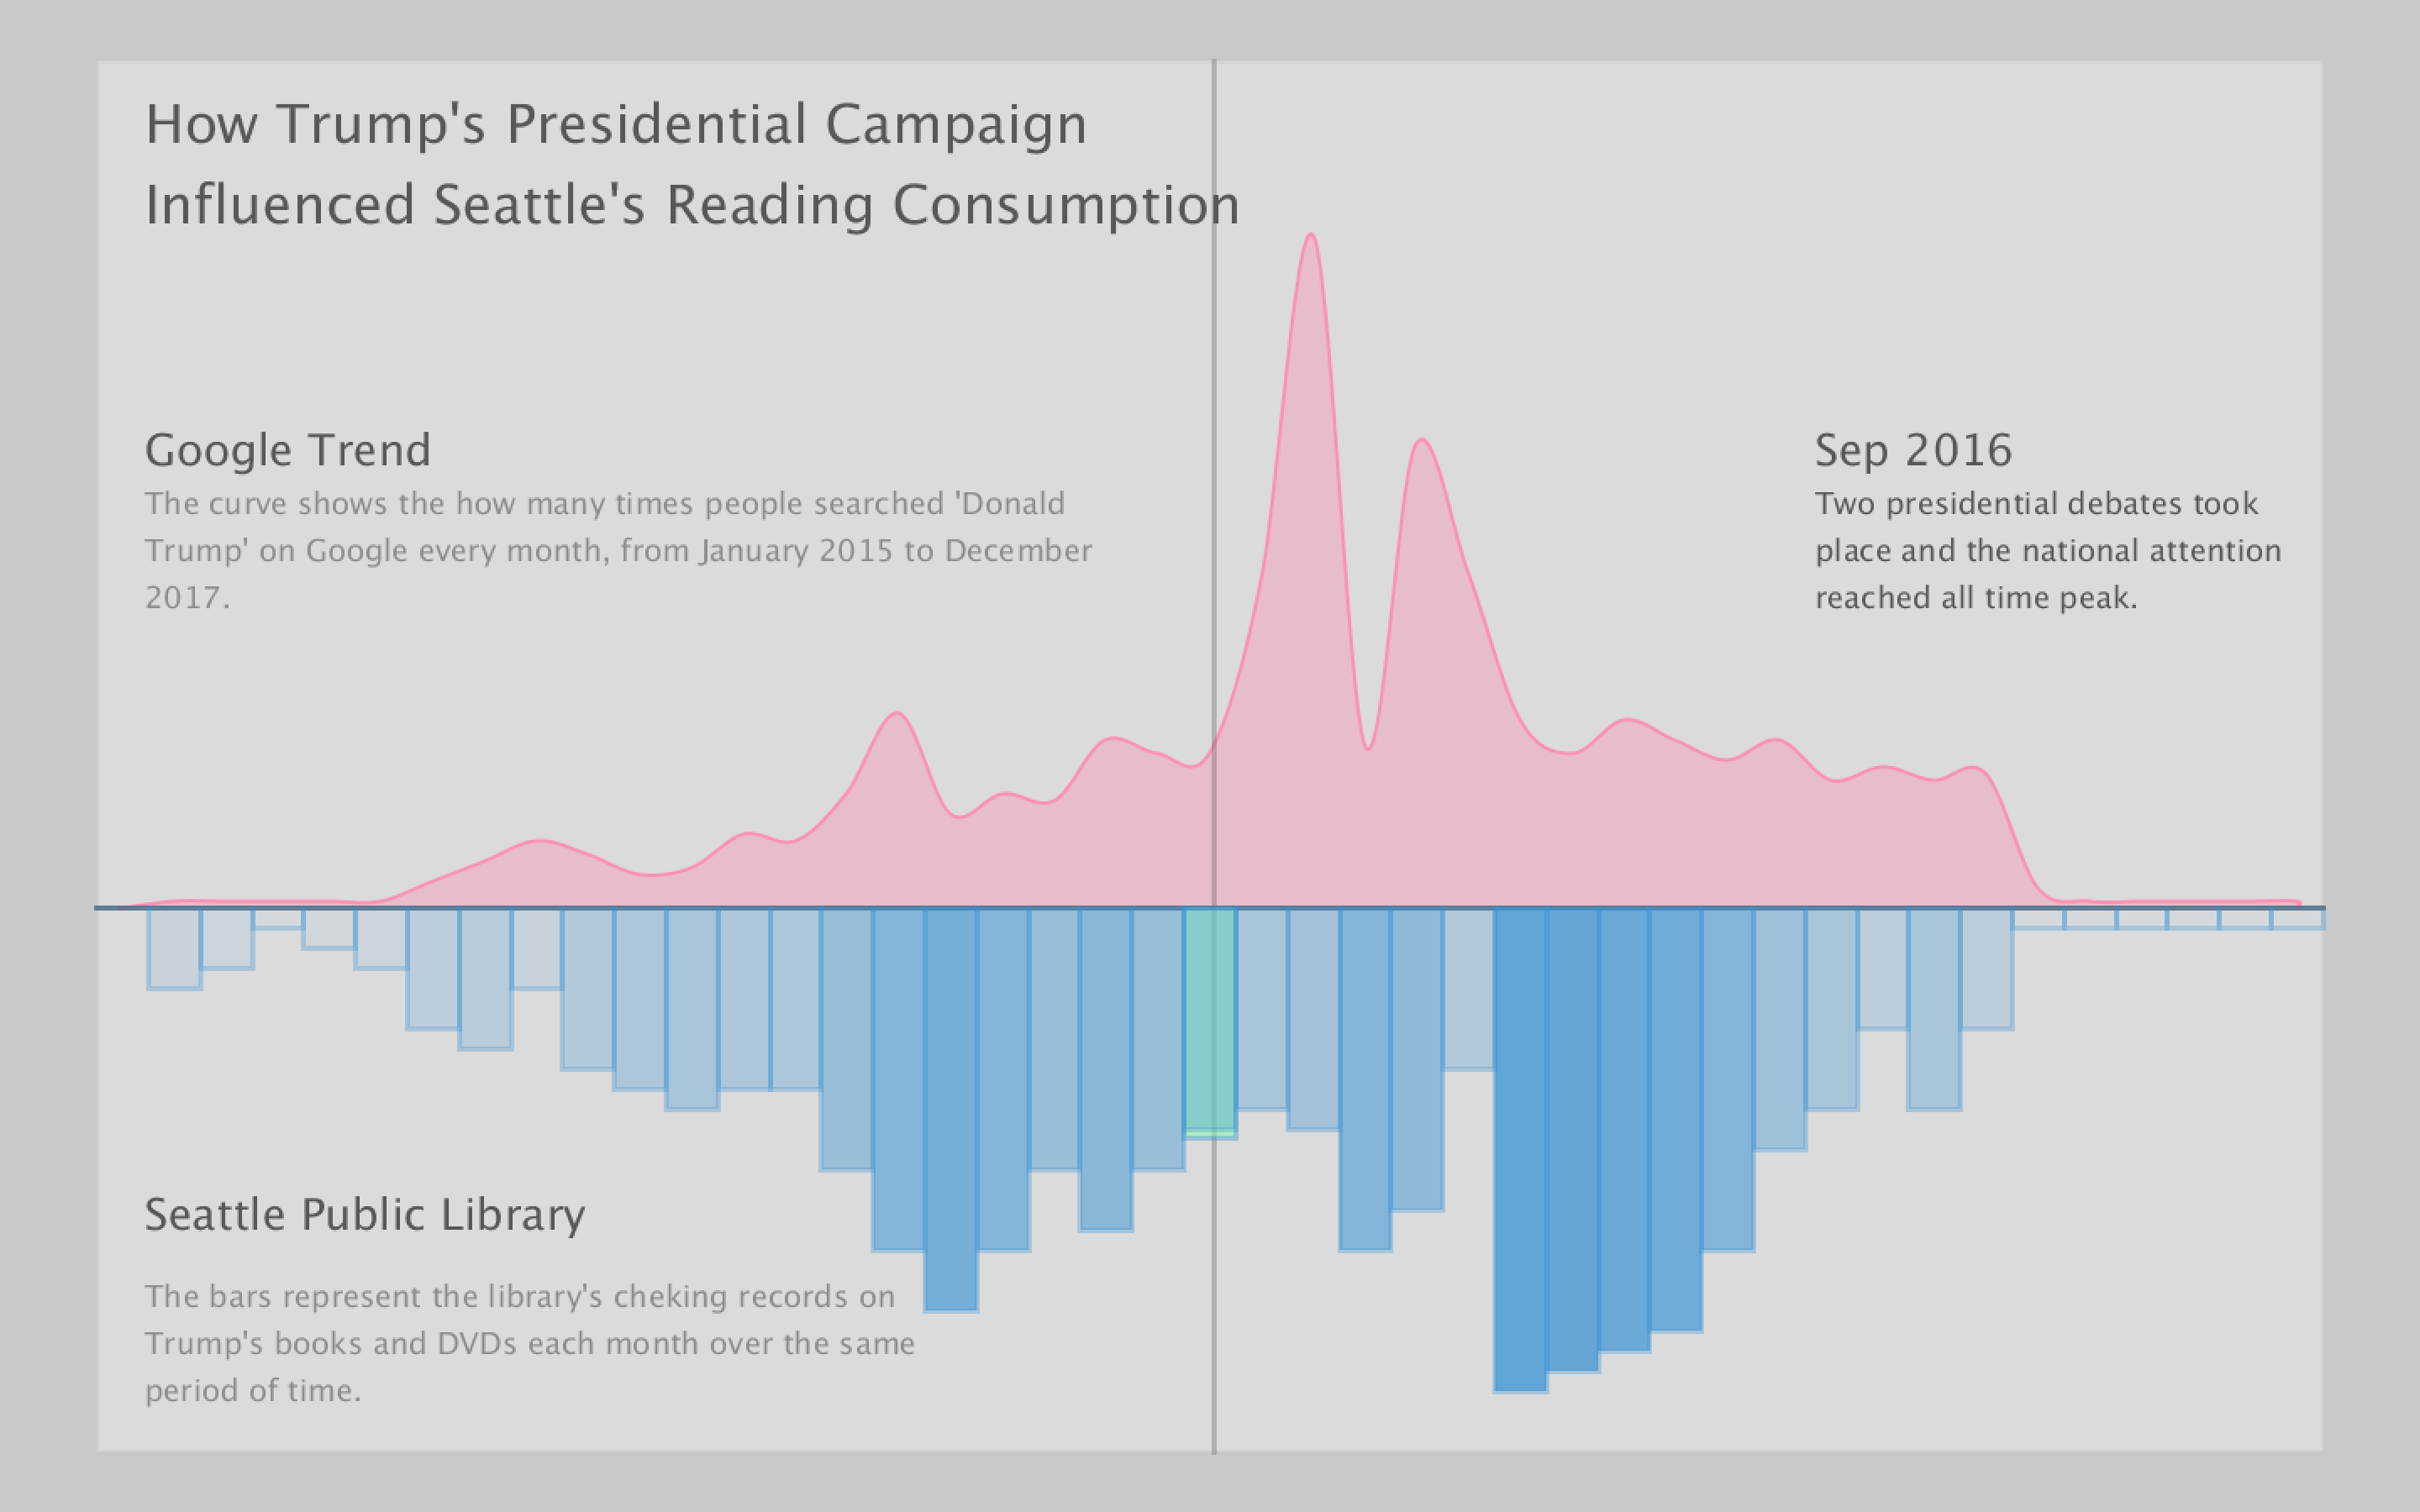
This, looks more like it. I believe this would be a presentable first version of my topics.
This is the GIF animation that shows how user's mouse movement can bring up the bars that shows the checking records of Trump related books and DVDs at he Seattle Public Library. When the mouse hover over certain months that include an campaign event, text on top right will give extra information to show the significance of this month, so the user may find an correlation between the Google Trend curve and the library data.