Reddit Image Data Visualization
MAT 259, 2017
Mert Toka
Concept
Reddit, judged by its post activity, is one of the biggest social media used today. In some content, it is commonly referred as the internet thanks to its wide range of subreddits and managemental structure. Subreddits are managed by internet users, rather than company employees, and almost anything has a subreddit that brings like-minded people together. Images on Reddit have a special meaning attached to them since the burst of internet memes from websites such as
4chang and 9gag, which resulted in a post-modern internet culture idea organized around memes. In that sense, following visualization could be considered as a mere attempt at laying down a map of such a cultural phenomena. Data
I used the Reddit image data found on Stanford SNAP. The dataset contains a subset of images uploaded to Reddit from July 2008 to Jan 2013. Regardless of the owner and the subreddit, the same image is labeled with a unique
Sample data table is below:
image_id. Provided reddit_id, it is fairly easy to navigate to the image URL -- https://www.reddit.com/ + reddit_id.
Sample data table is below:
| im_id | time | title | votes | url | #_upv | subreddit | #_downv | score | #_com | username |
|---|---|---|---|---|---|---|---|---|---|---|
| 6037 | 1347042817 | How someone with a peanut allergy feels on F7U12 | 754 | zinah | 564 | fffffffuuuuuuuuuuuu | 190 | 374 | 48 | 100cottage |
| 6037 | 1328355359 | Maybe I've been living under a rock | 543 | pbb9o | 362 | fffffffuuuuuuuuuuuu | 181 | 181 | 33 | afjamg88 |
| 6037 | 1329296077 | My First Time Browsing /r/atheism | 179 | pre09 | 150 | atheism | 29 | 121 | 17 | Alcranky |
Visualization
The visualization is built with

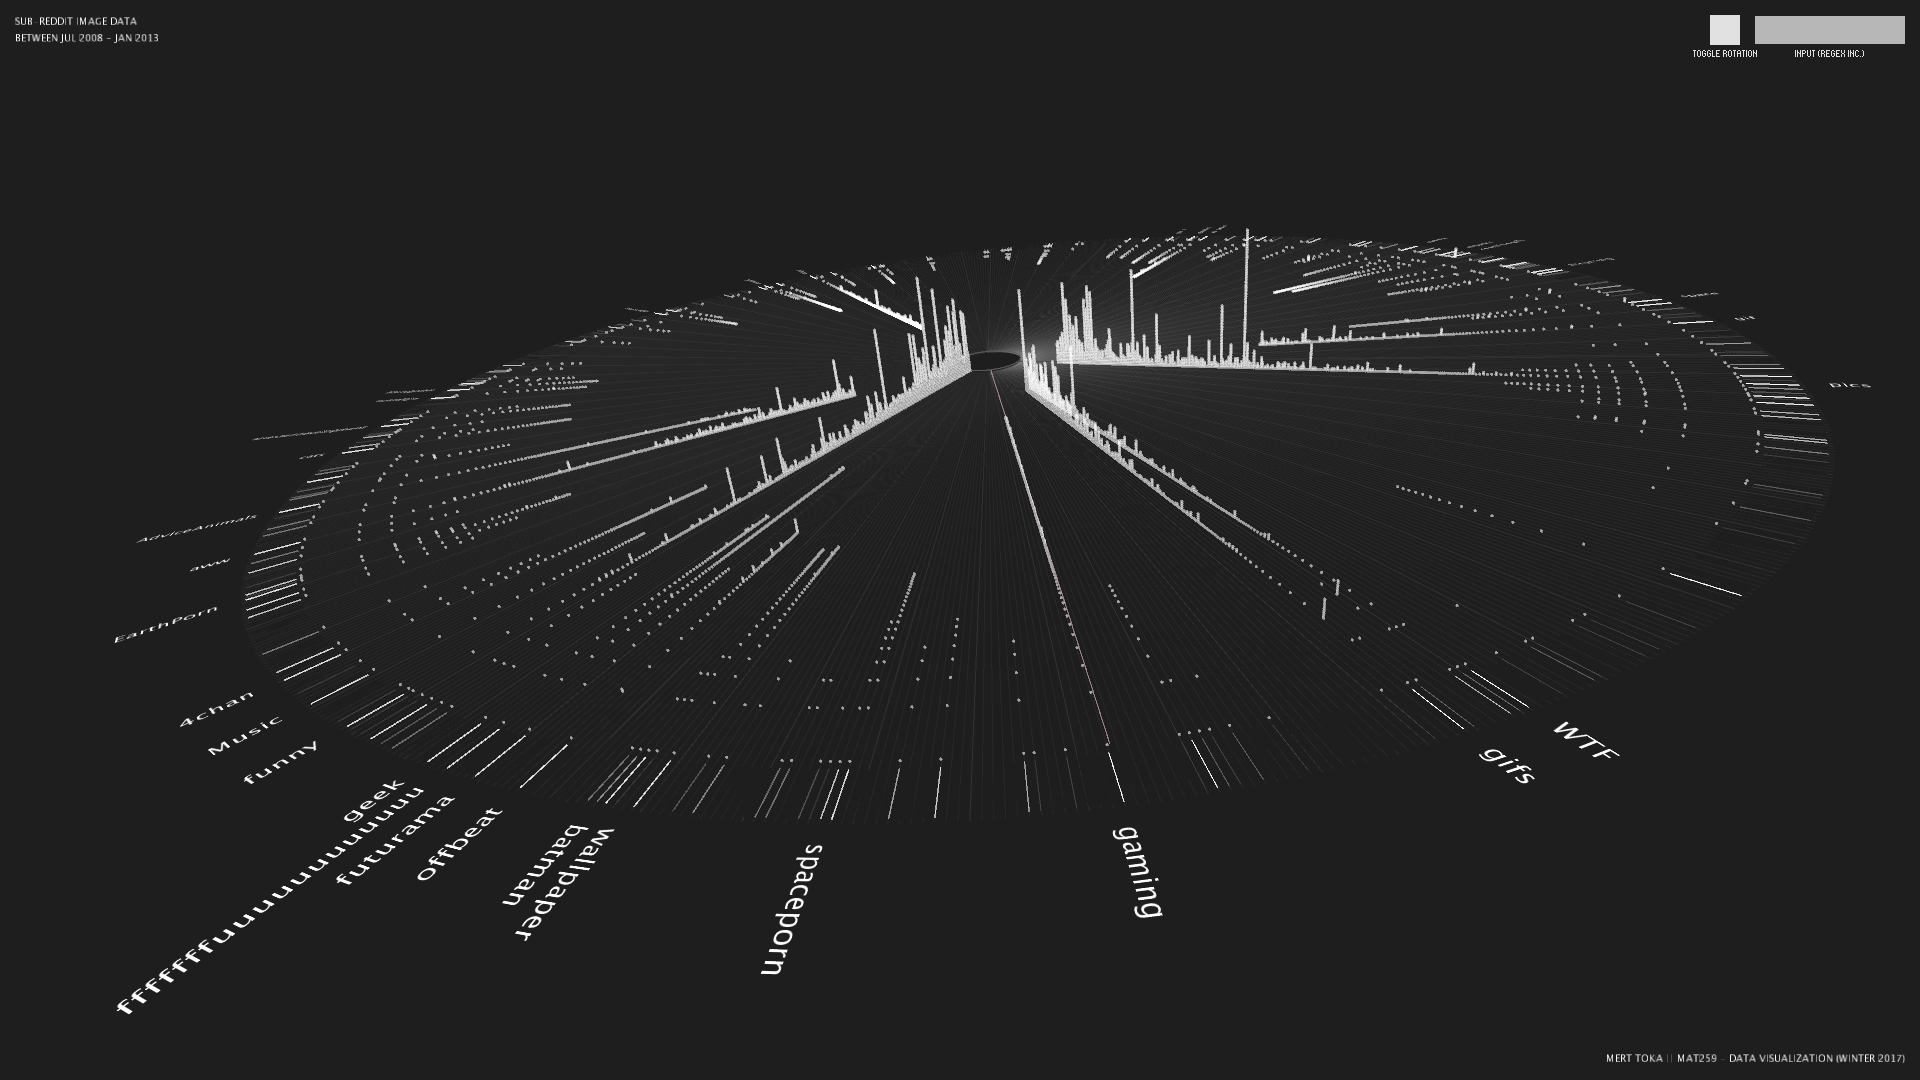
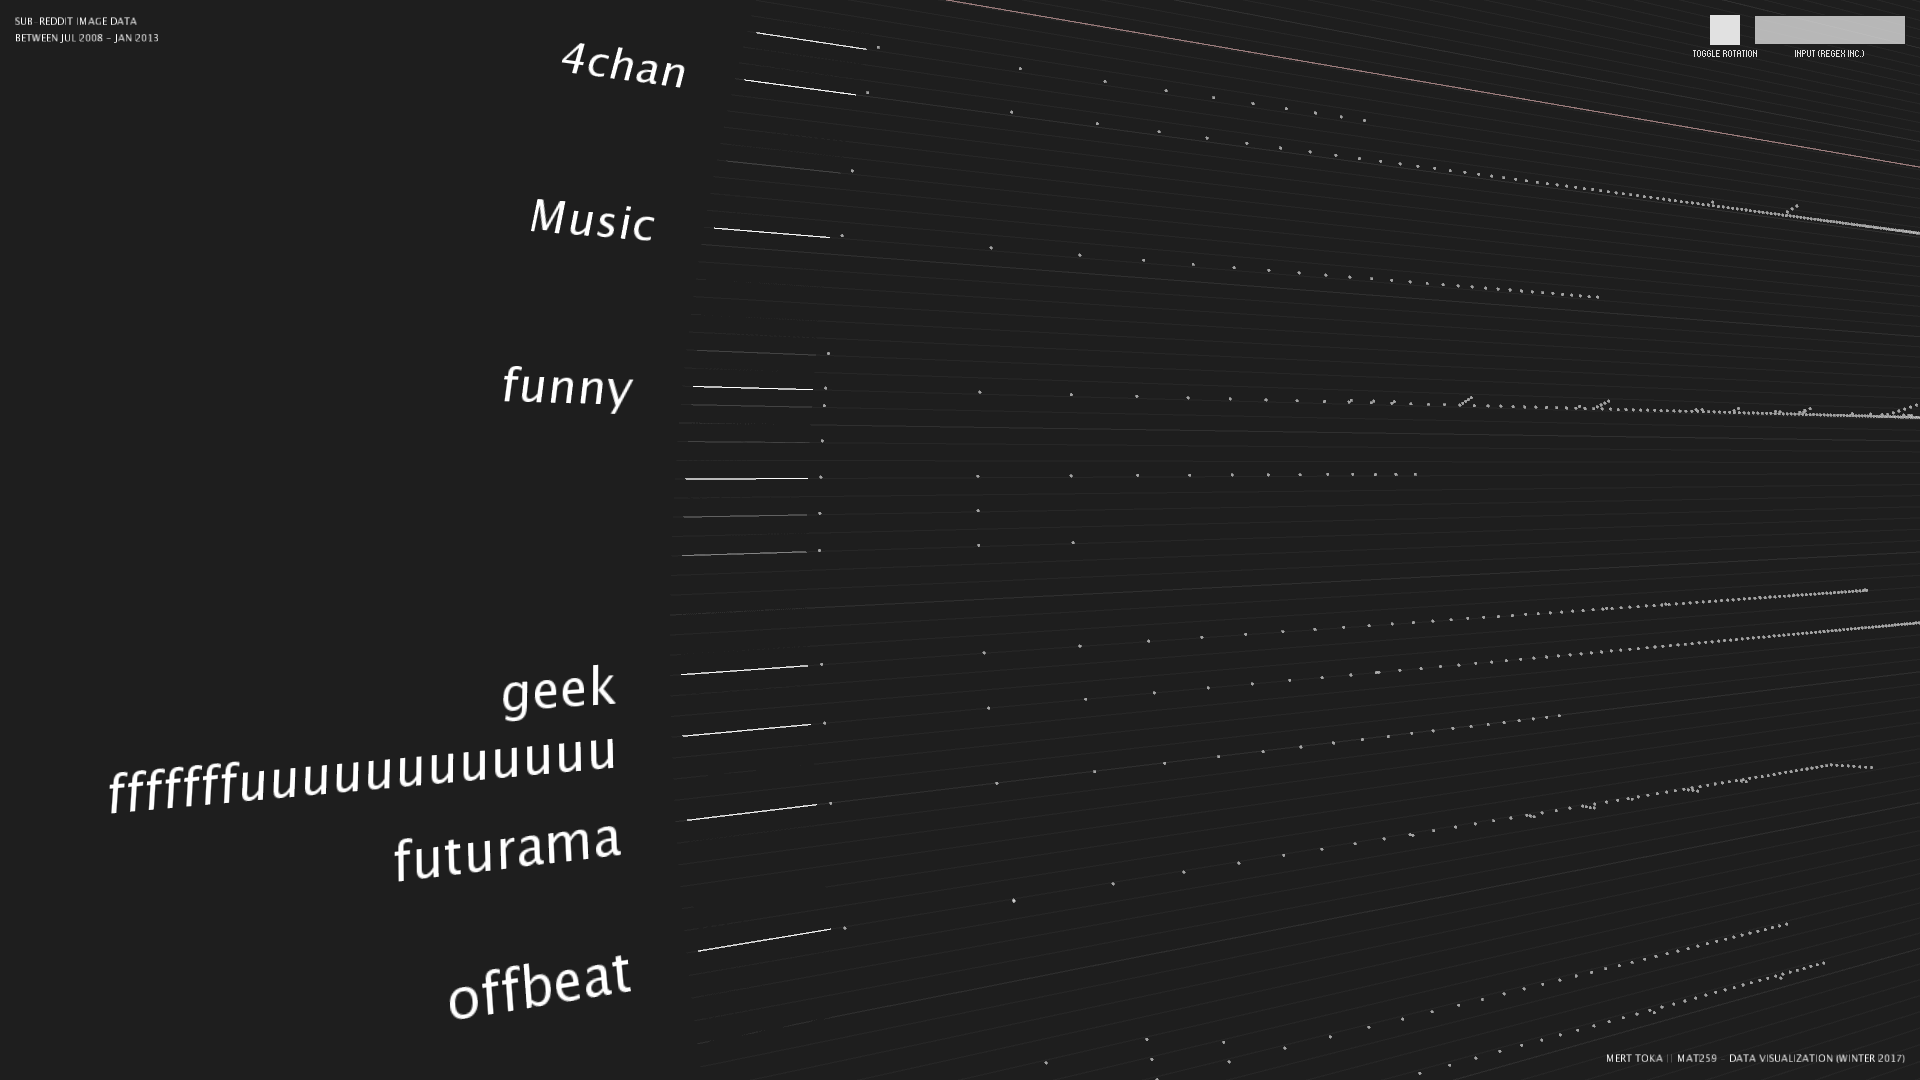
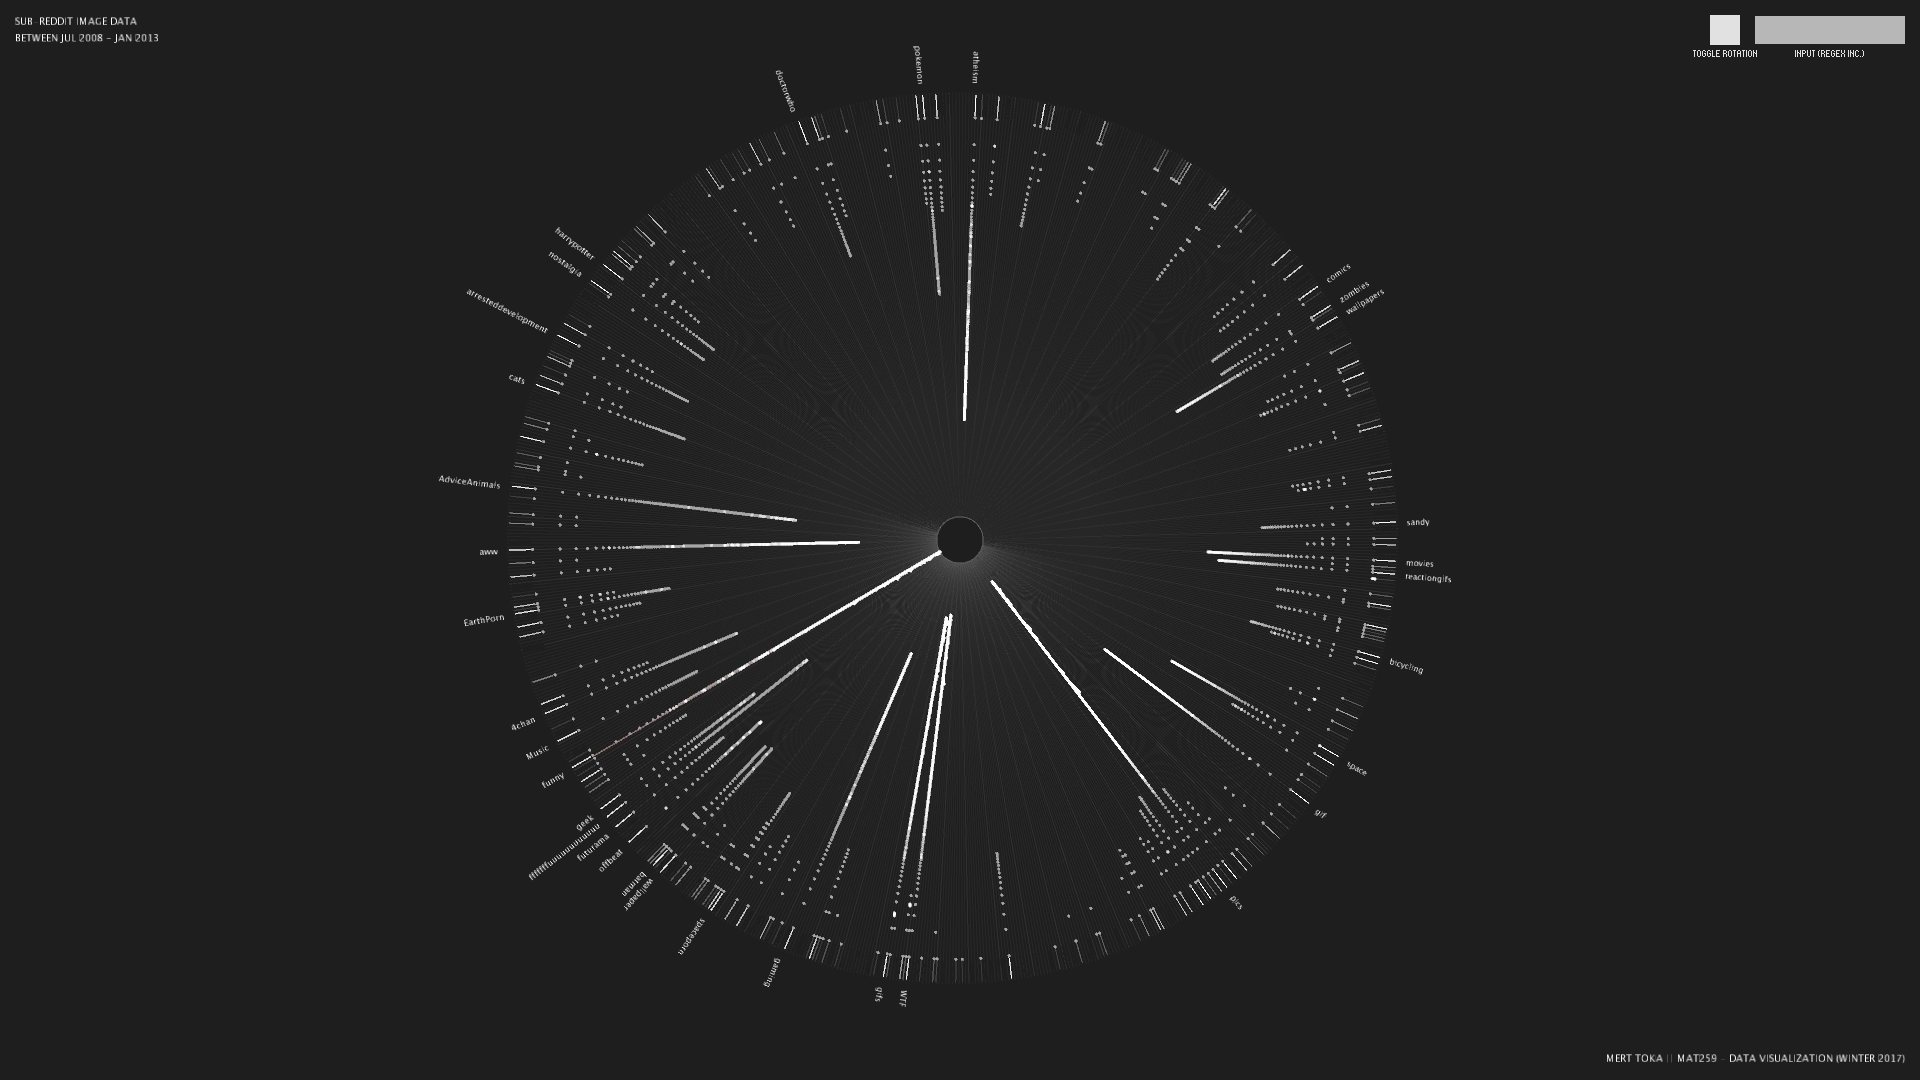
I decided to use the polar coordinate system and assigned
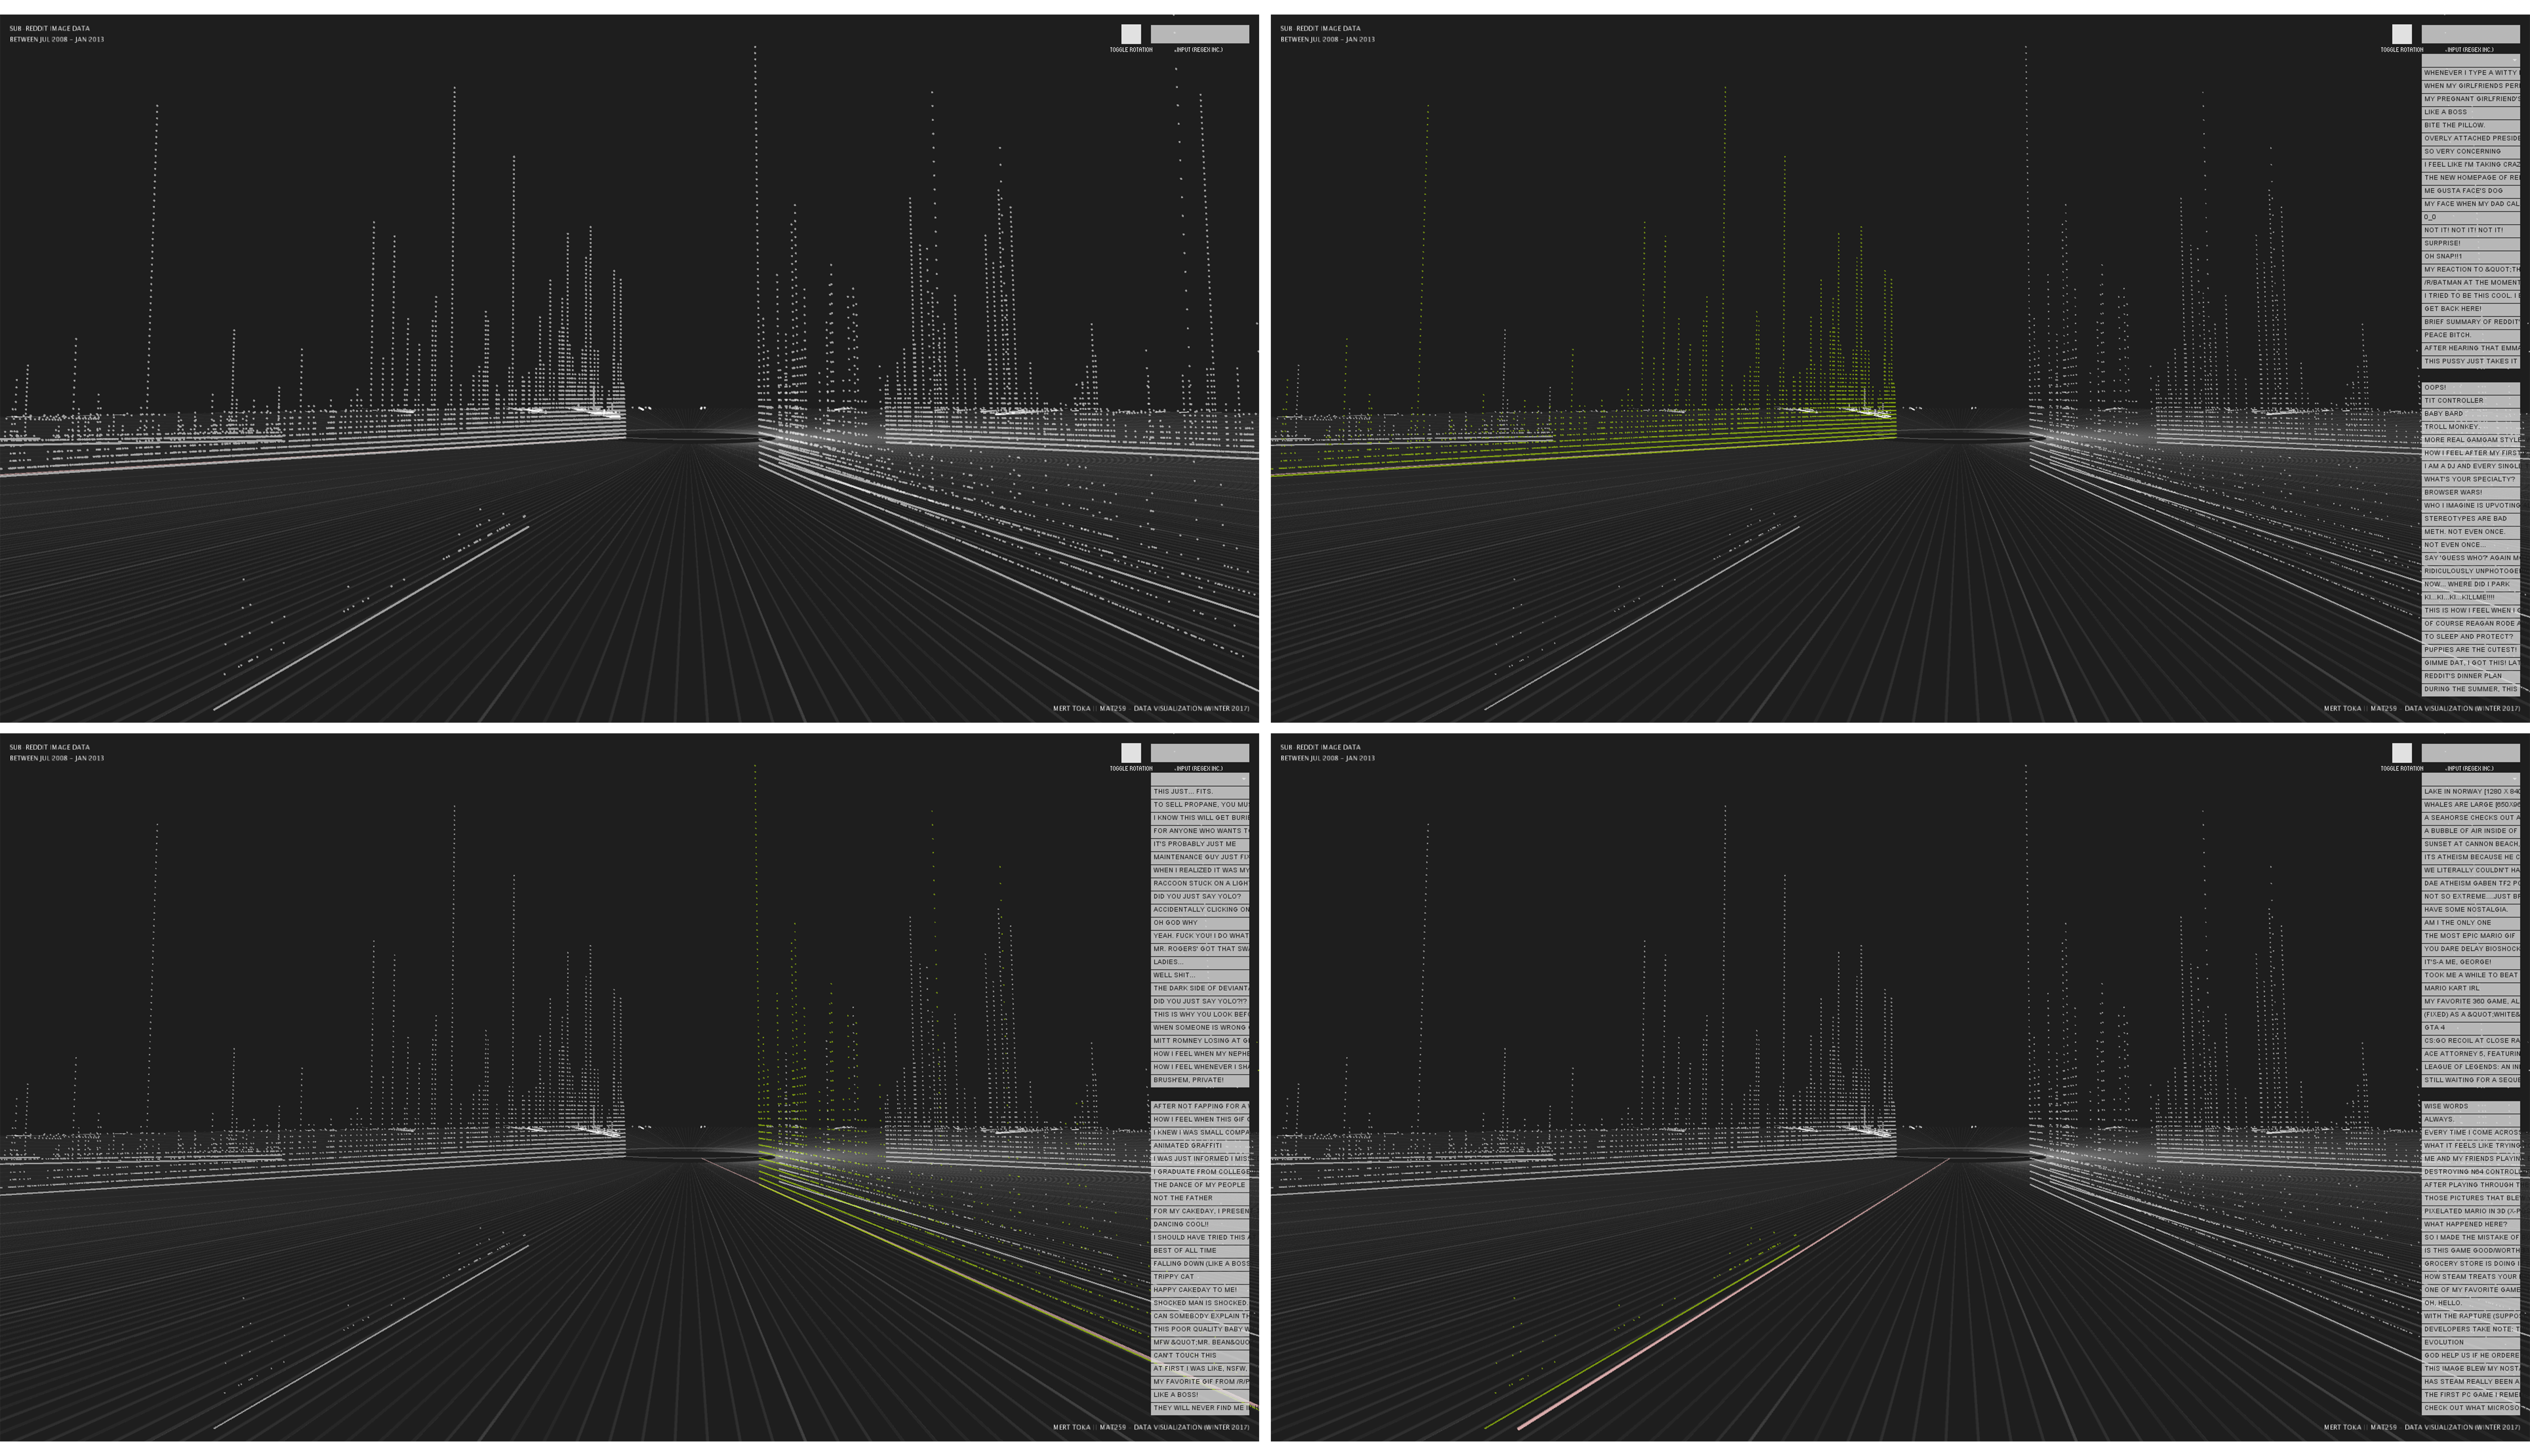
*Right clicking* on one of the
Pressing
Processing 3.3 and it utilizes PeasyCam and ControlP5 libraries in order to function.
I decided to use the polar coordinate system and assigned
subreddits to theta, users in the subreddit to the radius. The placement of user values is performed using log scale and starts increasing from outer circle towards the center. Then, the images belong to the users in the specific subreddit is displayed using vertical axis and increases proportionally to the number of images of the user in current subreddit.
*Right clicking* on one of the
subreddits selects the subreddit and displays selected image information on the drop-down list. At the same time, the user has an option to search specific words or regular-expression phrases in the textbox, which will visually result in a highlight of matched items with yellow. Clicking on any item in the dropdown list will follow image URL and will display comment page of image.
Pressing
` key (located next to 1 in most keyboards) resets selection and returns everything unfiltered view.
Final result
Evaluation/Analysis
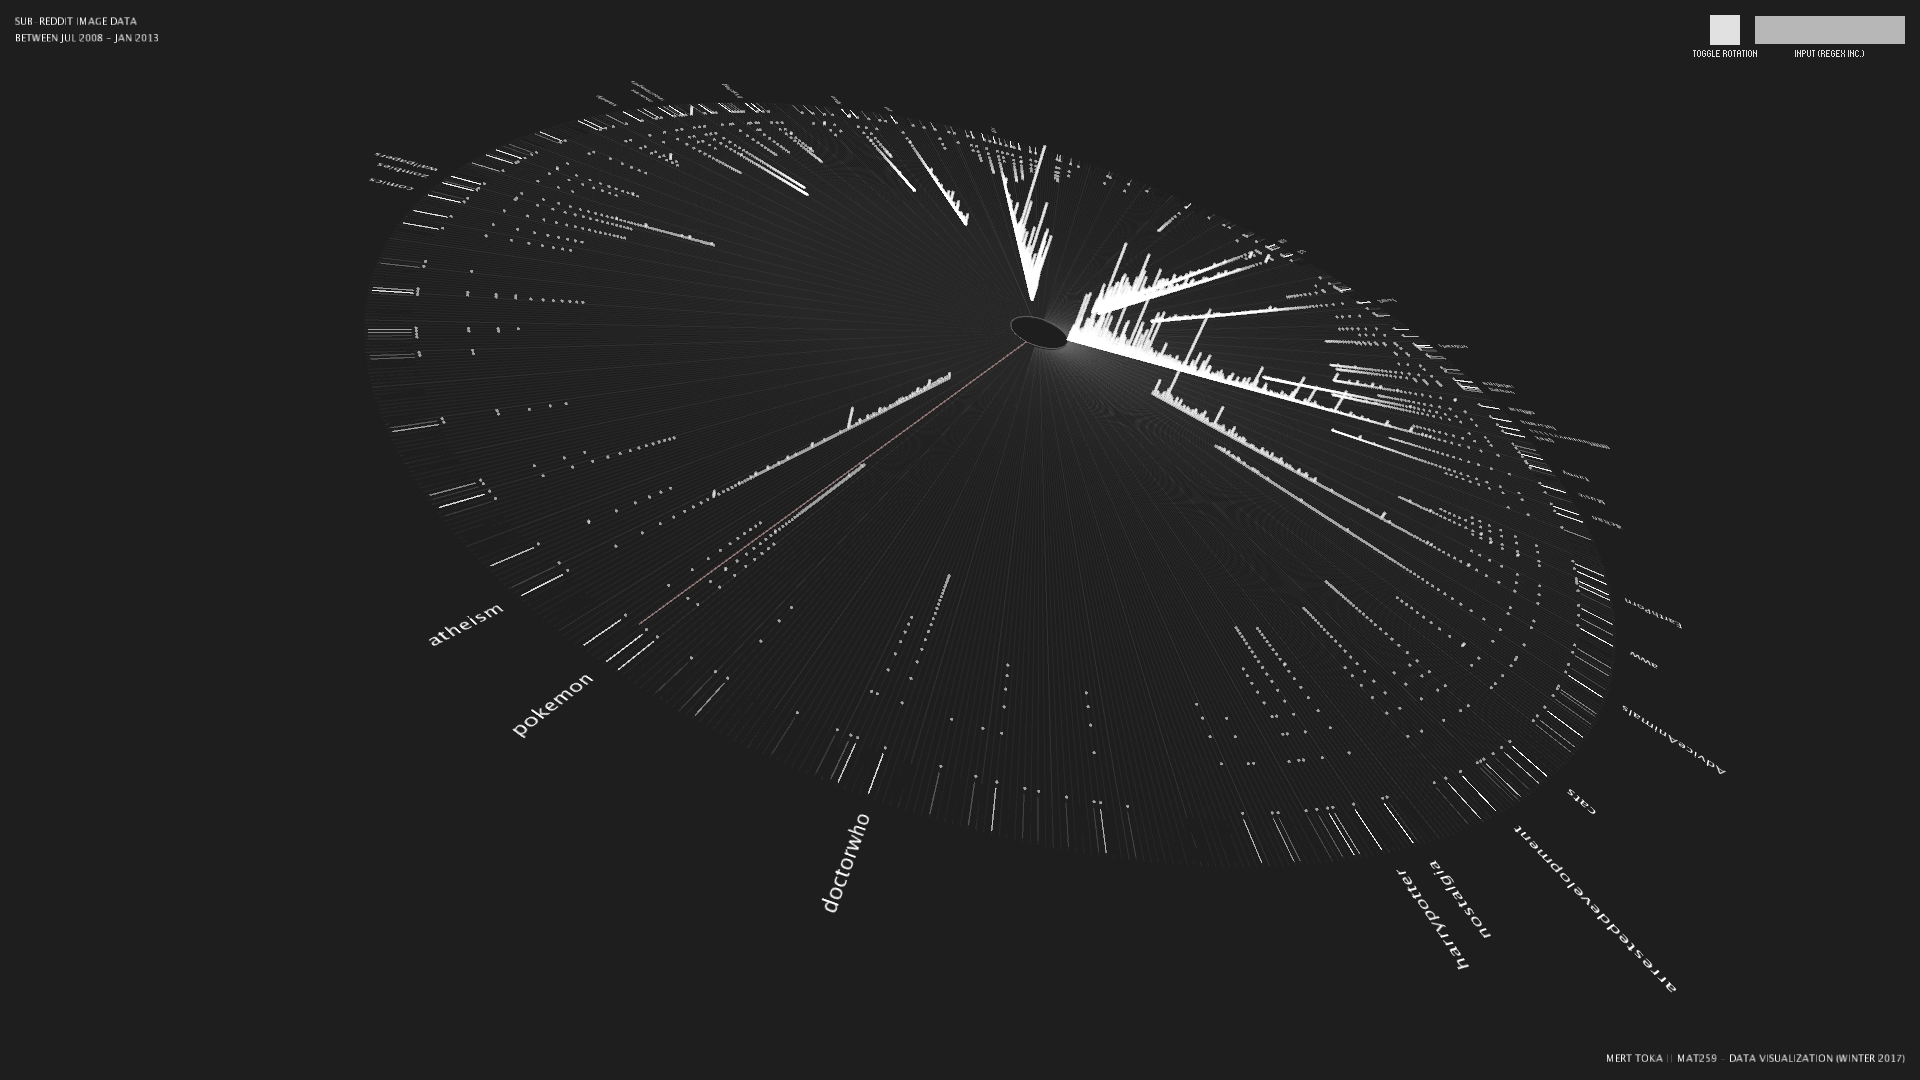
After finalizing the visualization, I have realized that a couple of
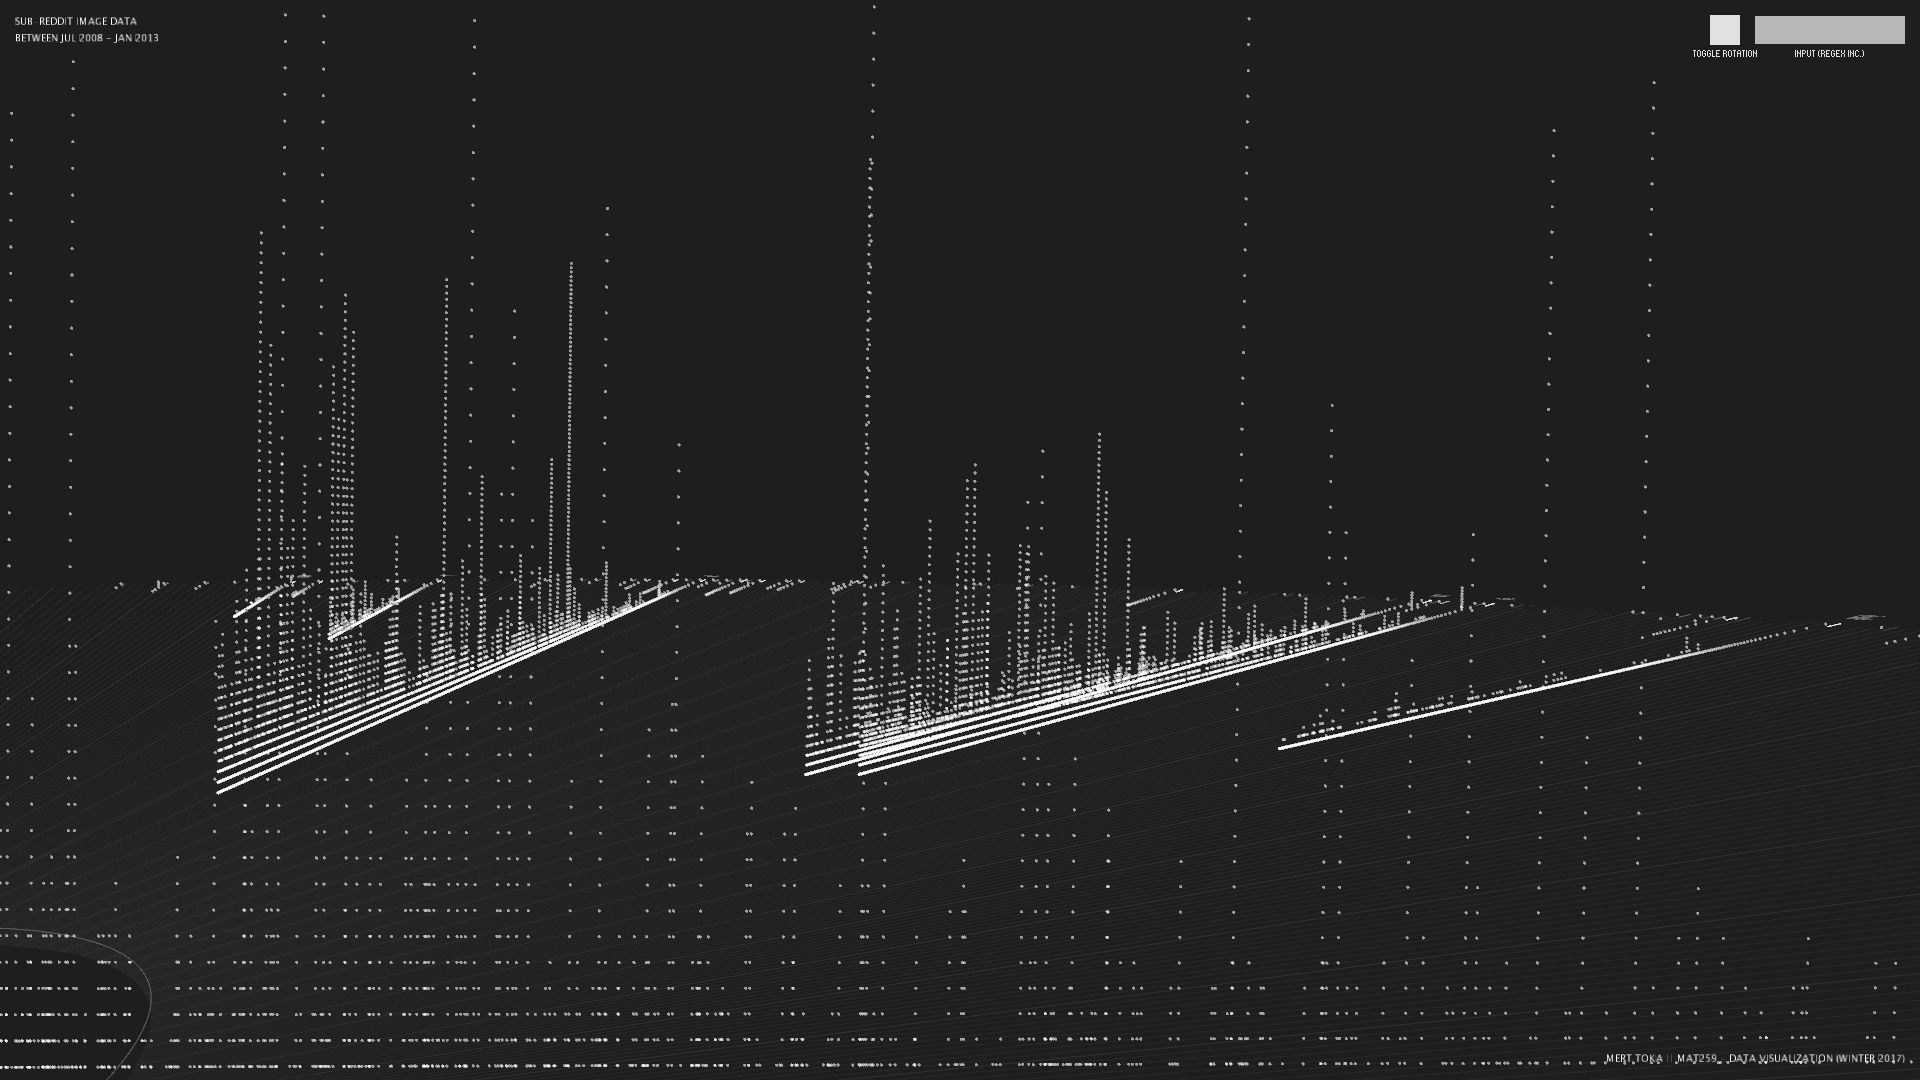
Another point can be deduced after examining the visualization is that the popularity of a
subreddits are dominating in terms of the popularity of images in this dataset. The dominating subreddits are mostly internet meme hosts, such as funny, pics, WTF and gifs, which might result in an expected amount of images inside. However, another possibility of this domination could also easily be the sampling methodologies of the source of the dataset.
Another point can be deduced after examining the visualization is that the popularity of a
subreddit is enhanced by some users, who have a comparatively greater amount of uploads to that subreddit. In other words, if there is a highly active user in a subreddit, there is a greater chance for that subreddit going viral and gaining, even more, visits.
Code