RESEARCH TRAJECTORIES: UCSB Graduate Research Trends
MAT 259, 2017
Sara Lafia
Concept
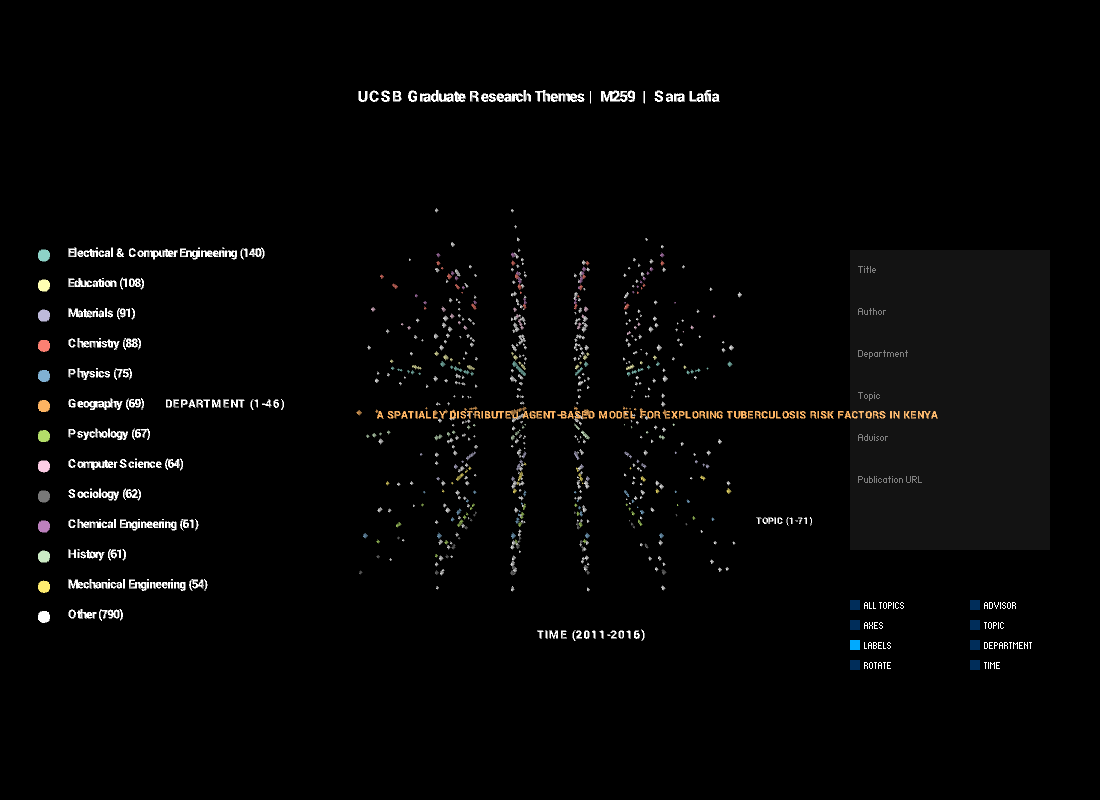
This project exploits the semantics of graduate student research by classifying theses and publications into research topics, based on their free-text descriptions. This visualization provides an alternative view of research trajectories at UCSB; rather than siloing graduate research by department, as most research is reported, a treemap visualization of topics is employed, showing thematic groupings over time.
Query
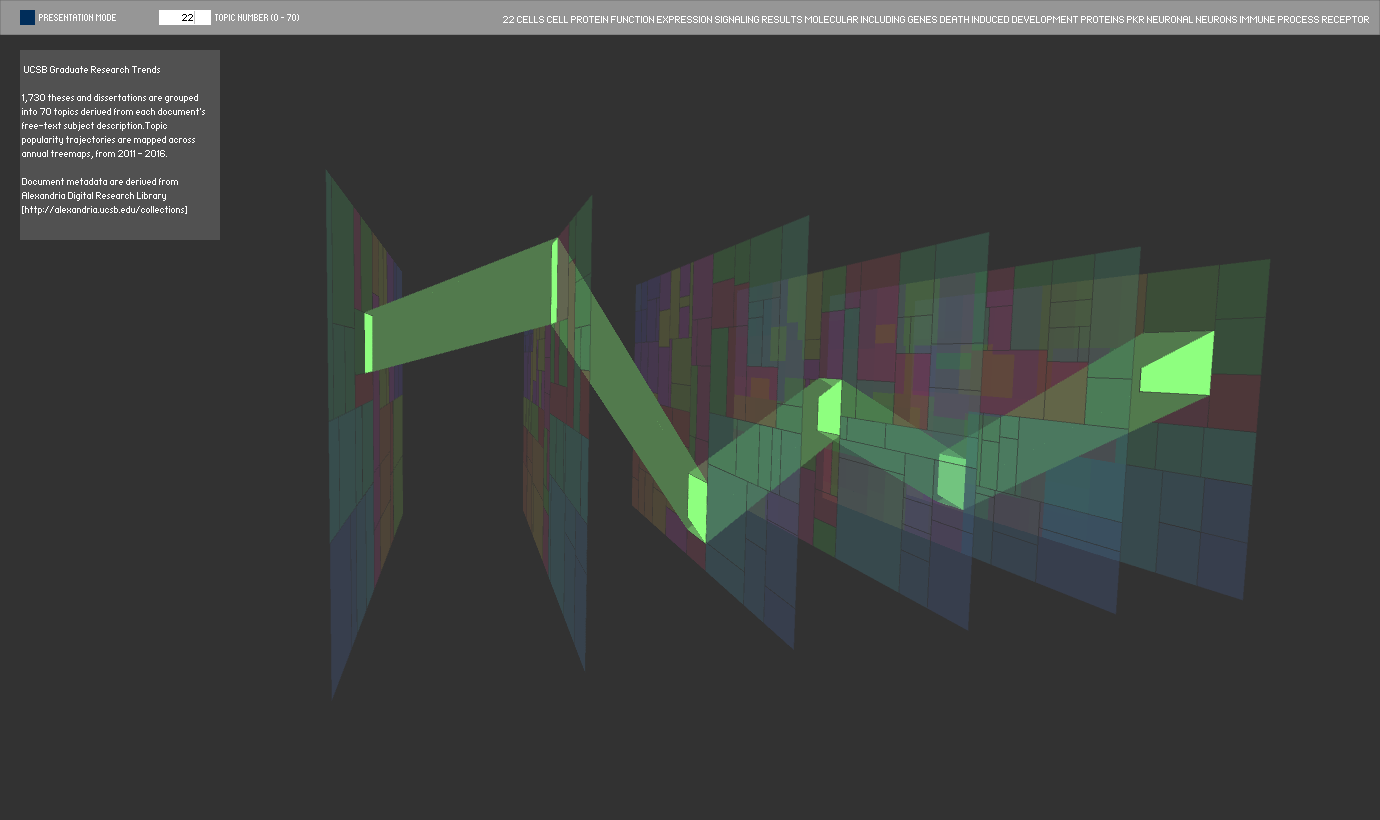
The data were obtained by scraping the Alexandria Digital Research Library using several Python libraries, including Beautiful Soup. This was done in the absence of a dedicated API or other means of bach downloading document metadata. Permission to access and publish the data online was obtained from the UCSB Library. The data, which are graduate student theses and dissertations, are those which have been made available through an open access agreement. The fields obtained for each document include: Title, Year, Author, Department, Degree Supervisor, and Description. This script returned records for the 1,730 theses and dissertations completed from 2011-2016, which were loaded into a csv table.
Process
The first version of this treemap series showed change in publication counts over time by university department. This was not particularly insightful, as the treemap hierarchy makes larger departments, such as engineering, more visually salient, dwarfing smaller research units, such as art.
Final result
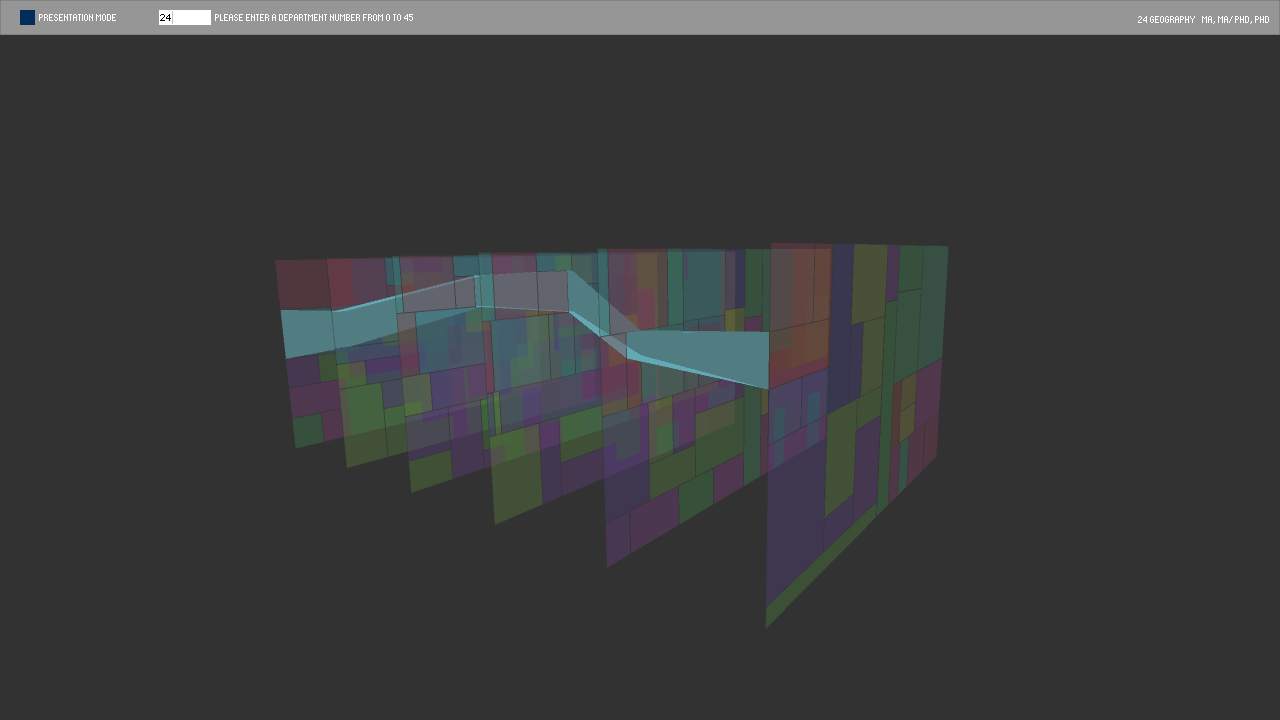
LDA topic modeling was applied to the document descriptions, using the MALLET tool, to create thematic groupings. An optimal number of topics between 30 and 100 was tested; the best fit was 70 topics. Each document is thus assigned to its most probable topic, which are coded from 0 to 70. The area of each square in the treemap translates to topic document quantity. A cluster tiling algorithm is applied to the topics to configure them into a planar, space-filling map, which changes based on a topic’s area over time. Tracking the movement of the square in the time slices is thus a proxy for assessing the change in thesis or dissertation counts for each department for each of the 70 generated research topics.
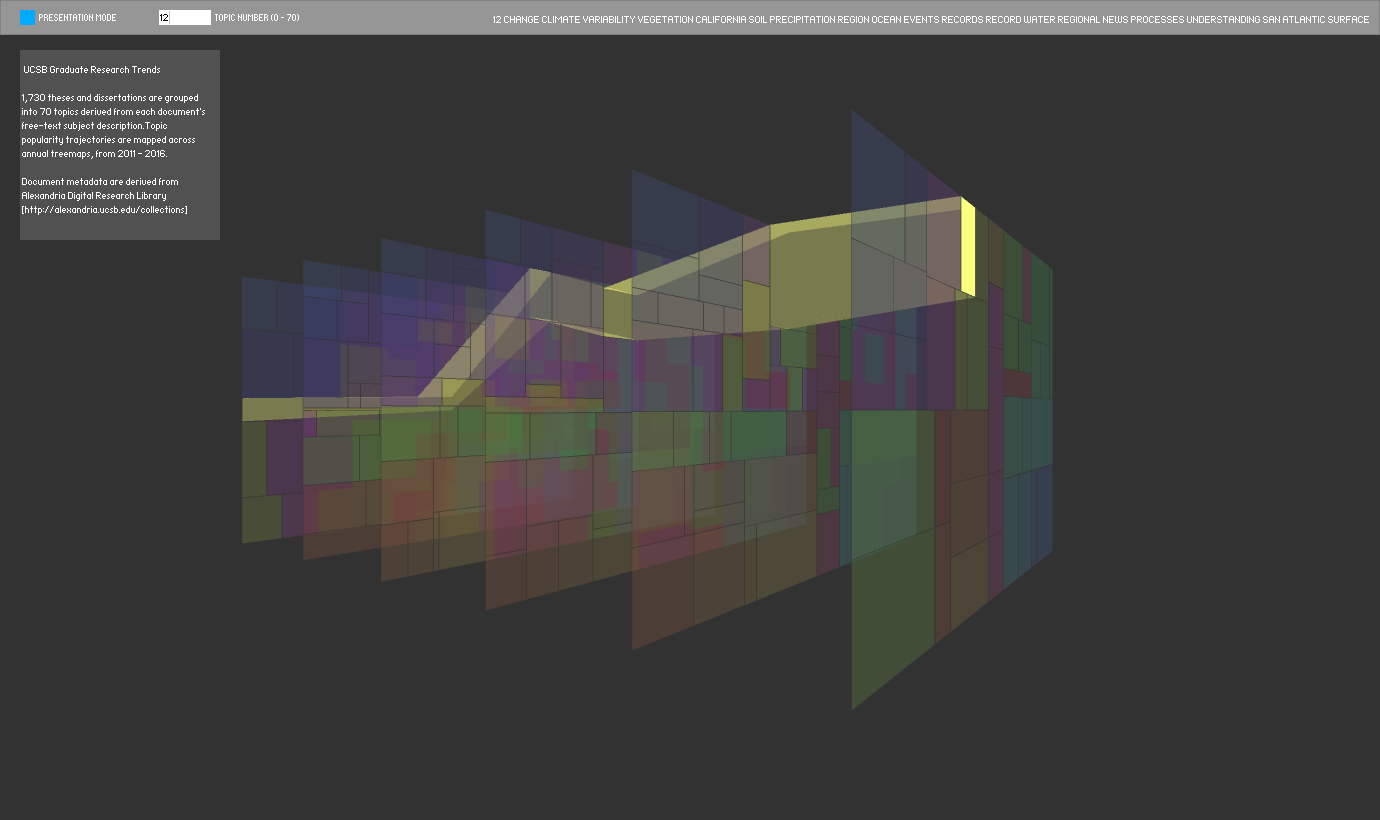
Several interesting trends are visible. Research areas, such as work done on climate, appear to increase slightly in volume in more recent years. However, there is a lag in research, so such conclusions should be drawn with caution. The university library, particularly the IRC, would be interested in this visualization as one of several research outputs. Displaying this visualization in such a space would facilitate discovery of research happening across campus that transcends academic boundaries. Grouping the documents by topic, rather than department, is a first step toward this goal.
Several interesting trends are visible. Research areas, such as work done on climate, appear to increase slightly in volume in more recent years. However, there is a lag in research, so such conclusions should be drawn with caution. The university library, particularly the IRC, would be interested in this visualization as one of several research outputs. Displaying this visualization in such a space would facilitate discovery of research happening across campus that transcends academic boundaries. Grouping the documents by topic, rather than department, is a first step toward this goal.
Next Steps
As this is related to my ongoing research to apply spatialization frameworks to non-spatial information, future work could track a variety of other relationships, such as advisor-student collaborations or cross-disciplinary collaboration. This visualization, while interesting for a high-level view of university level productivity and trends, is not particularly granular, although the data obtained are far more detailed. Combining both department and topical views of research could allow for further exploration of individual documents as cells clustered within the treemap.
Code