Digital Skyline
MAT 259, 2016
Chris Chen
Concept
This concept came to me as a result of different experiments. I knew from the beginning that I wanted to highlight the time aspect of a dataset, focusing on the checkout and check in times of various items. I started to think about exactly the extra dimension
afforded me when designing for a 3D environment. I thought there was no better way to show the scale and volume of data than a kind of inhabitable area. The city-like design is immediately recognizable and familiar because it draws on something
we culturally know very well - the urban sprawl of modern metropolises. The final idea, then, was to translate something so abstract like this dataset into a visually and thematically cohesive representation.
Query
SELECT title, itemNumber, DATE(cout), TIME(cout), DATE(cin), TIME(cin) FROM inraw WHERE year(cout) > 2004 AND title LIKE "%cyber%" OR title LIKE "%digital%" OR title LIKE "%virtual%" GROUP BY cout, itemNumber ORDER BY cout
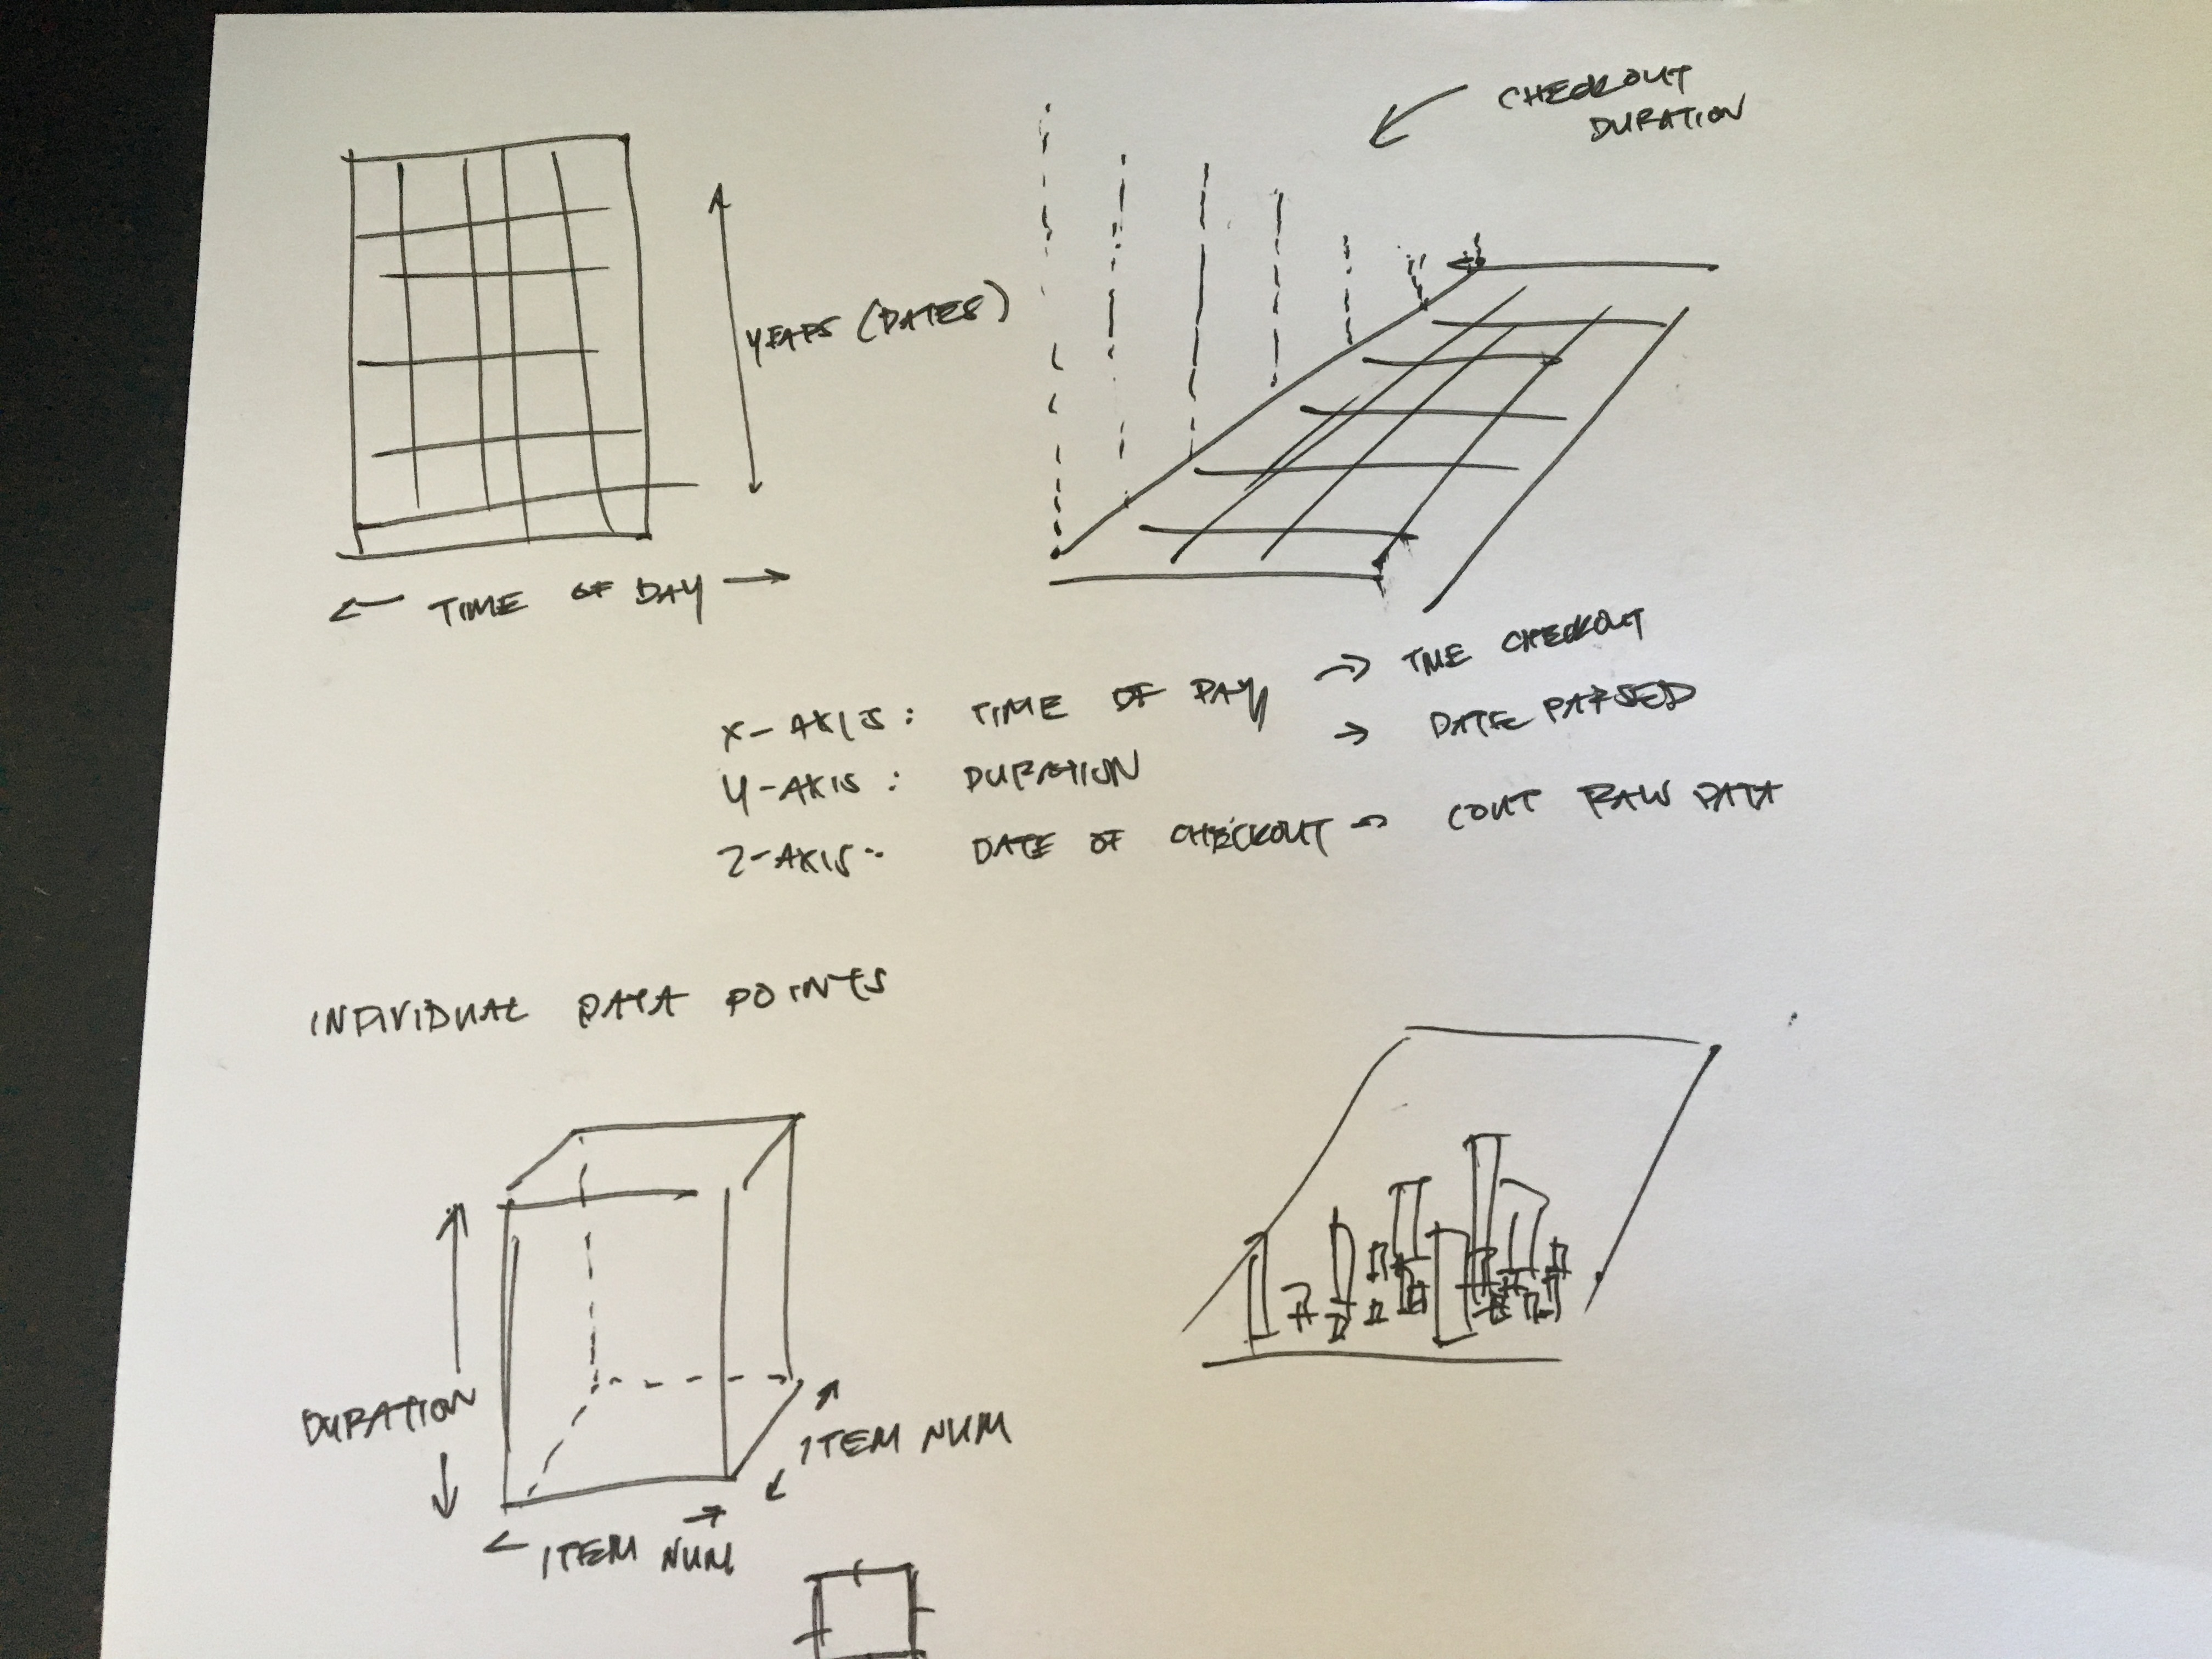
Preliminary sketches
My first sketches varied in their approach to representing such a concept. First was settling on which axes represented the three different aspects of time. Eventually I settled on the x-axis focusing on the time of day of the checkout, y-axis focusing on the duration of checkouts, and finally the z-axis focusing on the date of the checkout. I also had to consider the individual bars themselves. The height obviously corresponded with their checkout duration but I also adjusted the width and depth of the bars to correspond with their individual item numbers.
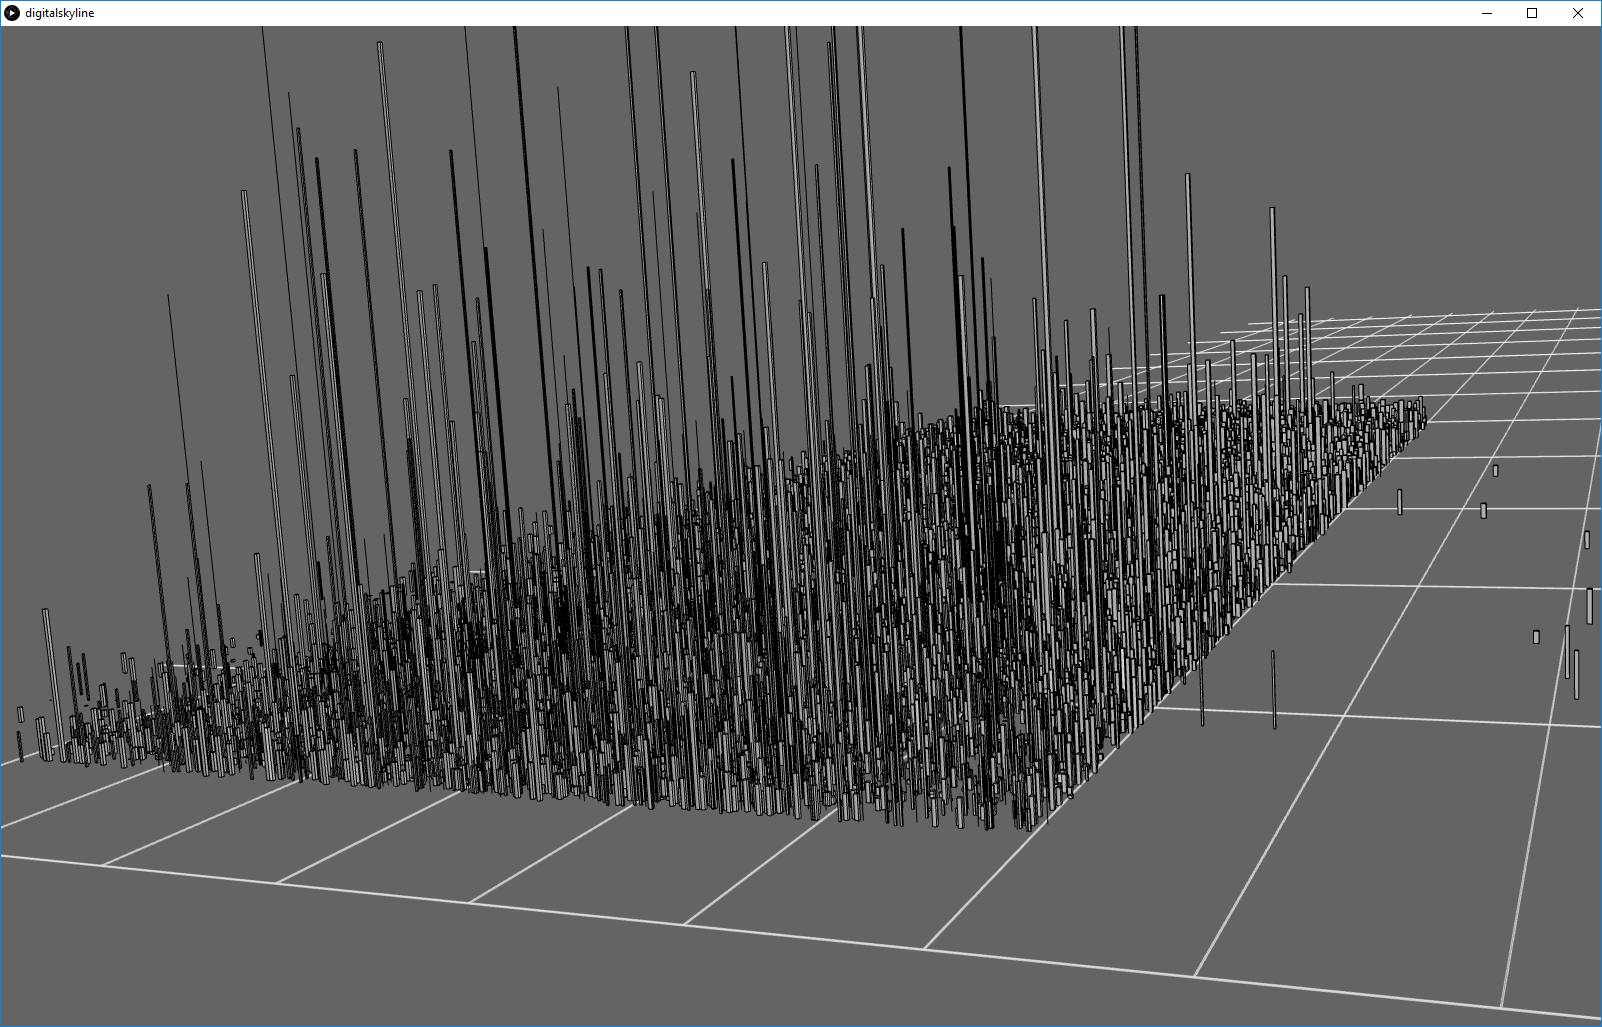
Process
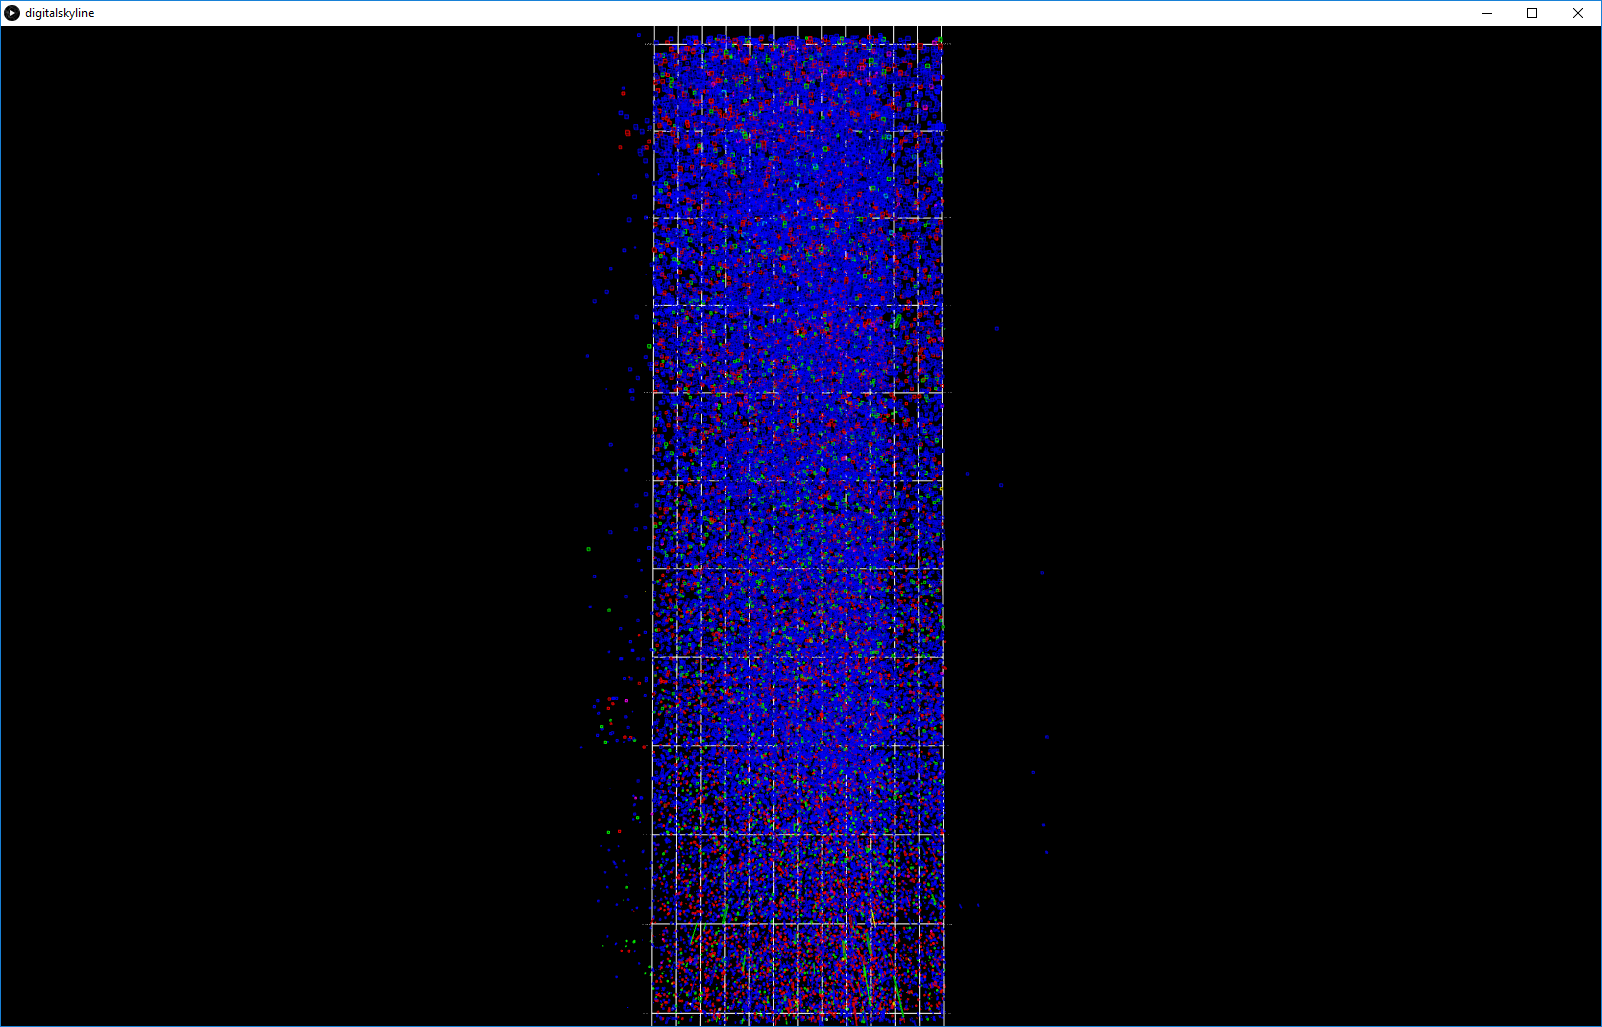
I first focused on getting the right framework set up: the axes and the methods to draw the various data entries (including the color elements, height, width, depth, etc). Adjustments were also made to create the right feel, especially since the environment was navigable and could be viewed from many angles thanks to Peasycam. To add legibility, I added a grid with the x- and z-axis measurements. I tried briefly an attempt to label the y-axis but it detracted from the overall design.
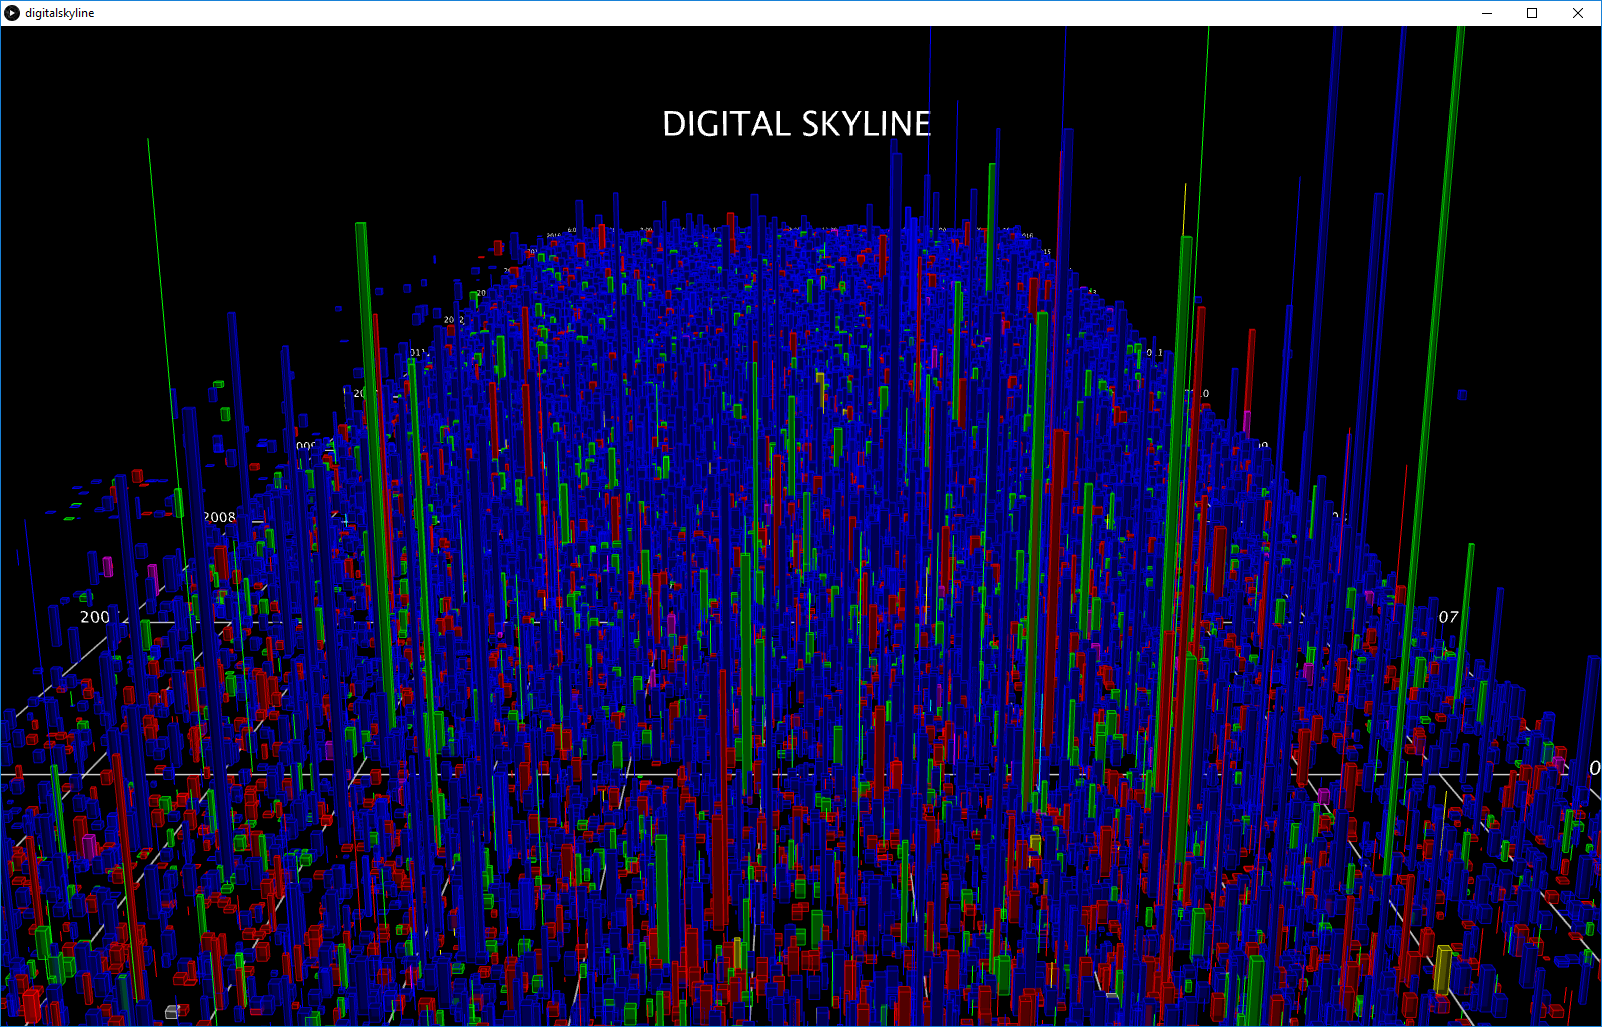
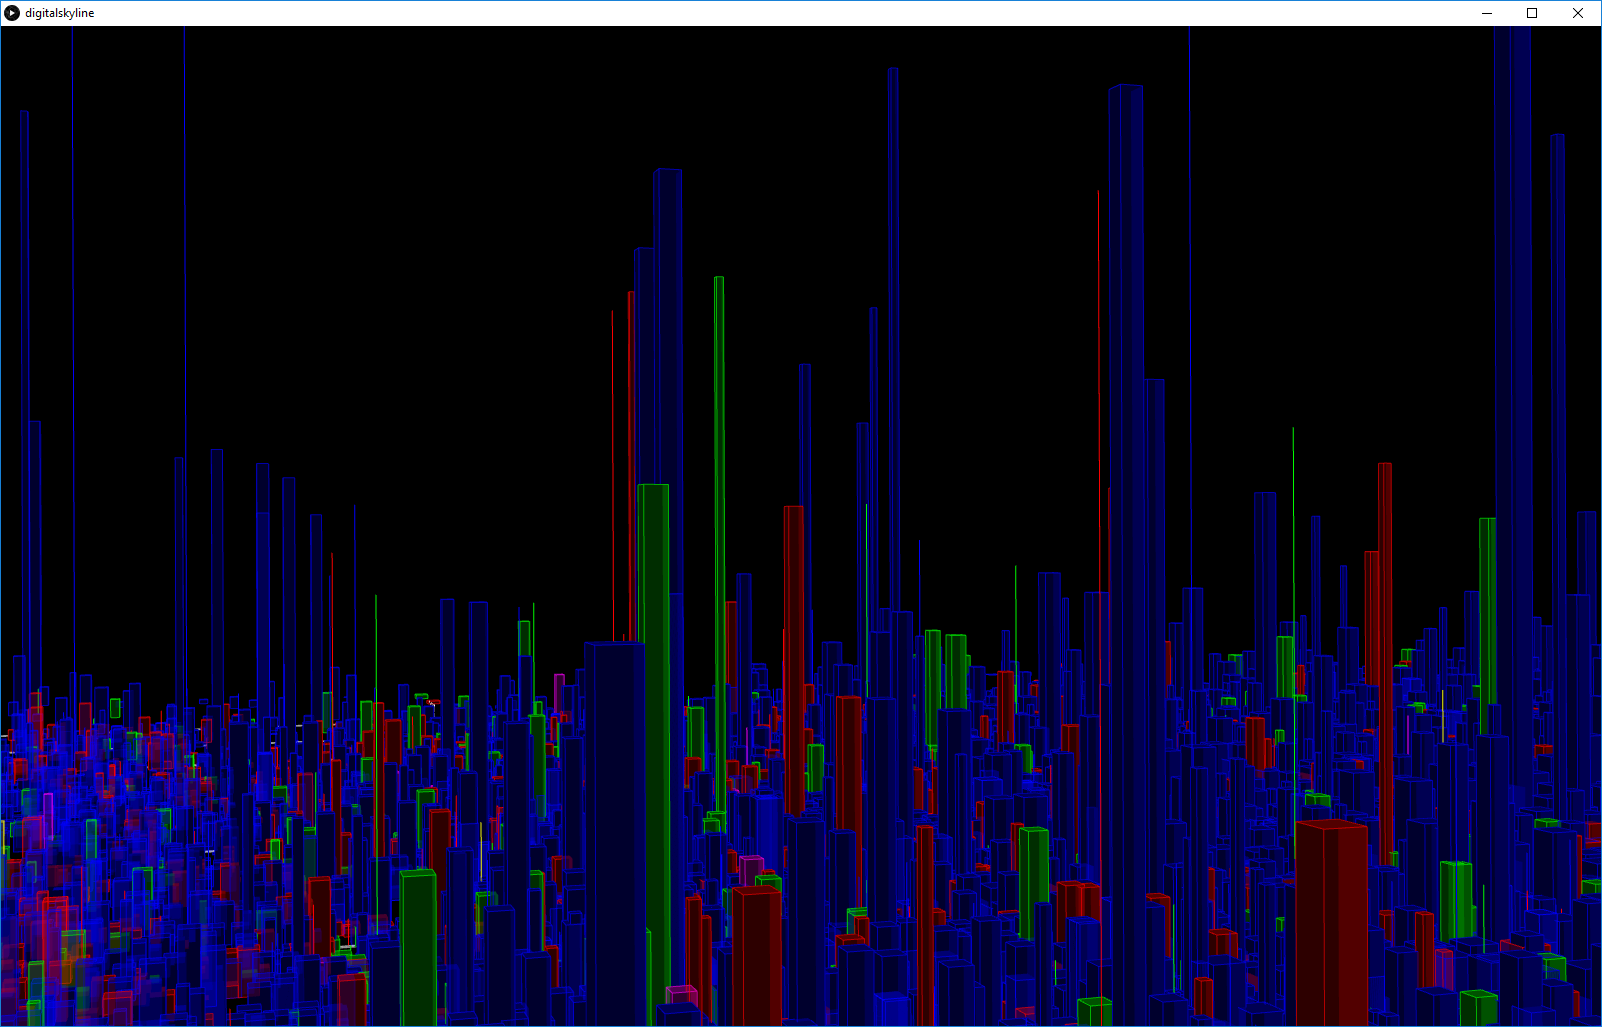
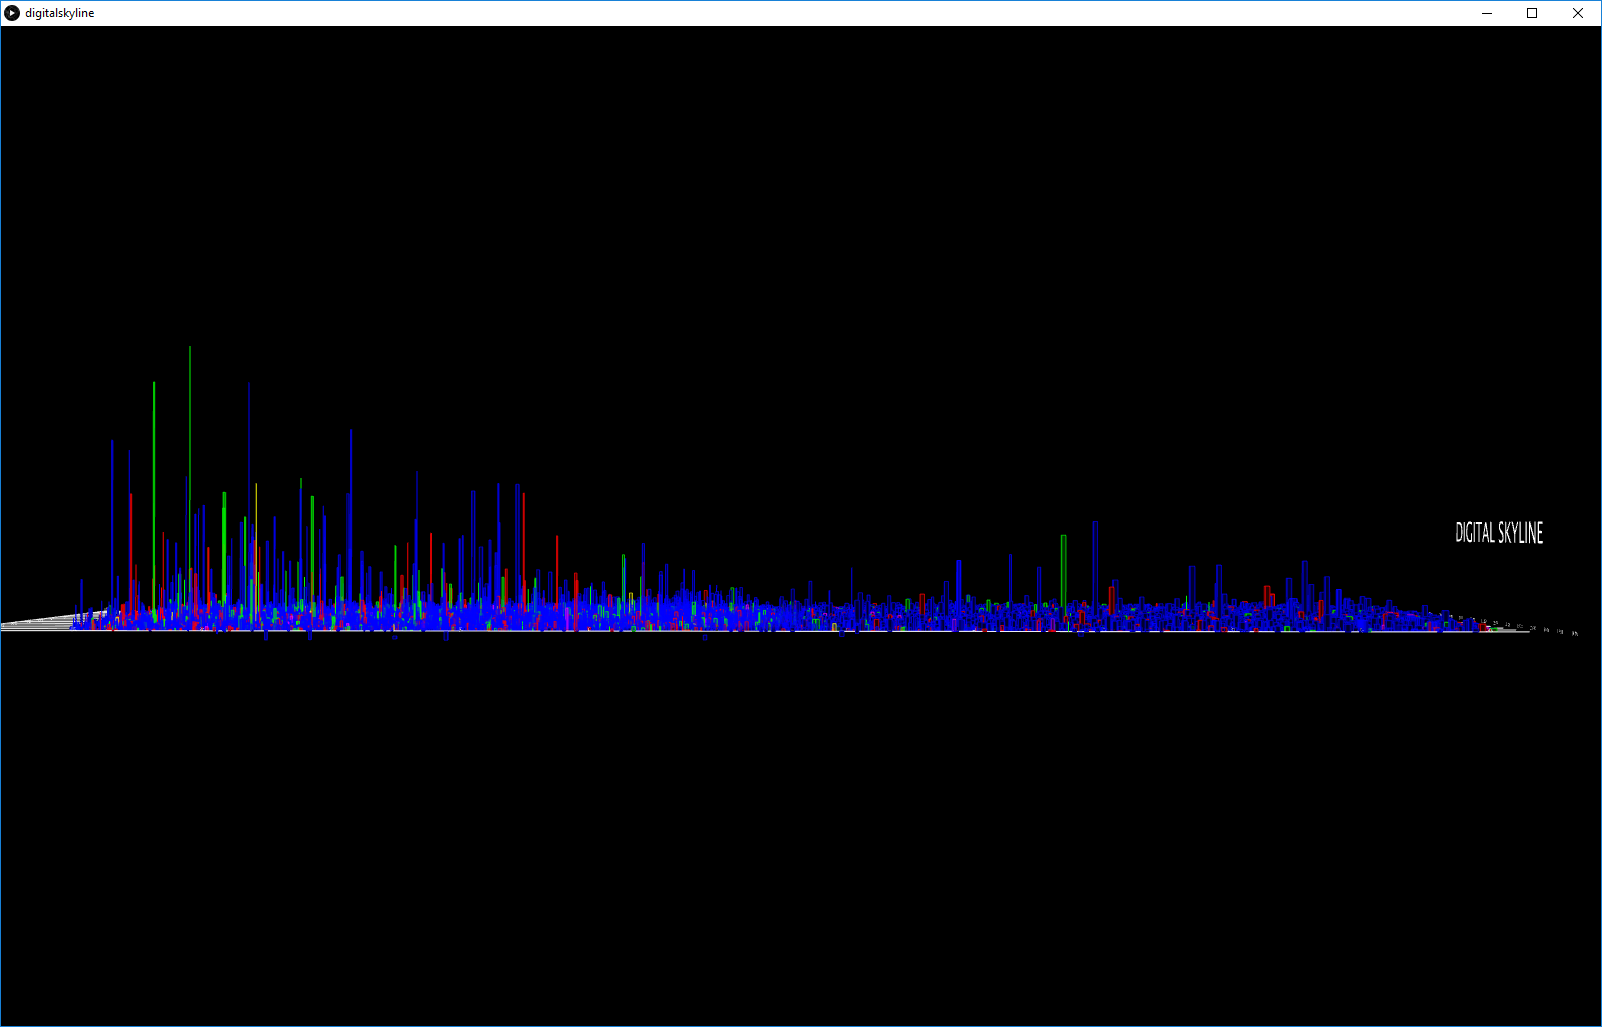
Final result
The end result is an attempt to capture the intracies and volume of data about time, while maintaining a cohesive thematic and visual aesthetic - the focus was not just on creating a visually compelling visualization but one that felt compelling while navigating through the digital city of data.
Evaluation/Analysis
The third dimension that was showcased in this project proved to be a challenging but rewarding one - the lack of limitations in this 3D space was daunting as the sheer possibilities and different options proved to be overwhelming. That said, technical considerations also played a large part of this project. While creating the project, I found the spatial considerations an interesting element. At the same time, I'm not sure my visualization represented any especially distinct trends or patterns. Although I wish I had paid a little more attention to this aspect, I'm not quite sure I would still maintain the central theme and goal I had from the beginning.
Code