Word Temperatures
MAT 259, 2016
Mert Toka
Concept
In this assignment, I wanted to explore the relationship between historical weather data of Seattle and check out information about the Library. By doing so, I wanted to question whether there is a correlation between the semantic meaning of the word and its average temperature values.
Query
I started everything by acquiring the historical weather data for Seattle, which is downloaded from National Oceanic and Atmospheric Administration(NOAA)'s Surface Data Hourly Global dataset (link). The dataset contains entries starting from 2005 April and extends up to today. After getting rid of unnecessary columns, I ended up with the following dataset:
DATE: Date of current item,
TIME: Time of current item,
DIR: Wind direction (0,360), 0 is North,
SPD: Speed of the wind in mph,
TEMPF: Temperature in F,
TEMPC: Temperature in C,
SLP: Sea Level Pressure
The data can be found in data folder of sketch as weather_05_17.csv
After that, I retrieved items in the library and concatenated their Subject fields for each 6-hour period. This query took 5 hours in total and since single query that covers 2005 and 2017 timeouts, I had to query 6 month intervals and stitch resulting CSV files together. Resultant CSV file and the query as follows:
I, then, preprocessed this document in Python in order to get frequencies of each word in subject fields. While doing that, I utilized stemming and lemmatization module of NLTK library (website), which reduces inflectional forms and sometimes derivationally related forms of a word to a common base form (i.e. cars becomes car). This process gave me a list of words with their frequencies for the given time period. The code (getFrequencies.py) and resulting CSV (nltk_05_17.csv) are in data folder of sketch.
After that, I retrieved items in the library and concatenated their Subject fields for each 6-hour period. This query took 5 hours in total and since single query that covers 2005 and 2017 timeouts, I had to query 6 month intervals and stitch resulting CSV files together. Resultant CSV file and the query as follows:
	SELECT
		DATE(sth.checkOut) 'date',
		HOUR(sth.checkOut) 'hour',
		COUNT(*) 'count',
		GROUP_CONCAT(sth.subject
			SEPARATOR '\n') 'subjects'
	FROM
		(SELECT
			s.bibNumber, s.subject, t.checkOut
		FROM
			spl_2016.transactions t
		JOIN spl_2016.subject s ON s.bibNumber = t.bibNumber
		WHERE
			t.checkOut >= '2005-04-19'
				AND t.checkOut <= '2017-01-01') AS sth
GROUP BY DATE(sth.checkOut) , FLOOR( HOUR(sth.checkOut) / 6)I, then, preprocessed this document in Python in order to get frequencies of each word in subject fields. While doing that, I utilized stemming and lemmatization module of NLTK library (website), which reduces inflectional forms and sometimes derivationally related forms of a word to a common base form (i.e. cars becomes car). This process gave me a list of words with their frequencies for the given time period. The code (getFrequencies.py) and resulting CSV (nltk_05_17.csv) are in data folder of sketch.
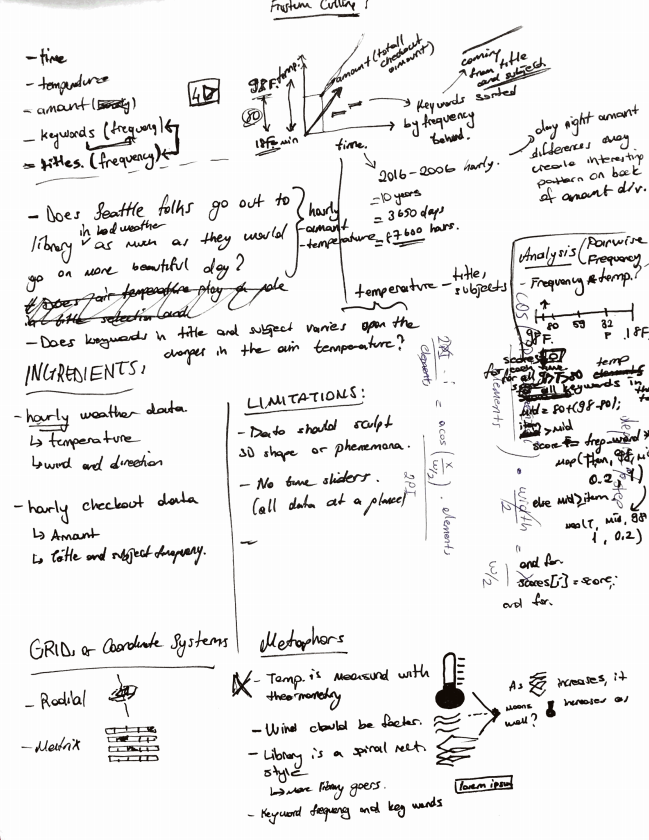
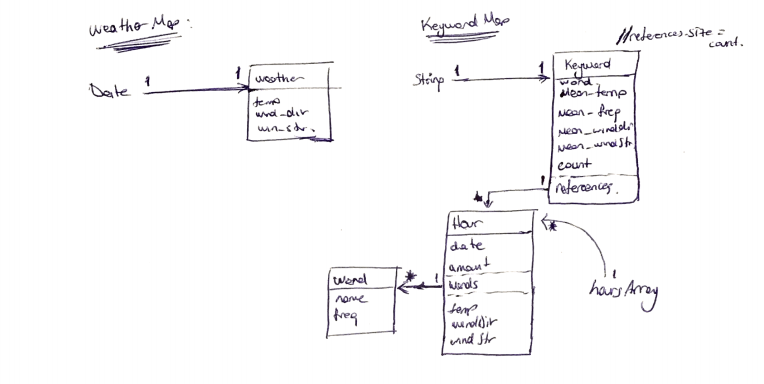
Preliminary sketches
Idea explorations and class diagram is below.
Process
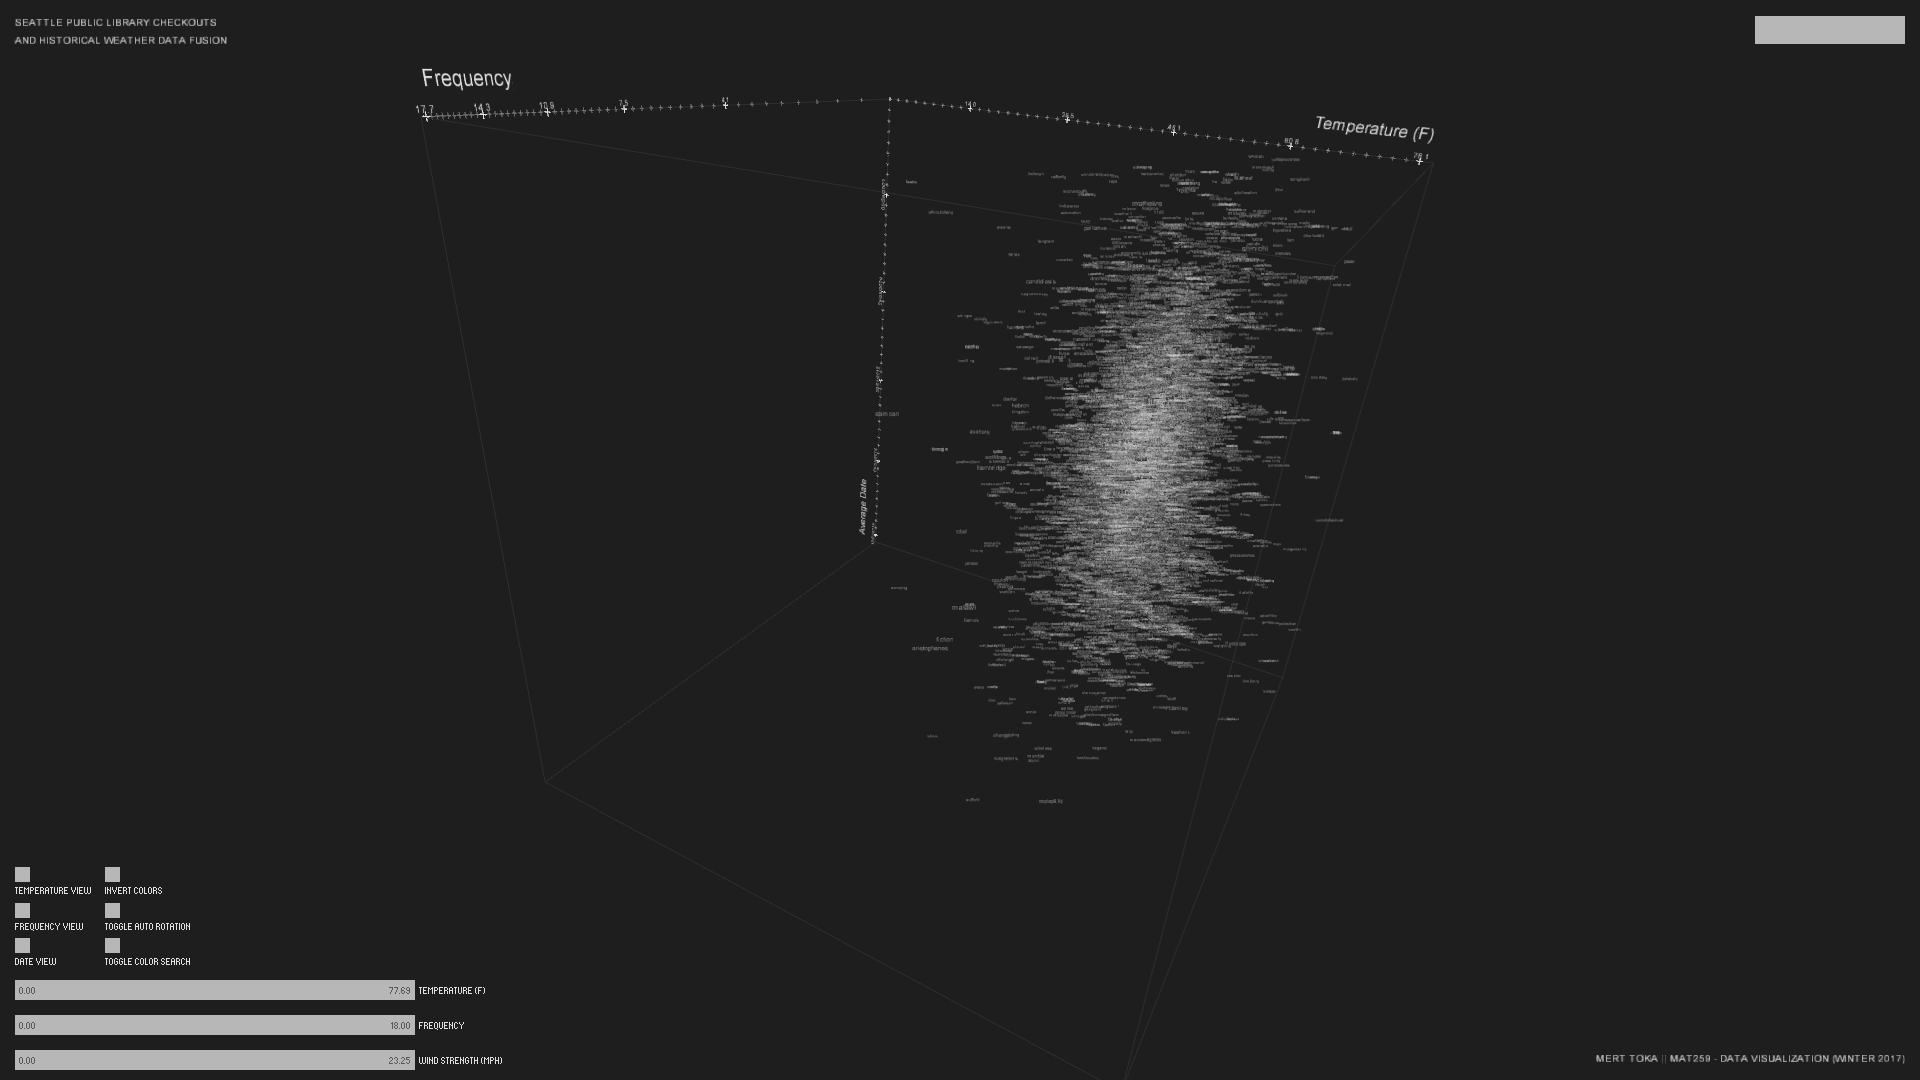
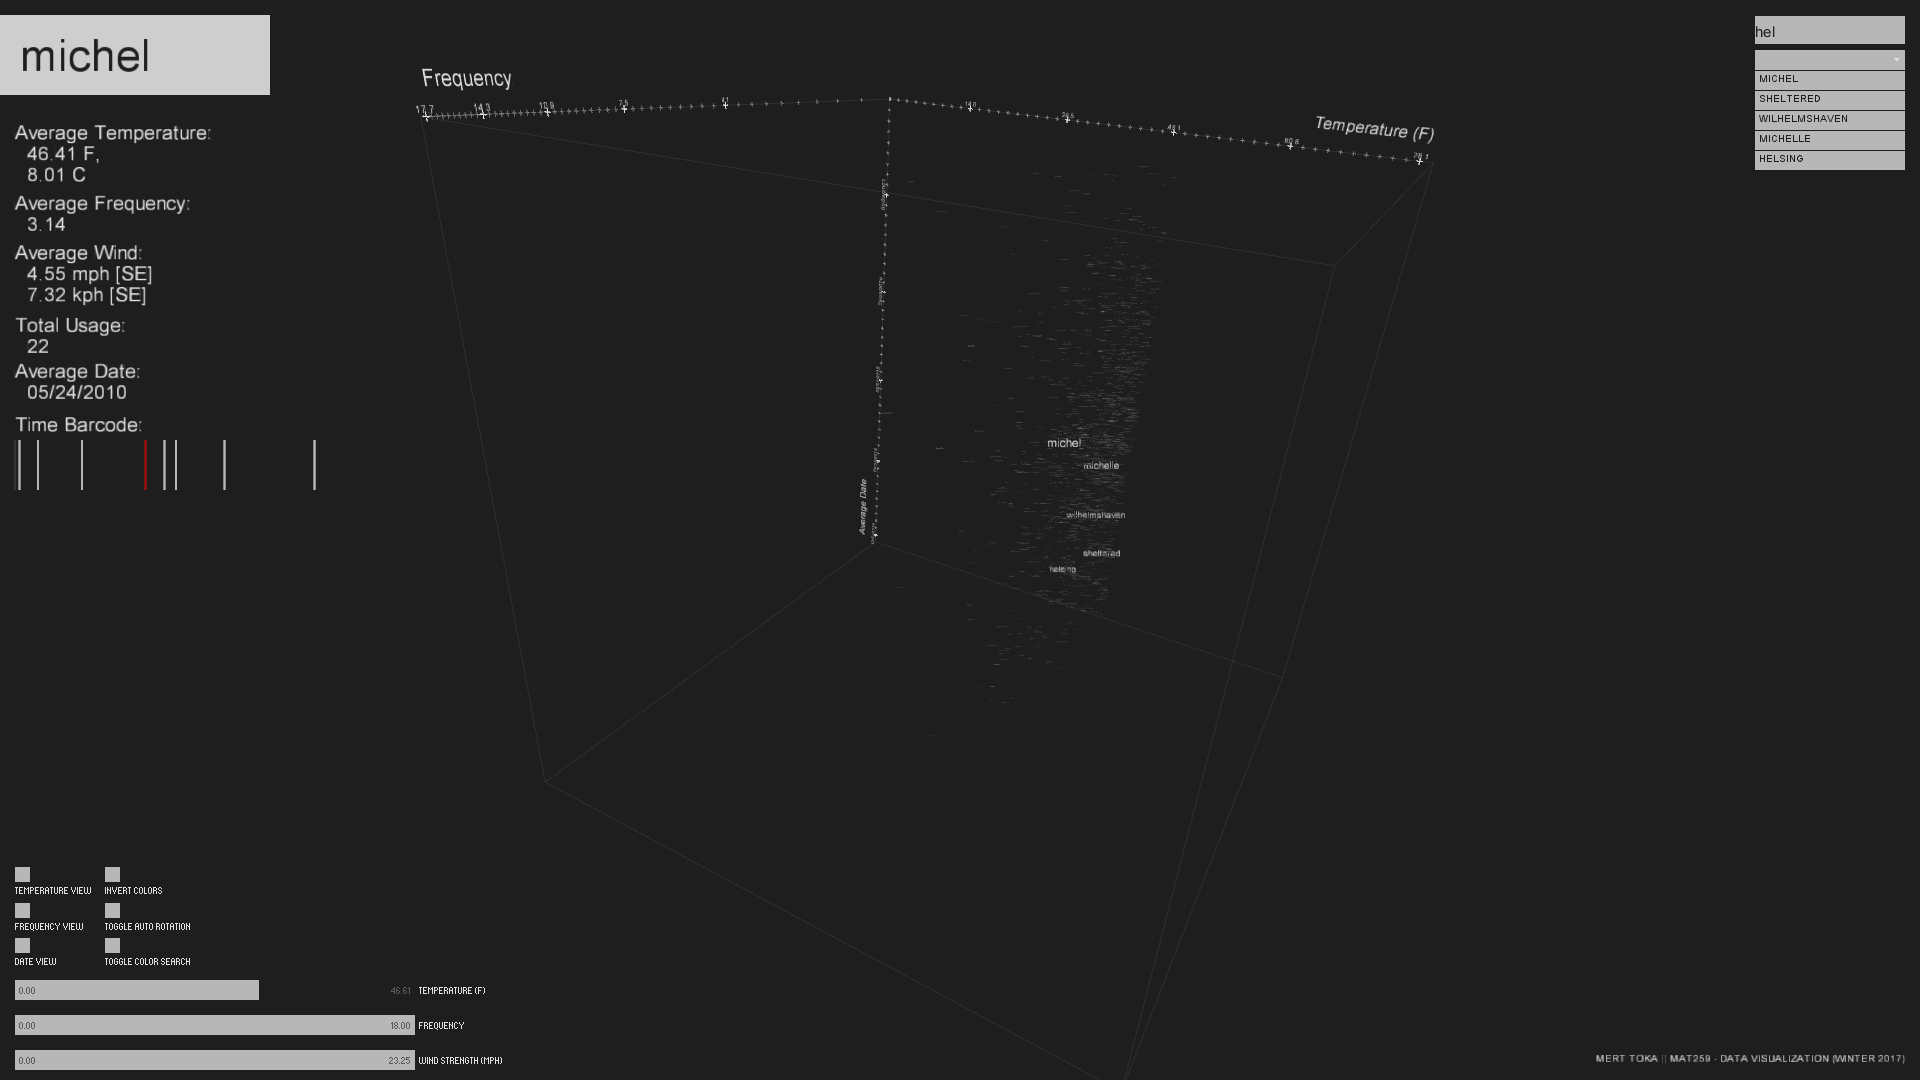
Keyword class in the diagram keeps related information about each of the words, and the code keeps a collection for unique keywords by updating necessary fields if a duplicate occurs. Once file reading is completed, I sprinkled the word collection in space with respect to their Average Date, Average Temperature and Average Frequency values. Since frequency values are too condensed towards lower values, I used the log scale for that axis.
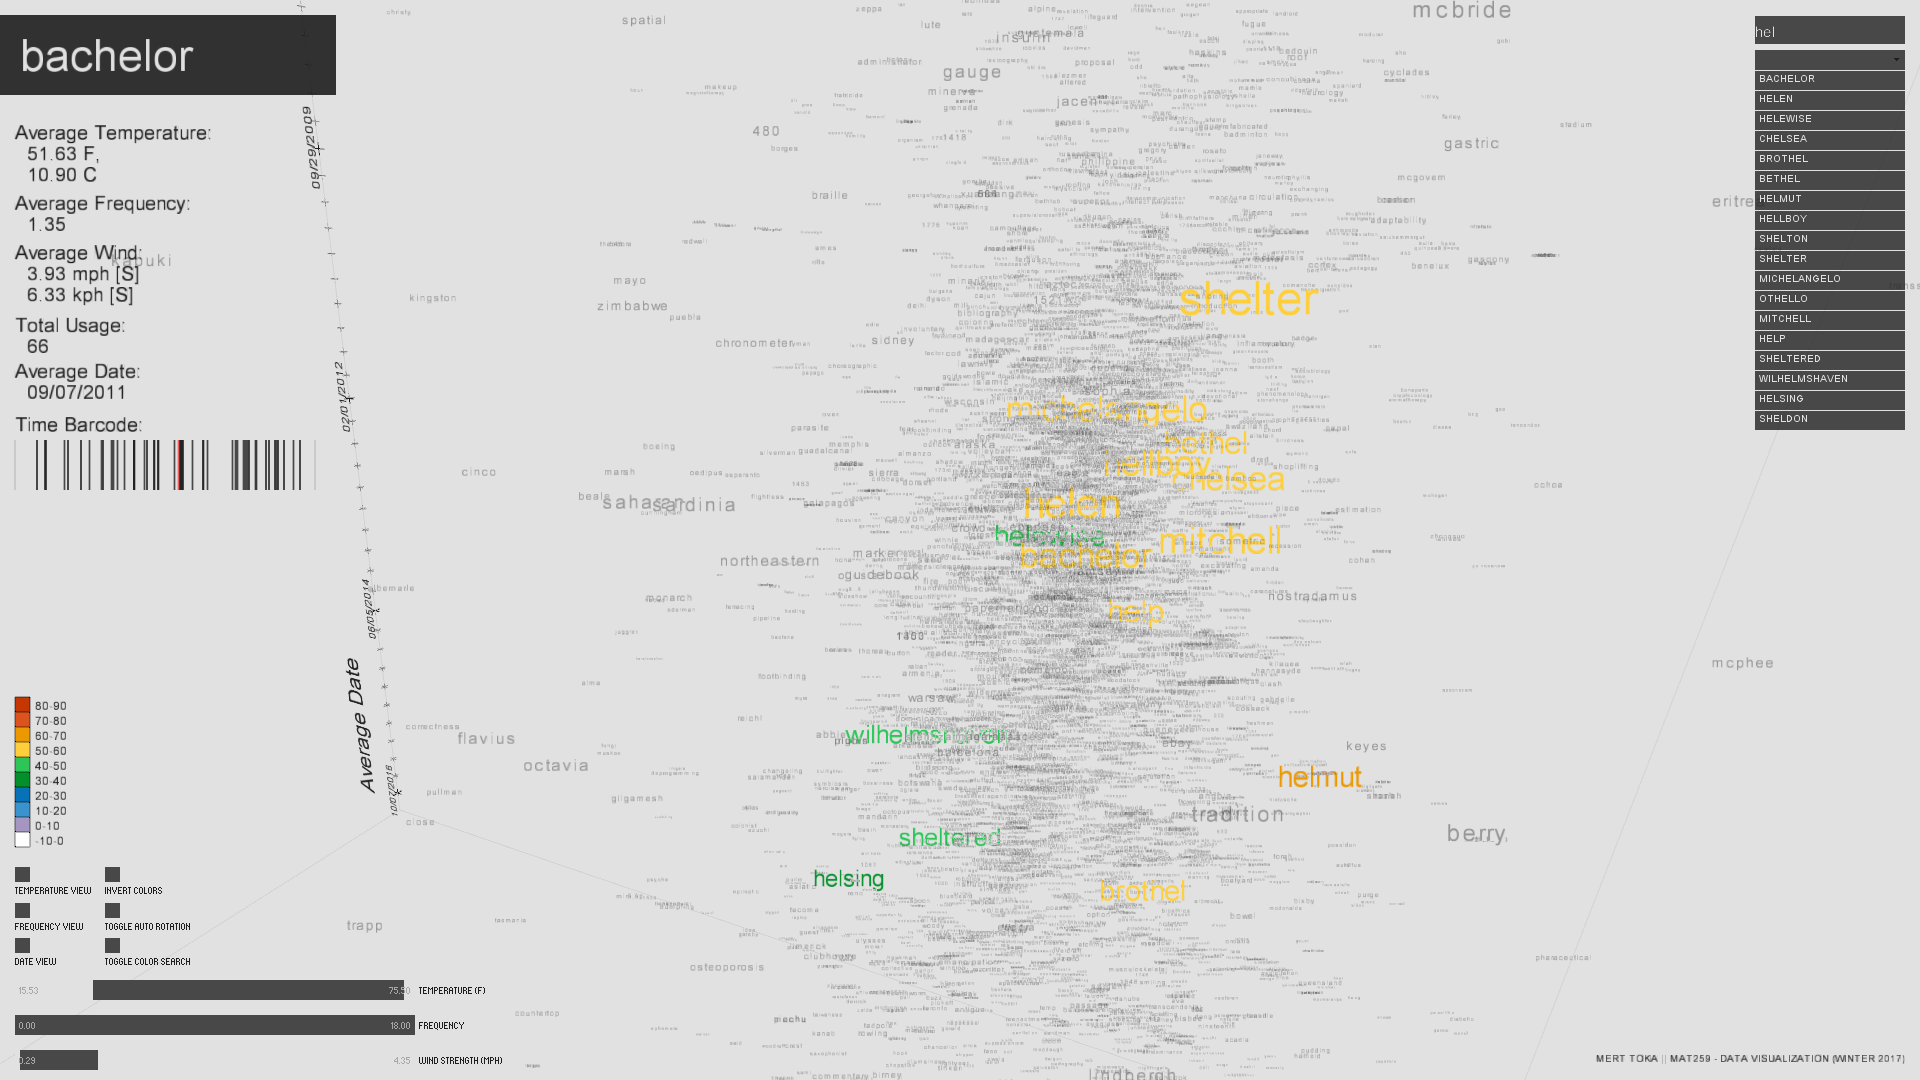
Whenever the user starts to type something with the keyboard, the system will search the phrase inside of the keywords (Regex is allowed: link). On the right-hand side of the GUI, the search results are listed, and on the left side, the first word of the list is detailed. Also in the word cloud, search results are highlighted. The Time Barcode shape at the detail panel denotes usage dates of the current word, and the red line corresponds to its Average Date. Time barcode starts from the beginning of the data on its left (2005 April) and goes up to January 2017.
In addition to these, it is possible to filter what's drawn inside the cube with sliders at the bottom-left.
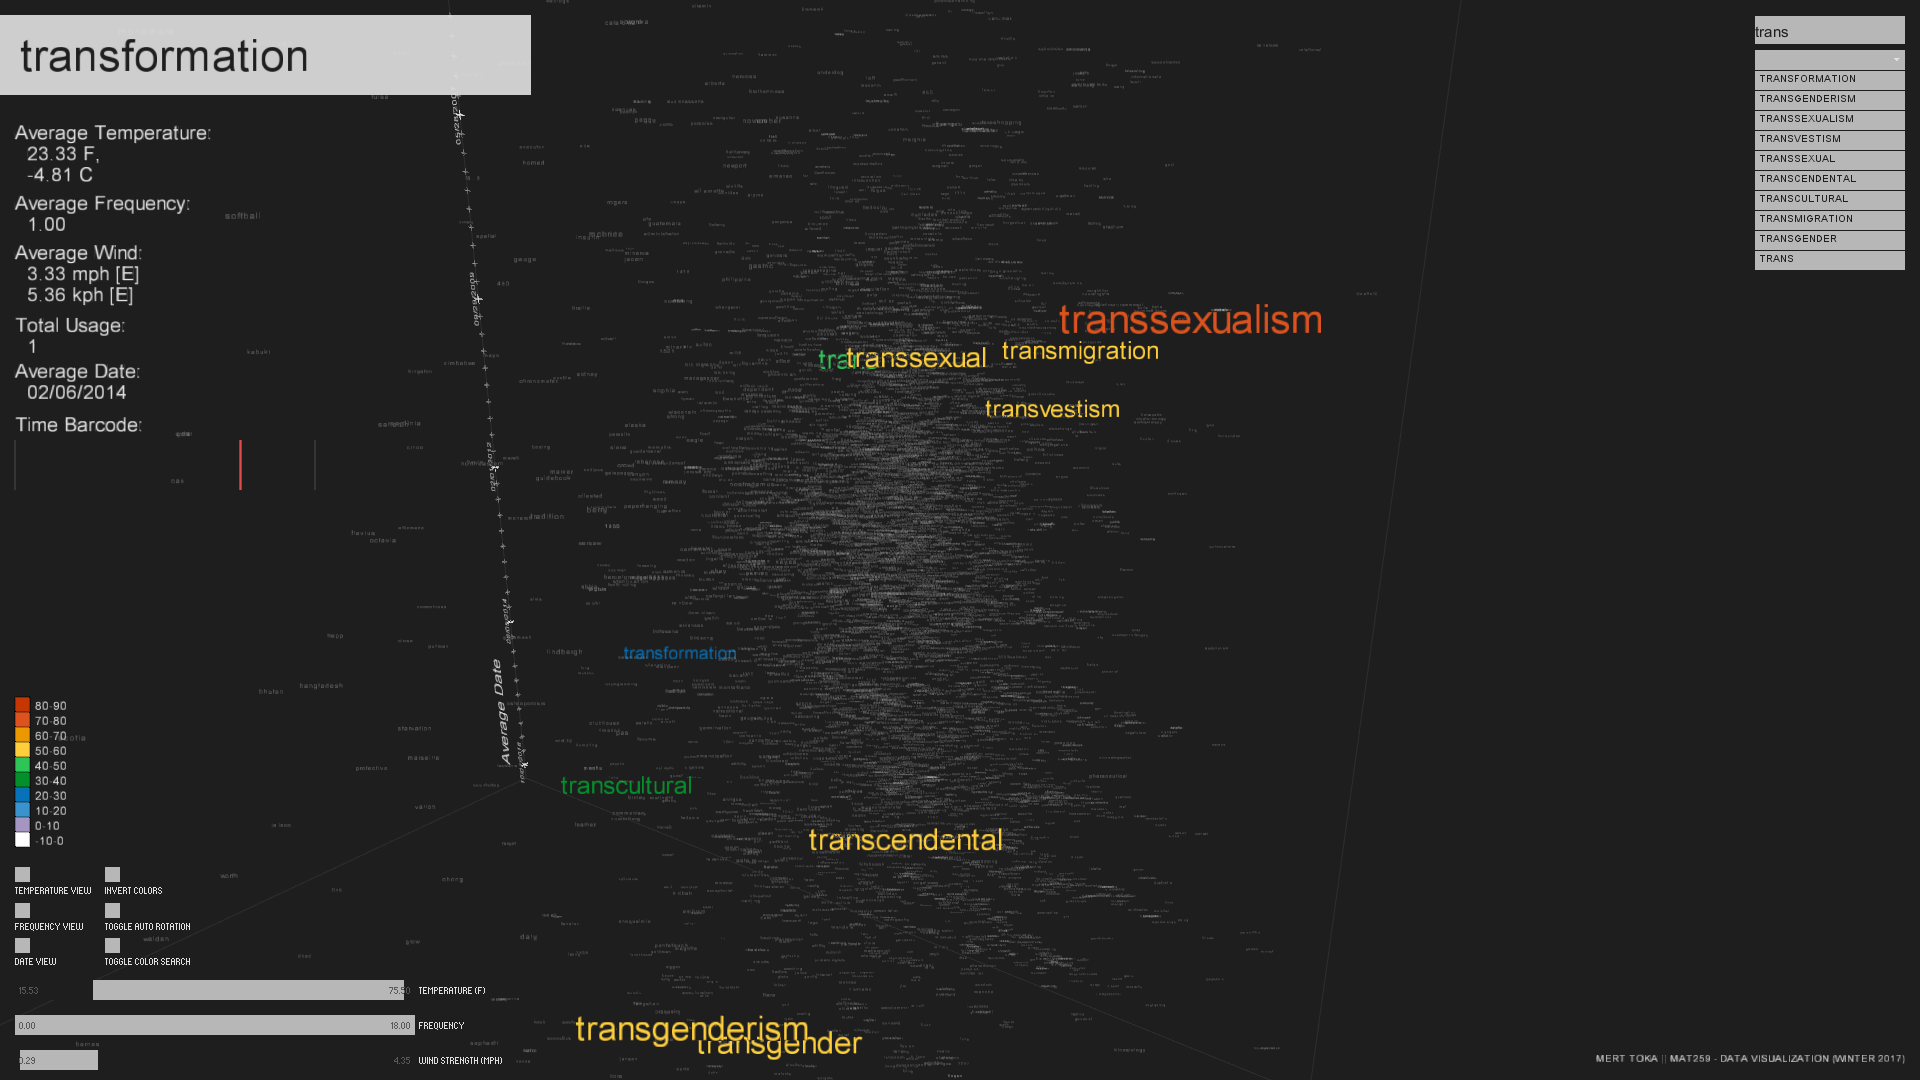
The left-most buttons focus the camera to a specific axis. Invert Colors option changes the color scheme from dark to light. Auto Rotation rotates the camera automatically, and Color Search option paints the words that are the result of the current search term in terms of their average temperature values.
Whenever the user starts to type something with the keyboard, the system will search the phrase inside of the keywords (Regex is allowed: link). On the right-hand side of the GUI, the search results are listed, and on the left side, the first word of the list is detailed. Also in the word cloud, search results are highlighted. The Time Barcode shape at the detail panel denotes usage dates of the current word, and the red line corresponds to its Average Date. Time barcode starts from the beginning of the data on its left (2005 April) and goes up to January 2017.
In addition to these, it is possible to filter what's drawn inside the cube with sliders at the bottom-left.
The left-most buttons focus the camera to a specific axis. Invert Colors option changes the color scheme from dark to light. Auto Rotation rotates the camera automatically, and Color Search option paints the words that are the result of the current search term in terms of their average temperature values.
Final result
Evaluation/Analysis
After using the visualization, a couple of minutes later I discovered that it shows a pattern on low-frequency items. Since these items only appear once in the dataset, their average temperature is the temperature they are used in. Since this is the case, Date-Temperature plane clearly shows seasonality (winter-summer differences in terms of temperature).
Also examining words like hot and cold reflects interesting figures.
Also examining words like hot and cold reflects interesting figures.
| Word1 | Temp | Word2 | Temp |
|---|---|---|---|
| hot | 52.02F -- 11.12C | cold | 49.62F -- 9.79C |
| summer | 52.35F -- 11.31C | winter | 49.99F -- 9.99C |
| ice | 51.02F -- 10.57C | fire | 50.78F -- 10.43C |
Code