International SPL
MAT 259, 2017
Kimberly Schlesinger
Concept
For this project, I wanted to keep the idea of looking at the contexts in which patrons of the Seattle Public Library interact with different countries and cultures. I used a similar query to my 2D project, counting the number of checkouts of media related to each country by searching the titles for country names, and grouping the checkouts by Dewey number and time to highlight topic trends and changes over the past decade. I wanted to create objects whose shapes encapsulated these changes.
Query
This was a similar query to the one for my previous project, but I wanted to make the data more granular. I counted the checkouts by month instead of just by year, as I had done previously, and I broke down the topics into 1000 separate Dewey numbers rather than grouping the Dewey classifications into bins of 10. I also made sure to include only those checkouts with a Dewey classification; previous attempts at this query had placed unclassified media in the “0” bin. This query runs in approximately 5 minutes.
SELECT year(cout), month(cout), floor(deweyClass) as deweyBin,
sum(CASE WHEN spl_2016.outraw.title LIKE "%mexic%" THEN 1 ELSE 0 END) as Mexico,
sum(CASE WHEN spl_2016.outraw.title LIKE "%ireland%" OR spl_2016.outraw.title LIKE "%irish%" THEN 1 ELSE 0 END) as Ireland,
sum(CASE WHEN spl_2016.outraw.title LIKE "%spain%" OR spl_2016.outraw.title LIKE "%spanish%" THEN 1 ELSE 0 END) as Spain,
sum(CASE WHEN spl_2016.outraw.title LIKE "%israel%" THEN 1 ELSE 0 END) as Israel,
sum(CASE WHEN spl_2016.outraw.title LIKE "%egypt%" THEN 1 ELSE 0 END) as Egypt,
sum(CASE WHEN spl_2016.outraw.title LIKE "%viet%nam%" THEN 1 ELSE 0 END) as Vietnam,
sum(CASE WHEN spl_2016.outraw.title LIKE "%german%" THEN 1 ELSE 0 END) as Germany,
sum(CASE WHEN spl_2016.outraw.title LIKE "%russia%" THEN 1 ELSE 0 END) as Russia,
sum(CASE WHEN spl_2016.outraw.title LIKE "%china%" OR spl_2016.outraw.title LIKE "%chinese%" THEN 1 ELSE 0 END) as China,
sum(CASE WHEN spl_2016.outraw.title LIKE "%cuba%" THEN 1 ELSE 0 END) as Cuba,
sum(CASE WHEN spl_2016.outraw.title LIKE "%iraq%" THEN 1 ELSE 0 END) as Iraq,
sum(CASE WHEN spl_2016.outraw.title LIKE "%japan%" THEN 1 ELSE 0 END) as Japan
FROM spl_2016.outraw
WHERE year(cout) > 2005 AND year(cout) < 2017
AND deweyClass IS NOT NULL AND deweyClass != ""
AND (spl_2016.outraw.title LIKE "%mexic%" OR
spl_2016.outraw.title LIKE "%ireland%" OR spl_2016.outraw.title LIKE "%irish%" OR
spl_2016.outraw.title LIKE "%spain%" OR spl_2016.outraw.title LIKE "%spanish%" OR
spl_2016.outraw.title LIKE "%israel%" OR
spl_2016.outraw.title LIKE "%egypt%" OR
spl_2016.outraw.title LIKE "%viet%nam%" OR
spl_2016.outraw.title LIKE "%german%" OR
spl_2016.outraw.title LIKE "%russia%" OR
spl_2016.outraw.title LIKE "%china%" OR spl_2016.outraw.title LIKE "%chinese%" OR
spl_2016.outraw.title LIKE "%cuba%" OR
spl_2016.outraw.title LIKE "%iraq%" OR
spl_2016.outraw.title LIKE "%japan%")
GROUP BY deweyBin, year(cout), month(cout)
ORDER BY deweyBin, year(cout), month(cout);
In addition, I ran a separate query to search for all the media with no Dewey classification, and break down these checkouts by topics found in their call numbers. I started with a query to pull out all biographies in this set, whose call numbers start with "B ":
SELECT year(cout), month(cout), callNumber,
sum(CASE WHEN spl_2016.outraw.title LIKE "%mexic%" THEN 1 ELSE 0 END) as Mexico,
sum(CASE WHEN spl_2016.outraw.title LIKE "%ireland%" OR spl_2016.outraw.title LIKE "%irish%" THEN 1 ELSE 0 END) as Ireland,
sum(CASE WHEN spl_2016.outraw.title LIKE "%spain%" OR spl_2016.outraw.title LIKE "%spanish%" THEN 1 ELSE 0 END) as Spain,
sum(CASE WHEN spl_2016.outraw.title LIKE "%israel%" THEN 1 ELSE 0 END) as Israel,
sum(CASE WHEN spl_2016.outraw.title LIKE "%egypt%" THEN 1 ELSE 0 END) as Egypt,
sum(CASE WHEN spl_2016.outraw.title LIKE "%china%" OR spl_2016.outraw.title LIKE "%chinese%" THEN 1 ELSE 0 END) as China,
sum(CASE WHEN spl_2016.outraw.title LIKE "%cuba%" THEN 1 ELSE 0 END) as Cuba,
sum(CASE WHEN spl_2016.outraw.title LIKE "%iraq%" THEN 1 ELSE 0 END) as Iraq,
sum(CASE WHEN spl_2016.outraw.title LIKE "%japan%" THEN 1 ELSE 0 END) as Japan
FROM spl_2016.outraw
INNER JOIN spl_2016.callNumber
ON spl_2016.outraw.itemNumber = spl_2016.callNumber.itemNumber
WHERE year(cout) > 2005 AND year(cout) < 2017
AND (deweyClass IS NULL OR deweyClass = "")
AND (spl_2016.outraw.title LIKE "%mexic%" OR
spl_2016.outraw.title LIKE "%ireland%" OR spl_2016.outraw.title LIKE "%irish%" OR
spl_2016.outraw.title LIKE "%spain%" OR spl_2016.outraw.title LIKE "%spanish%" OR
spl_2016.outraw.title LIKE "%israel%" OR
spl_2016.outraw.title LIKE "%egypt%" OR
spl_2016.outraw.title LIKE "%china%" OR spl_2016.outraw.title LIKE "%chinese%" OR
spl_2016.outraw.title LIKE "%cuba%" OR
spl_2016.outraw.title LIKE "%iraq%" OR
spl_2016.outraw.title LIKE "%japan%")
AND (callNumber REGEXP "^B ")
GROUP BY deweyBin, year(cout), month(cout)
ORDER BY deweyBin, year(cout), month(cout);
This query runs in about 2 minutes. I ran more similar queries to search for a few more call number-defined topics, including "J" = juniors, "E" = early childhood (I think), "YA" = young adult, "MYSTERY," "SCI-FIC," general "FIC," "CD," "DVD," and "VHS."
Process and Sketches
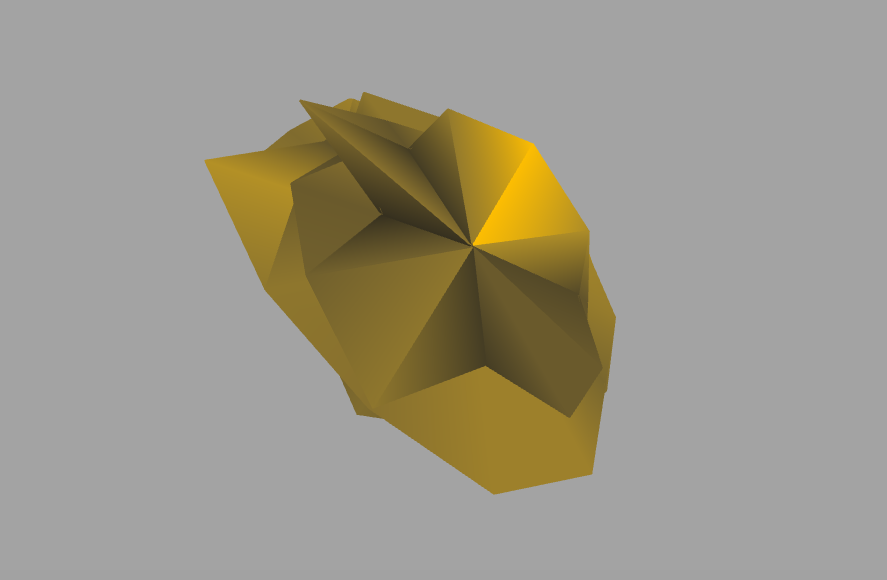
I started by trying to define the shape I wanted to give to each object, that would define the topic and frequency patterns. I started with cylindrical objects where the radius indicated the number of checkouts, the polar angle indicated the month from Jan 2006 to Dec 2016, and the height indicated the topic. I modified a Processing example for drawing cylinders to stack a bunch of cylinders and changes their radii. Here is an early try at sketching it for ten Dewey numbers in the History class:
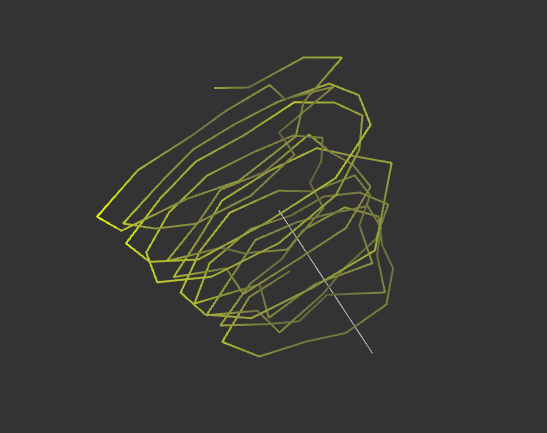
Since the data is more granular than in the 2D project, the yearly spikes around the polar angle and the wild changes between checkouts for adjacent topics made the object look too jagged. So I decided to separate Dewey numbers into separate objects, and separate the year and month to different axes (polar angle is month, height is year). This made the objects more smooth.
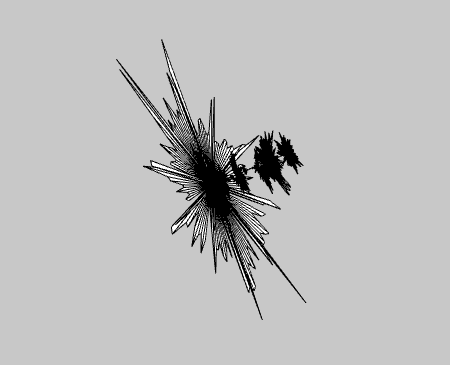
I also experimented with just drawing dots or lines instead of full cylinders, and I liked this effect better (plus it was faster to render).
I spent a long time scaling the radii so the data would be visible, and the key turned out to be a log scale, which highlights the most popular while allowing small numbers of checkouts to still be visible. I also decided to use HSB color scheme, and I scaled saturation and brightness linearly with number of checkouts to emphasize the changing radius effect. I chose a different hue to represent each country. Each object itself is 3D, but when it came to arranging them in space, I was not sure of the best way. I started with a simple 2D sheet of them, arranged by Dewey number, and I thought it worked well. Unlike a few other, more complex arrangements, this one didn't block data from view. I also decided to draw the objects for all the countries on top of each other, so the dominant countries for each topic can be easily compared. Changing the locations was made much easier by making each object an instance of a class I called "Bead," where each Bead object stored its own location and had its own draw method.
Figuring out the camera was one of the most difficult parts of this project, but I got it down pretty well by the end. I spent time deciding on the best views to present the data in. Since there is a lot of data for a user to explore, I wanted to facilitate looking at the patterns on a large scale as well as zooming into individual objects. I decided on a top view and a side view with constrained rotation to encourage scrolling / panning.
Since the data is more granular than in the 2D project, the yearly spikes around the polar angle and the wild changes between checkouts for adjacent topics made the object look too jagged. So I decided to separate Dewey numbers into separate objects, and separate the year and month to different axes (polar angle is month, height is year). This made the objects more smooth.
I also experimented with just drawing dots or lines instead of full cylinders, and I liked this effect better (plus it was faster to render).
I spent a long time scaling the radii so the data would be visible, and the key turned out to be a log scale, which highlights the most popular while allowing small numbers of checkouts to still be visible. I also decided to use HSB color scheme, and I scaled saturation and brightness linearly with number of checkouts to emphasize the changing radius effect. I chose a different hue to represent each country. Each object itself is 3D, but when it came to arranging them in space, I was not sure of the best way. I started with a simple 2D sheet of them, arranged by Dewey number, and I thought it worked well. Unlike a few other, more complex arrangements, this one didn't block data from view. I also decided to draw the objects for all the countries on top of each other, so the dominant countries for each topic can be easily compared. Changing the locations was made much easier by making each object an instance of a class I called "Bead," where each Bead object stored its own location and had its own draw method.
Figuring out the camera was one of the most difficult parts of this project, but I got it down pretty well by the end. I spent time deciding on the best views to present the data in. Since there is a lot of data for a user to explore, I wanted to facilitate looking at the patterns on a large scale as well as zooming into individual objects. I decided on a top view and a side view with constrained rotation to encourage scrolling / panning.
Final Result
My final visualization includes all the objects for the non-Dewey items as well as each Dewey category (starting with 200, since there is very little interesting data in 000-199). Starting the sketch shows the objects head-on in dot mode, but pressing "r" or "h" will bring the viewer to a more instructive top or side view. Pressing "s" (or switching to the preprogrammed views) will also plot in spiral mode, which for some reason is much faster to render than dots.
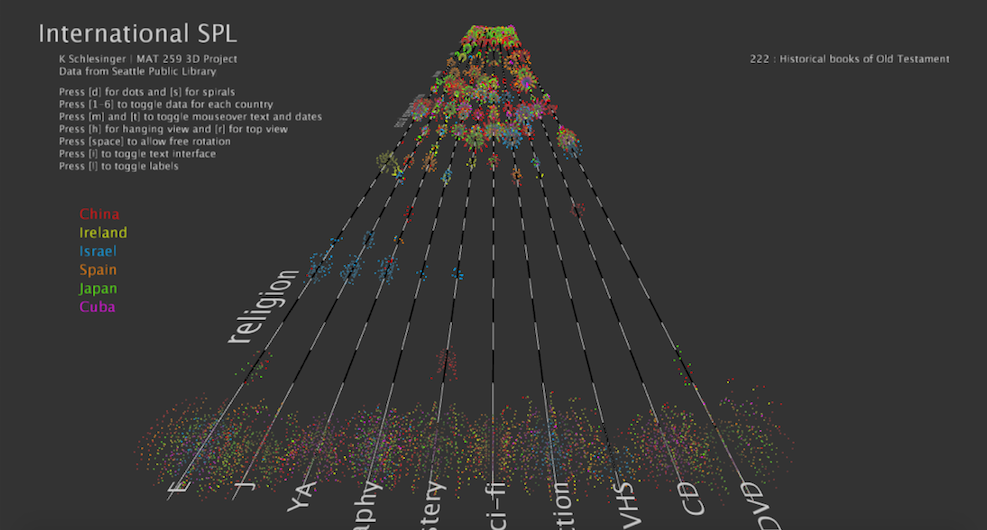
In addition to switching between dots and spirals and changing views, there are other interactive features. Since there is a lot of data and a lot of interesting patterns, I wanted to make exploration easy for the user. Pressing the keys 1-6 will toggle each country on and off. Mousing over the center of an object will display that object's Dewey number and topic name, for better understanding the patterns. Pressing "t" turns on a mode that also prints month and year coordinates around an object when mousing over it. Other keys will also turn on and off the major class labels on the side, and the instructional interface itself. Finally, since switching to the pre-programmed views restricts rotation ability, pressing the space bar restores full camera control.
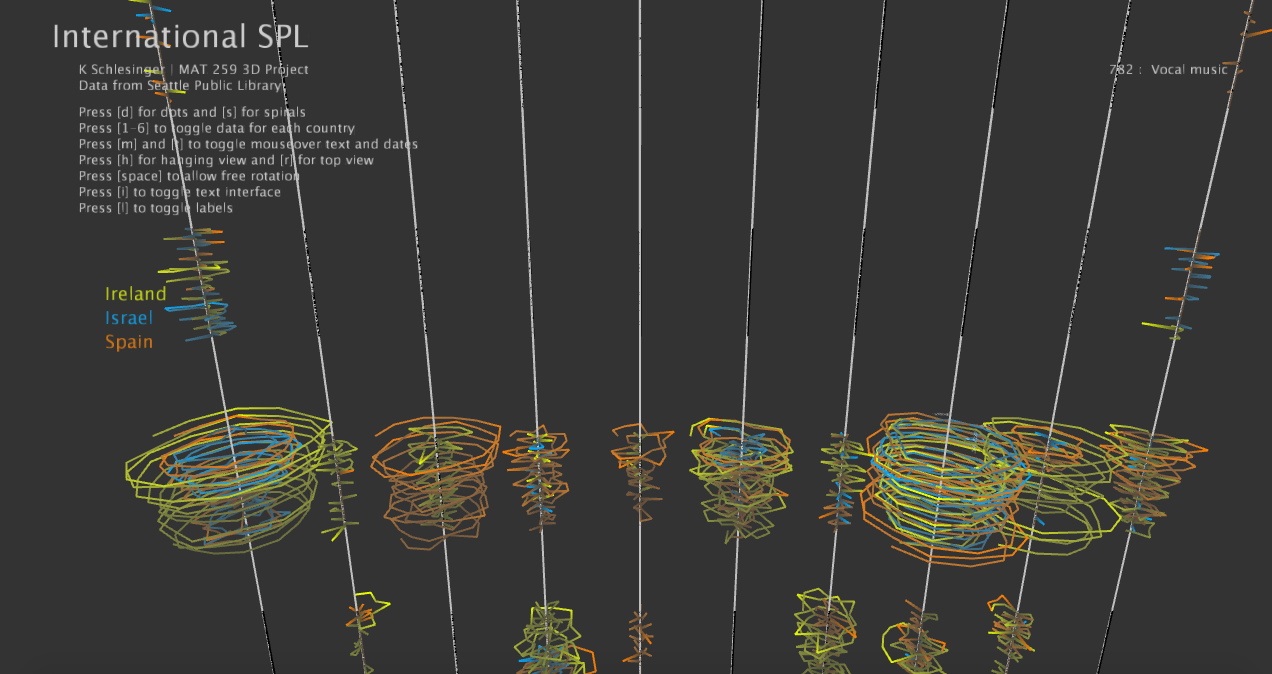
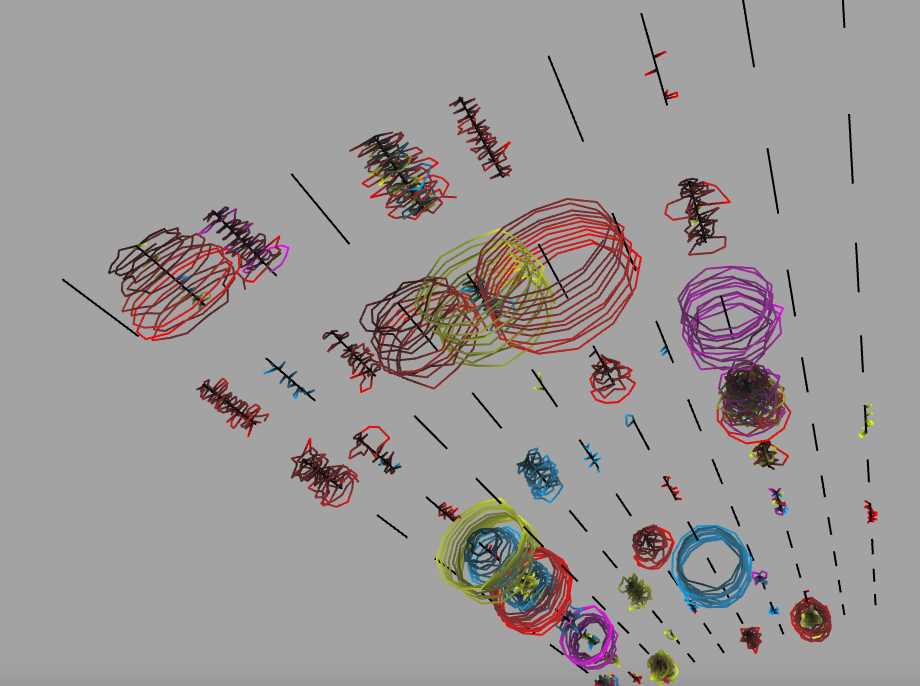
This example from the side view shows the Dewey numbers associated with music, with only three countries turned on. In this view, one can see that different countries dominate in different subcategories of music; for example, Spain has the most “Stringed instruments” media (third from left).
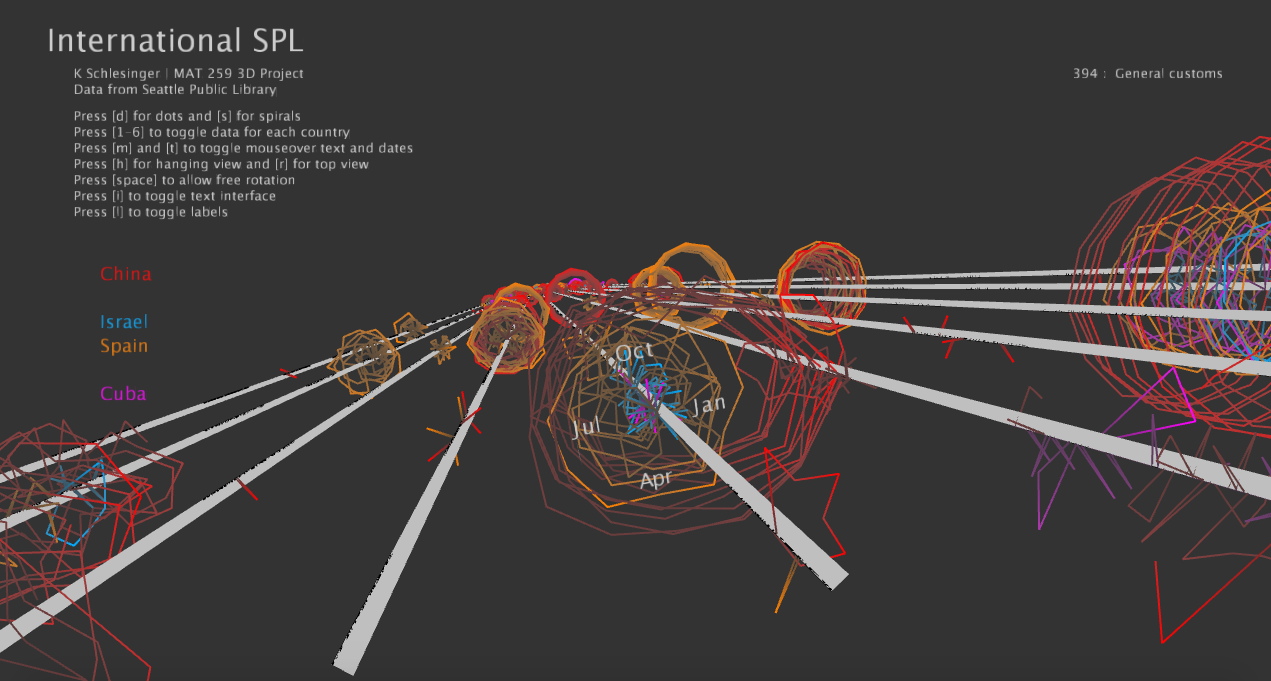
In addition to switching between dots and spirals and changing views, there are other interactive features. Since there is a lot of data and a lot of interesting patterns, I wanted to make exploration easy for the user. Pressing the keys 1-6 will toggle each country on and off. Mousing over the center of an object will display that object's Dewey number and topic name, for better understanding the patterns. Pressing "t" turns on a mode that also prints month and year coordinates around an object when mousing over it. Other keys will also turn on and off the major class labels on the side, and the instructional interface itself. Finally, since switching to the pre-programmed views restricts rotation ability, pressing the space bar restores full camera control.
This example from the side view shows the Dewey numbers associated with music, with only three countries turned on. In this view, one can see that different countries dominate in different subcategories of music; for example, Spain has the most “Stringed instruments” media (third from left).
Analysis
There are a lot of interesting patterns to discover in this data. Overall, I felt some of the most interesting sections were history/geography and social sciences, where certain countries were much more prominent in some areas than others, such as the topics corresponding to their continent's history. A few interesting observations: Almost all of the religion section topics are devoted to Christianity, so Ireland and Spain are widespread and countries with other primary religions are relegated to the "other" subsection -- except Israel, which is the most prominent country in the "Bible" topics. China, Japan, and Spain have many more cookbooks than Israel, Ireland, and Cuba. China dominates most of the technology section, and Japan most of the arts section, while the most popular languages to learn are clearly Chinese and Spanish. Japan is well-represented in sci-fi, and Ireland in mystery. Topics where all countries are similarly well represented include the music section and the "history of the United States" section, as well as biographies.
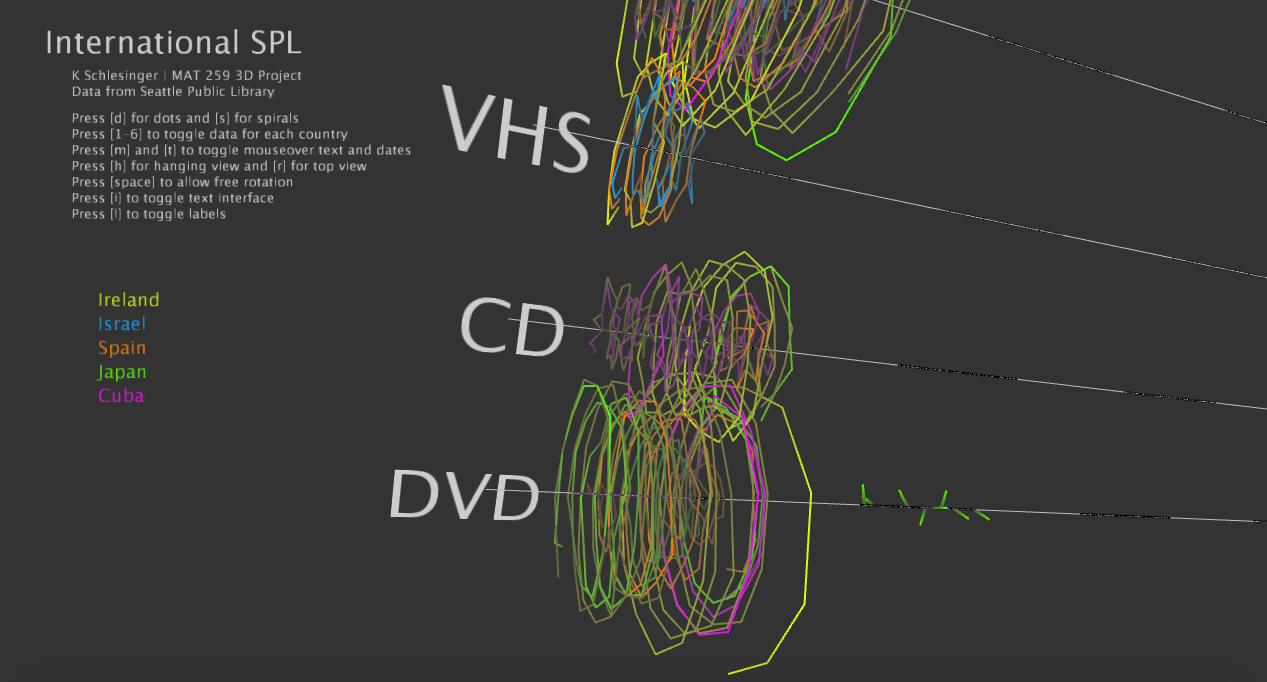
The time frequency patterns are often more subtle than topic variations, but one notable long-term change is the slow dying out of VHS checkouts after about 2008 for all countries, and a notable yearly cycle is the uptick in checkouts about Chinese customs in January/February, around the time of the Chinese New Year.
Code
Zipped code, query, and data are included below. The visualization is developed with Processing, using the peasycam and ControlP5 libraries.
Source Code + Data
Source Code + Data