Some books have longer title while others have shorter ones. Does this difference change over time? Does the difference vary in different Dewey classes?
IdeaI queried the average title length in different Dewey classes in different years (from 2006 to 2016) using Seattle Public Library data. I wanted to see if the average title length changes a lot or being stable over time.
This query is used to calculate the average title length of books in all 1000 Dewey sections over 11 years, and grouped by Dewey sections and different year.
SELECT
  a.yr, a.dewey,
  AVG(CASE
    WHEN a.itemtype LIKE '%bk%' THEN a.length
    ELSE 0
  END) AS AvgTitleLength
FROM
  (SELECT DISTINCT
    bibNumber,
    itemtype,
    FLOOR(deweyClass) AS dewey,
    LENGTH(title) AS length,
    year(cout) as yr
FROM
  spl_2016.inraw
WHERE
  YEAR(cout) > 2005 AND YEAR(cout) < 2017
    AND FLOOR(deweyClass) != '') AS a
GROUP BY a.dewey, a.yr;
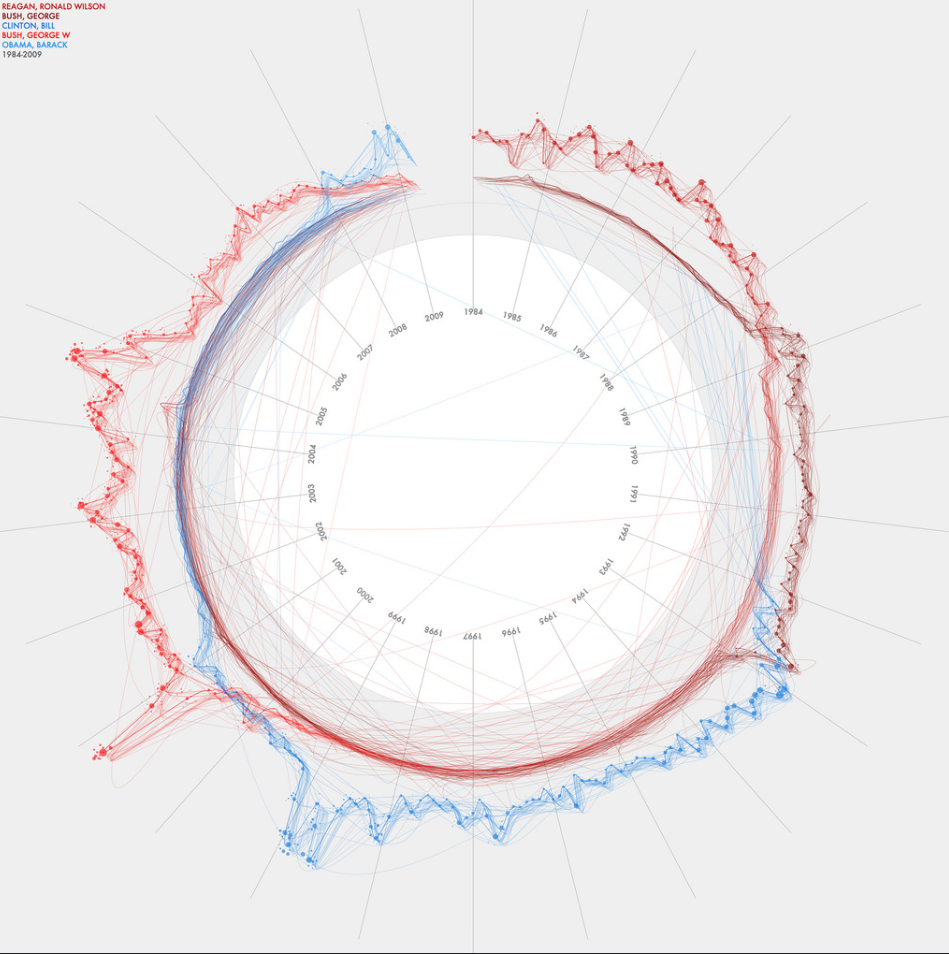
I always think curve is beautiful, so I wanted to show data through a curve form. This picture below kind of inspired me to represent my data.
The query and data is not very complicated, I used a matrix to store all the data. For visualization, I used PShape functions (beginShape(), curveVertex() and endShape()). And there are a lot functions and details we can explore in PeasyCam and ControlP5.
PeasyCam and ControlP5
I spent a lot of time figuring out what I can do with PeasyCam and ControlP5. The examples of these two packages in processing are very helpful, because they can give you a basic idea of what it can do for your project. But customization need further exploration. Some question I had at first would be:
- How to keep ControlP5 user interface still on top of 3D part (not rotate when camera changes perspectives)?
- How to use ControlP5 interface to add checkbox, range and so forth? How they listen to the event?
- When use ControlP5 interface, how to keep 3D part still (when drag mouse move over the interface, how to camera still)?
- How to keep the label (text) always face front even you rotate the camera?
There are many details needs attention. And the solution of above questions can be found in the source code below.
InteractionAll interactions are in ControlP5 user interface, there is no keyboard commands.
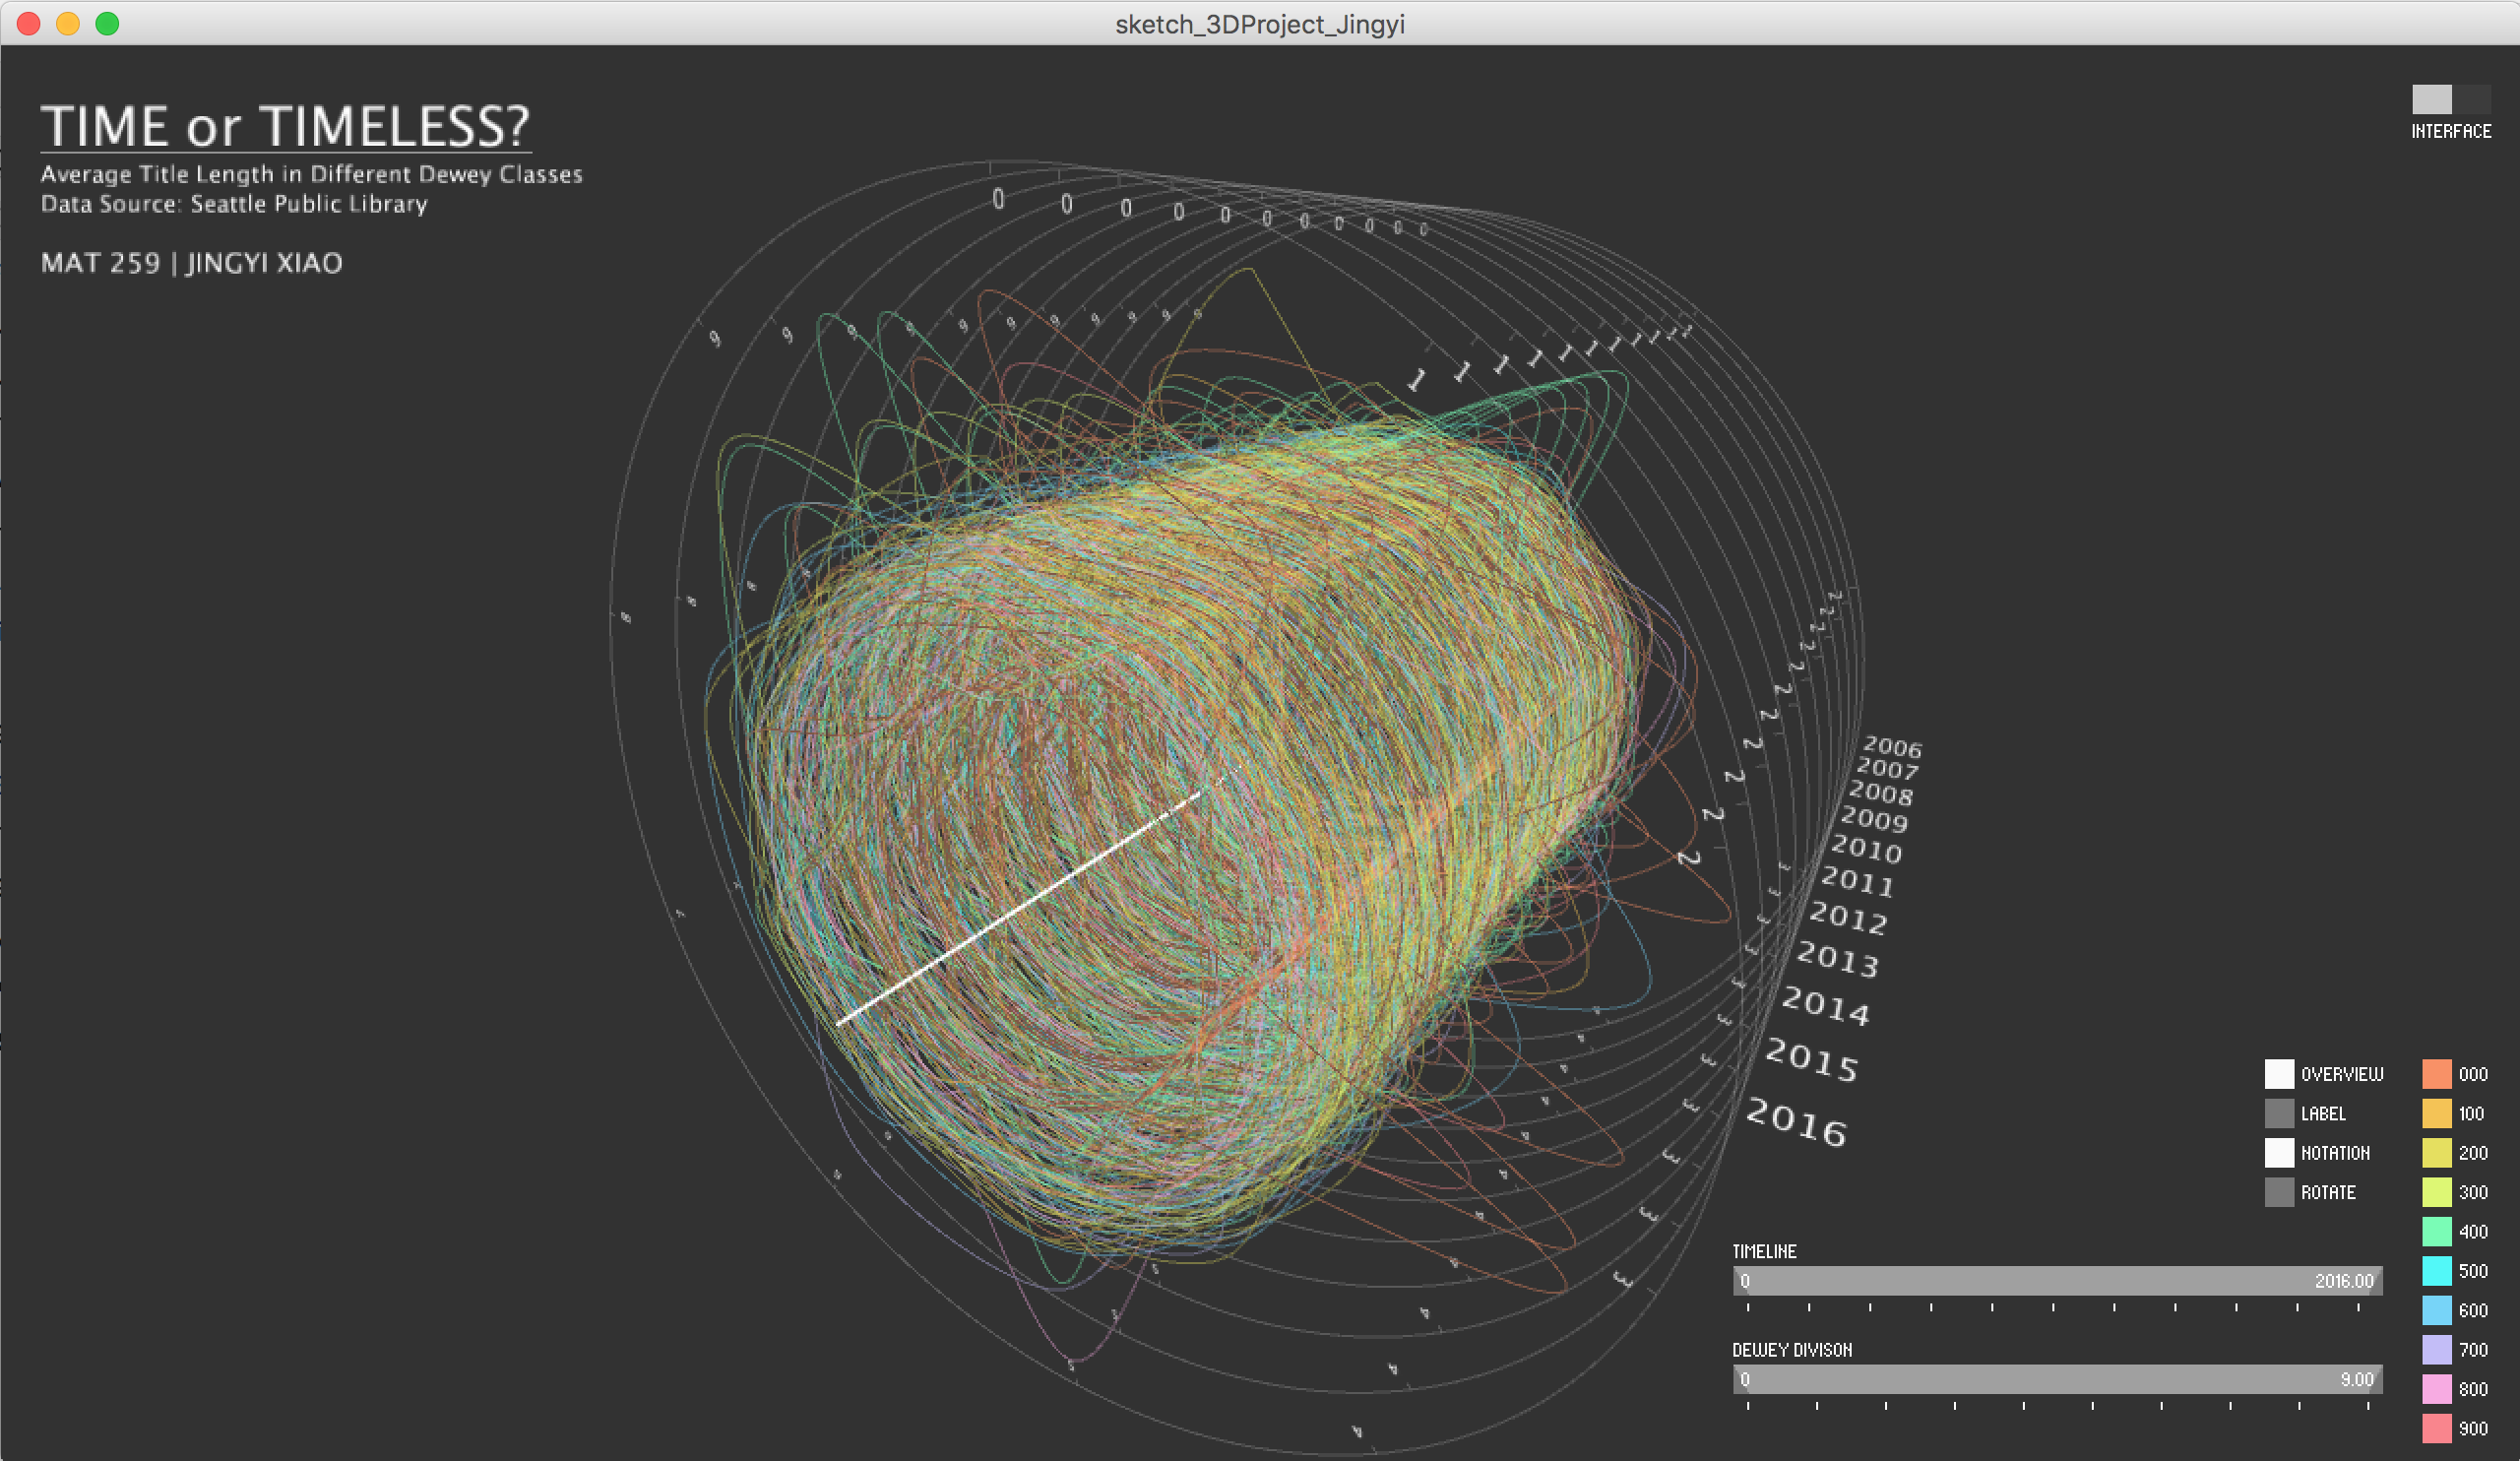
Another view with notation
Dewey class 600 and 800
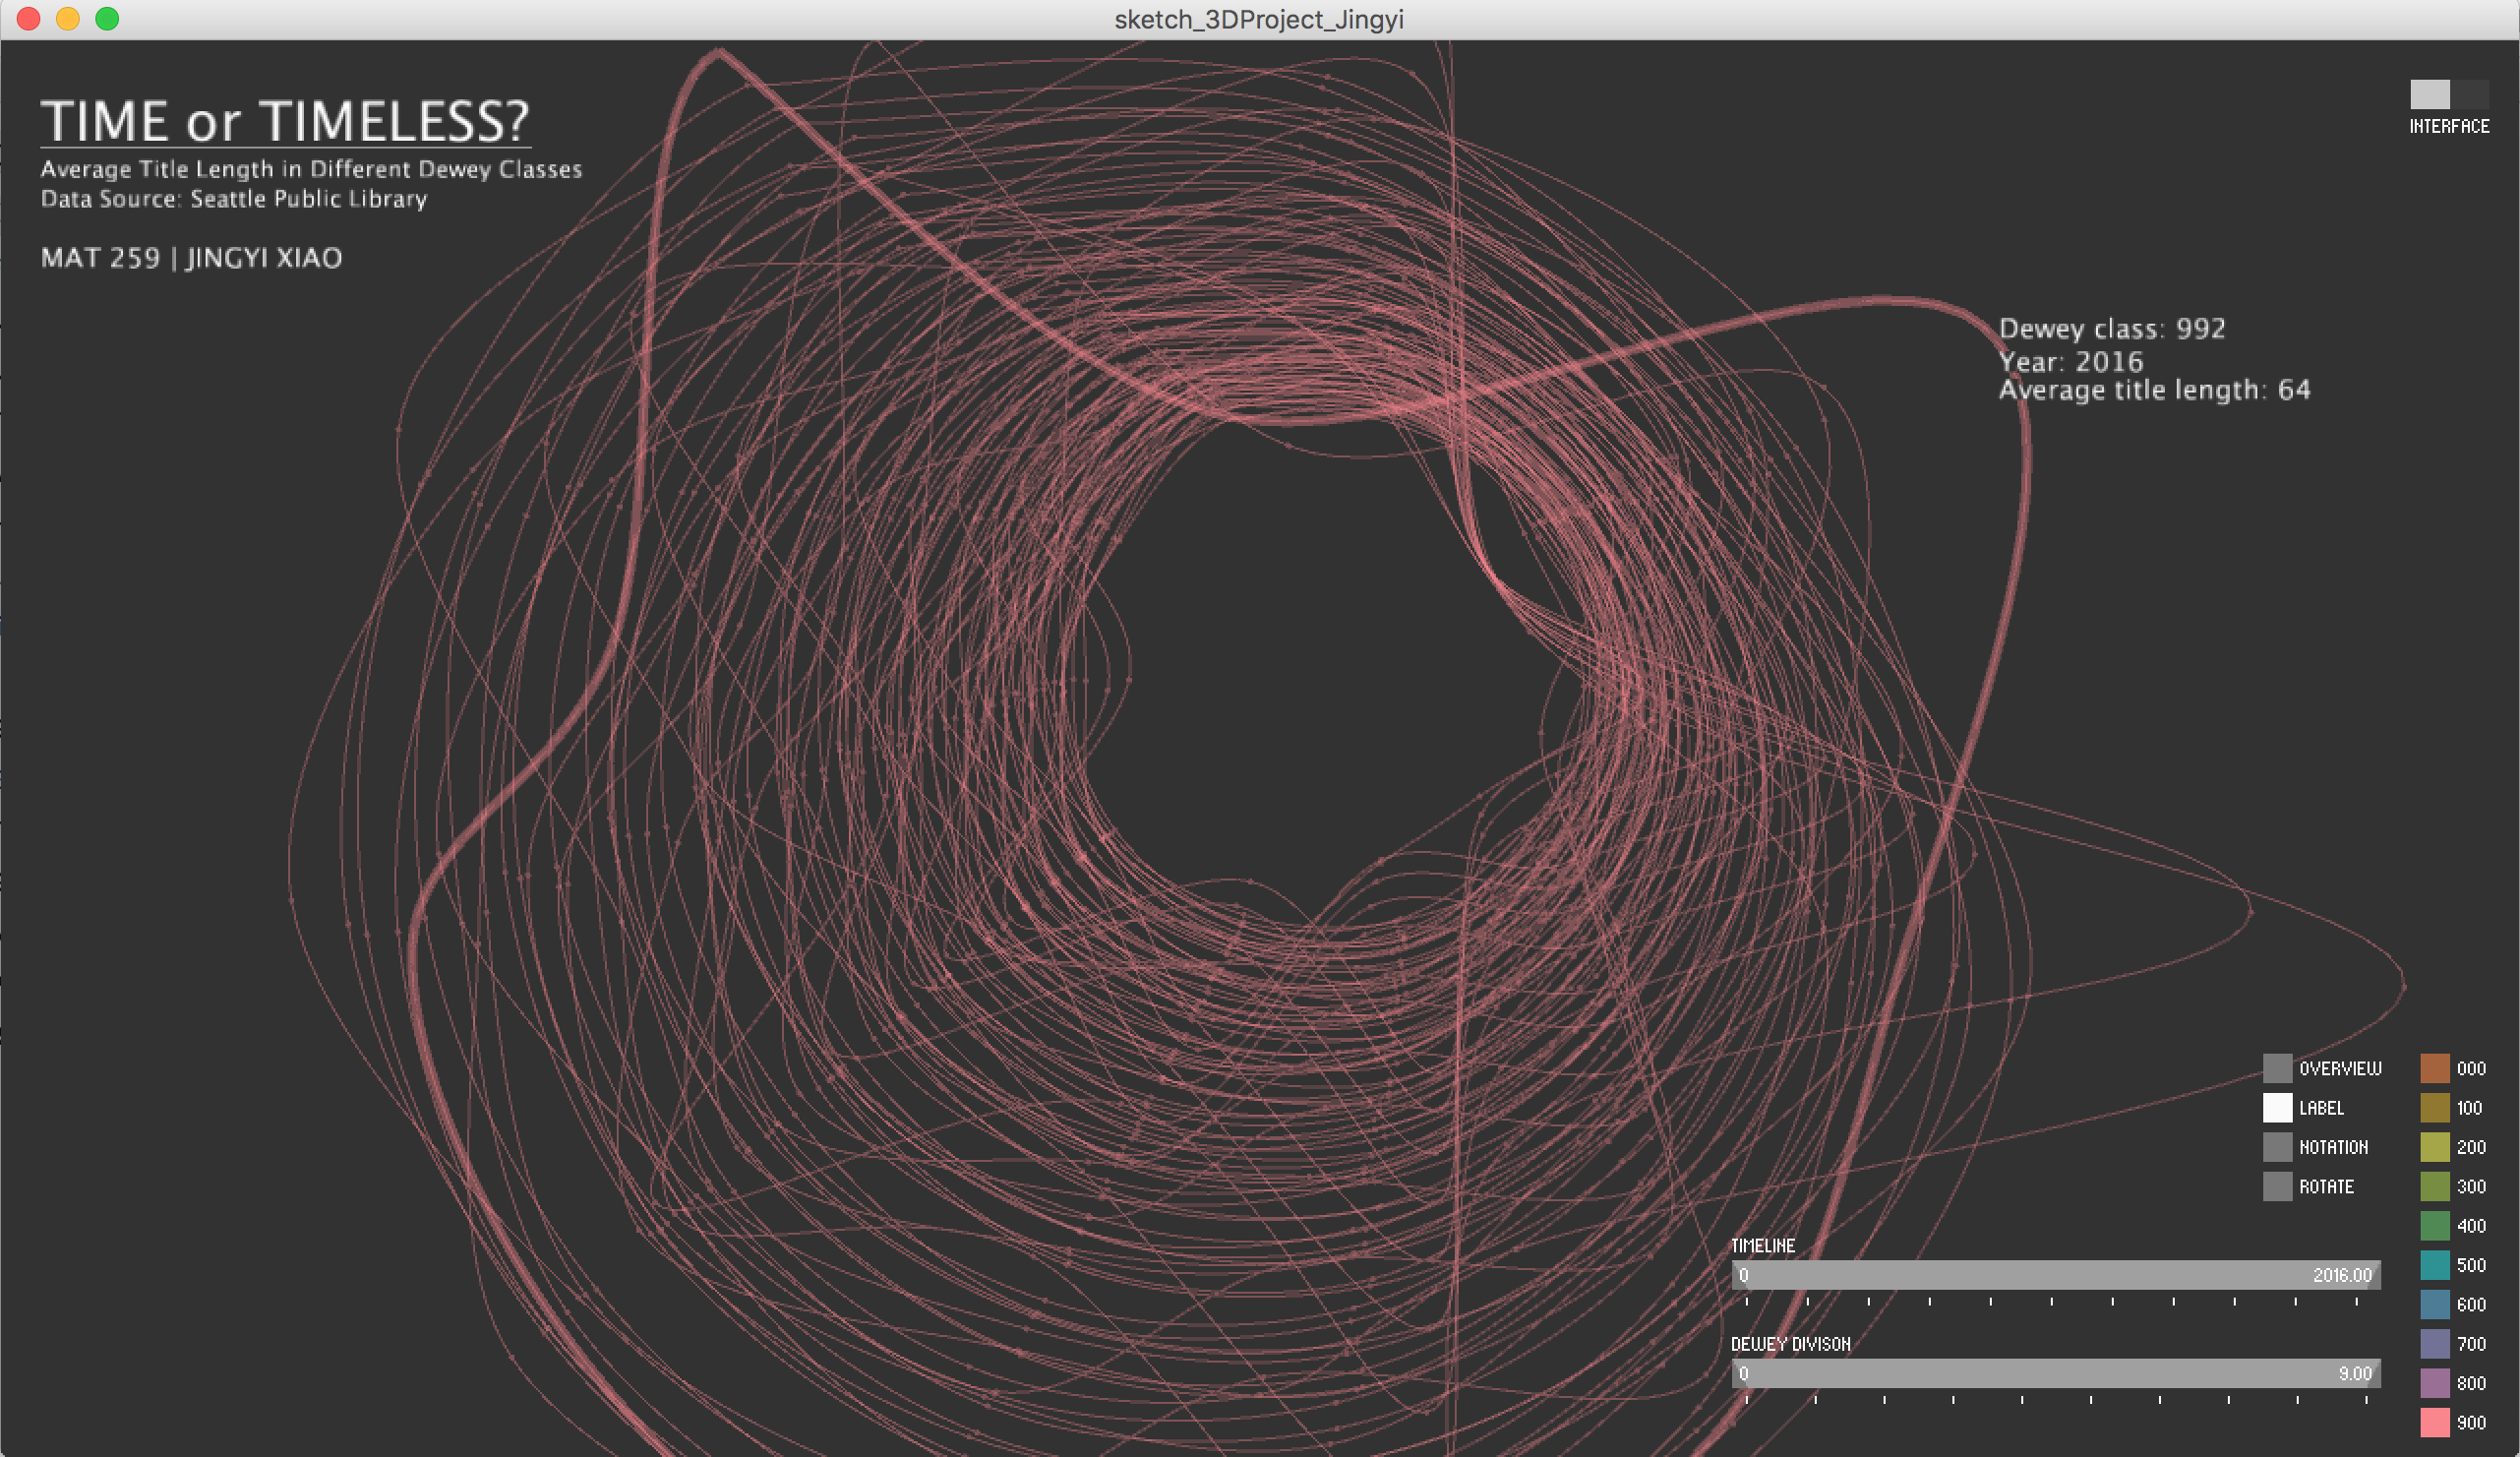
Dewey class 900 with label
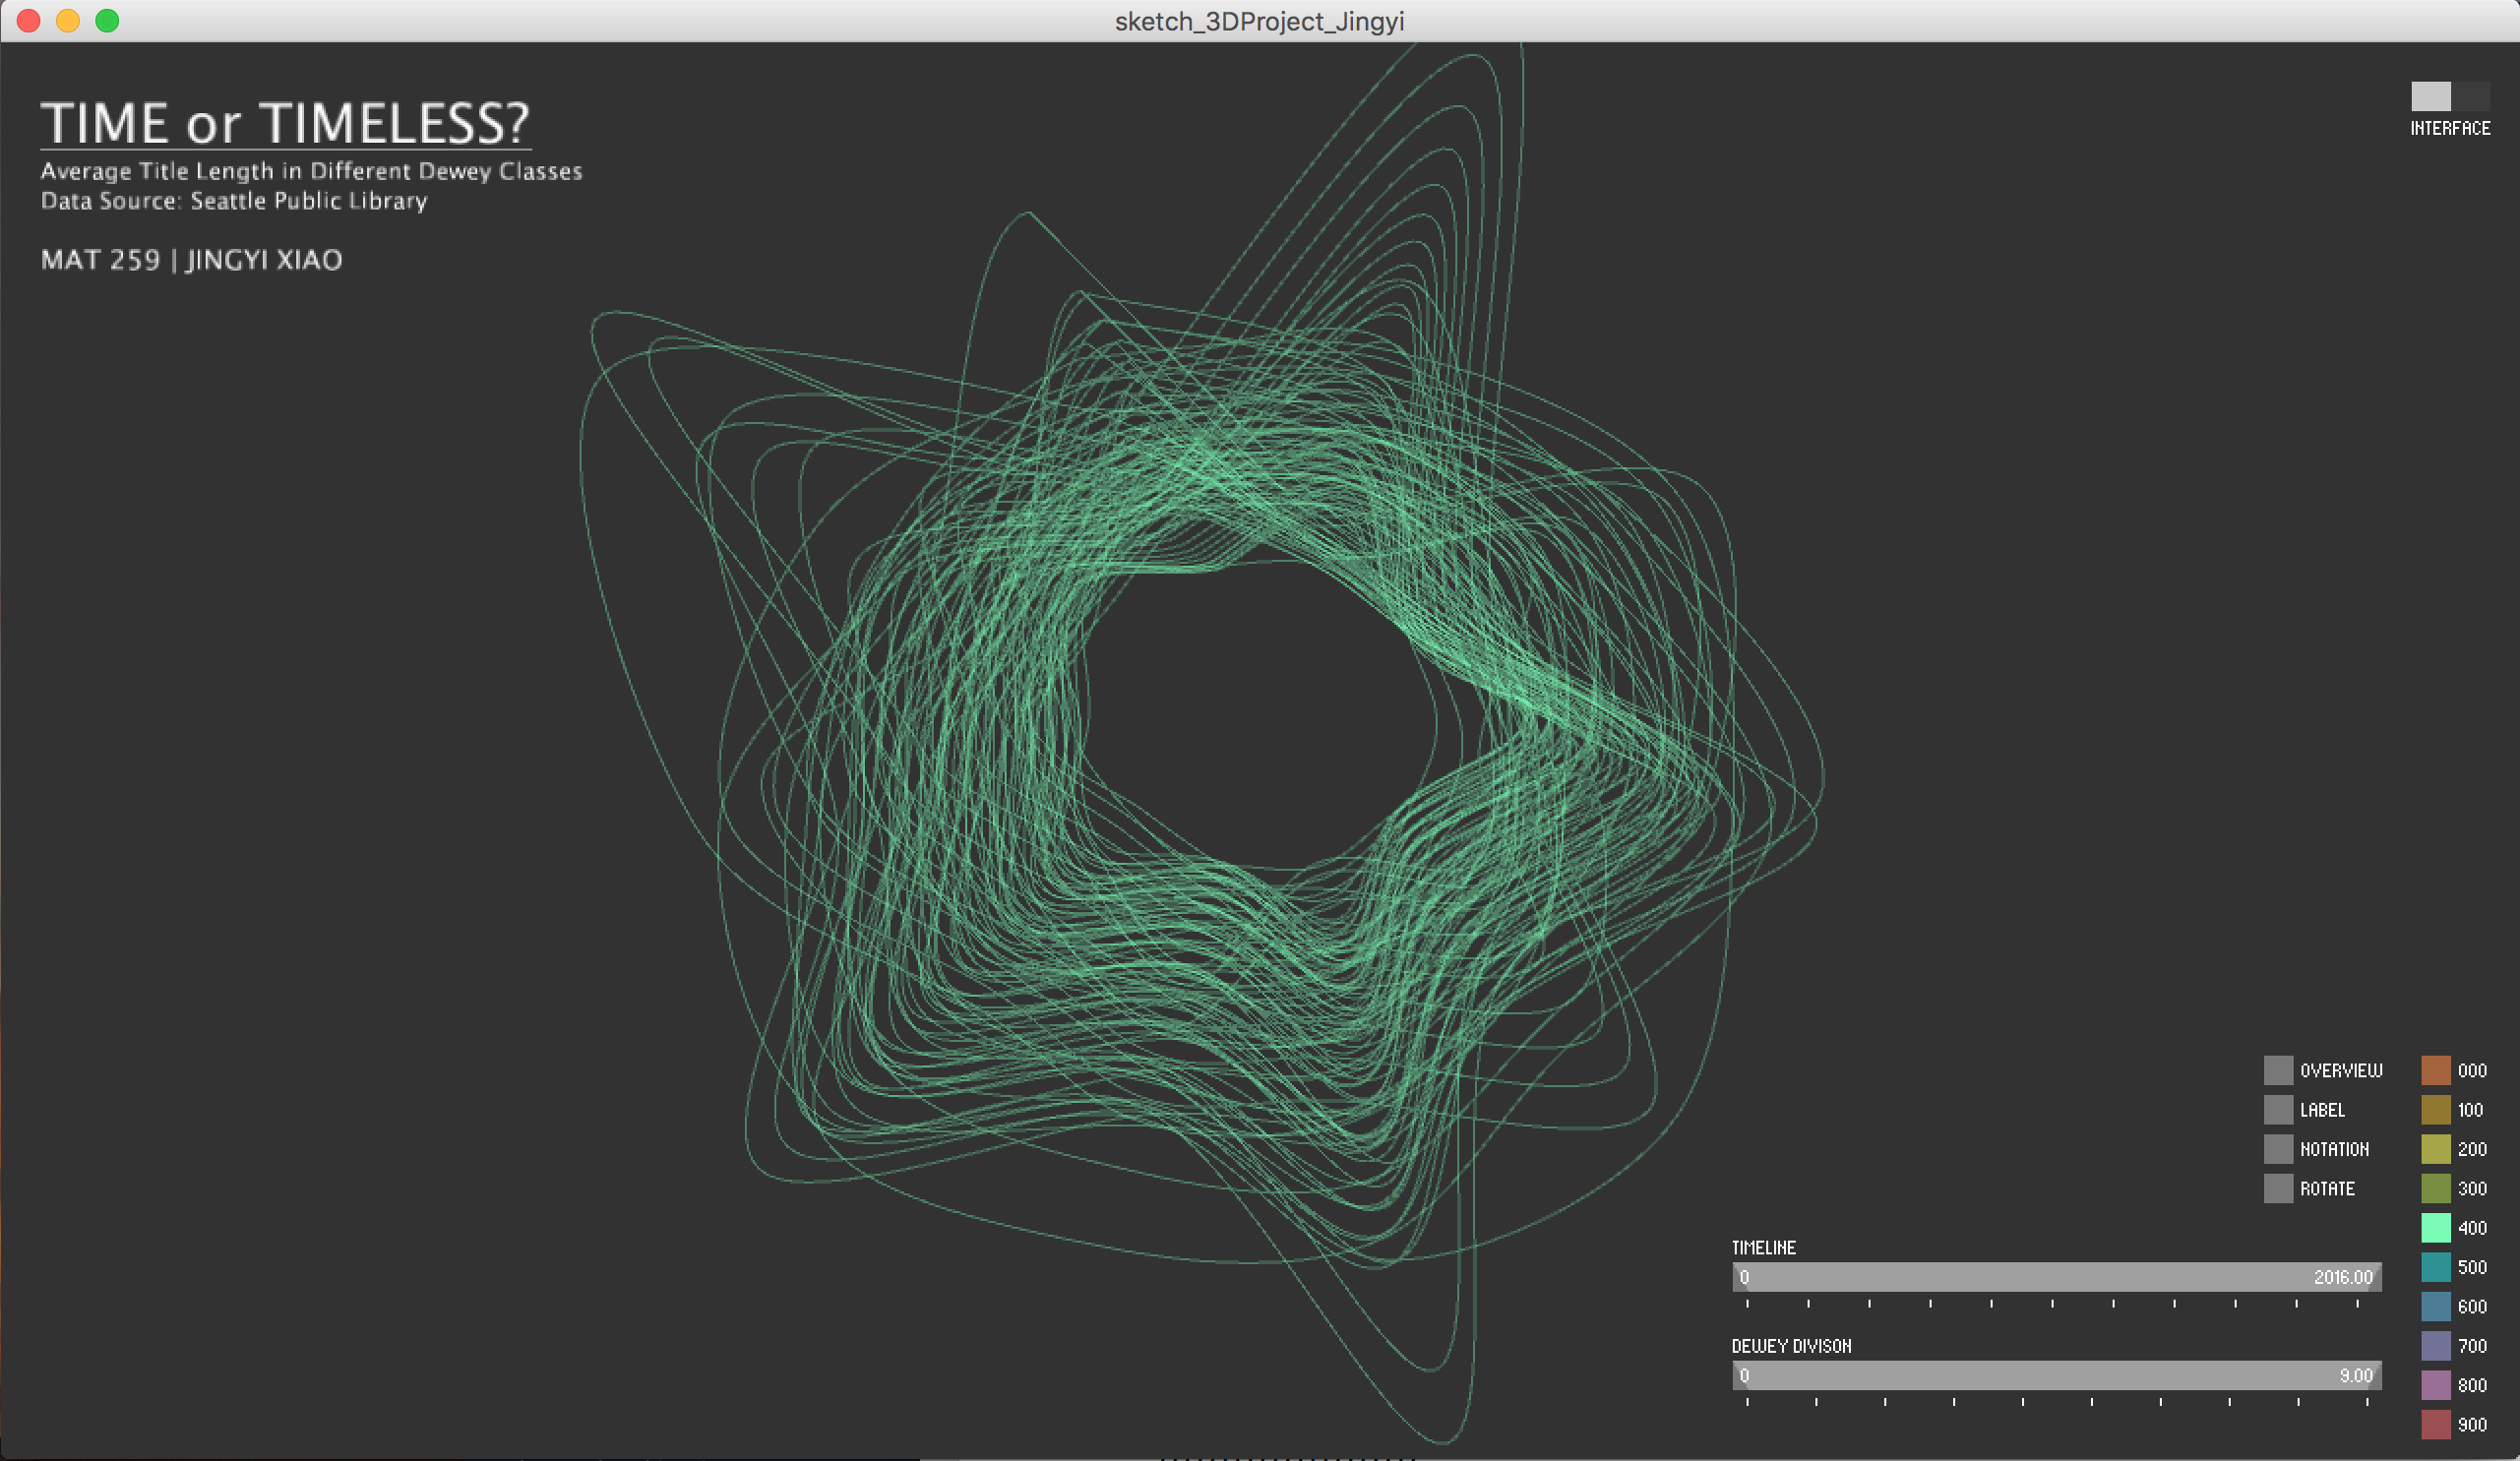
Dewey class 400
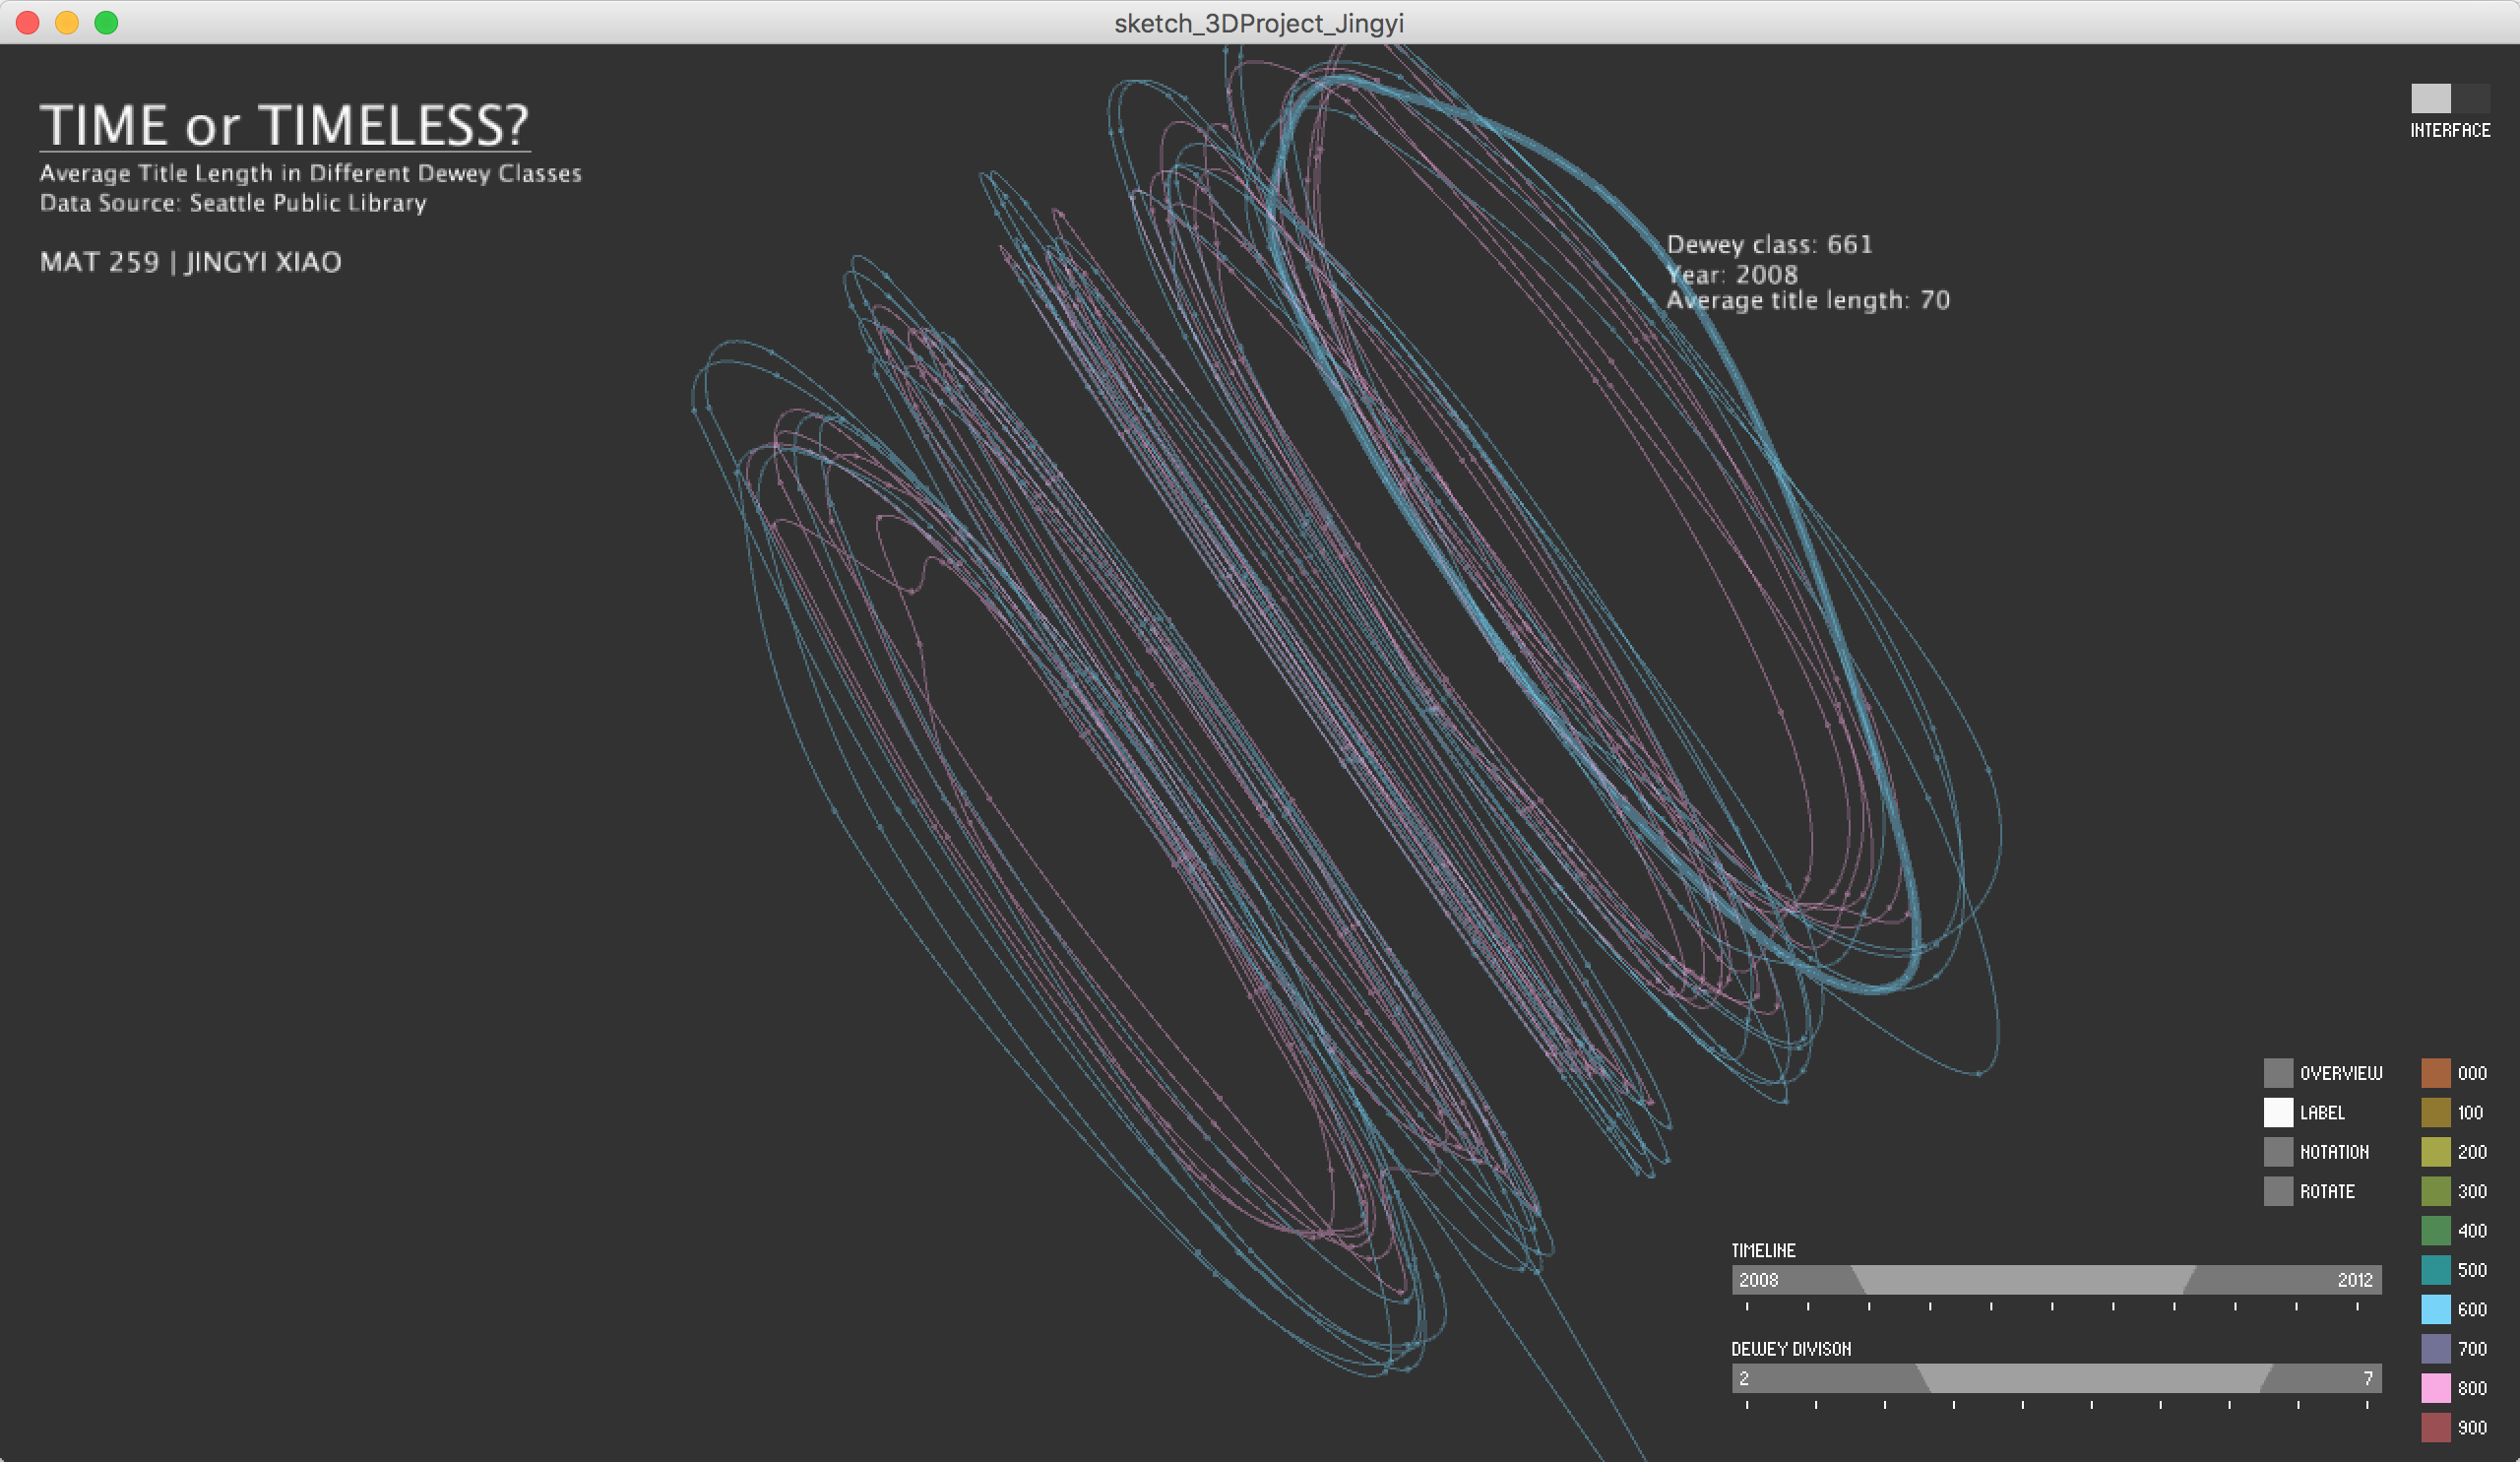
Narrow down year from 2008 to 2012, Dewey division from 2 to 7 (Dewey class 600 and 800)
Turn off title part
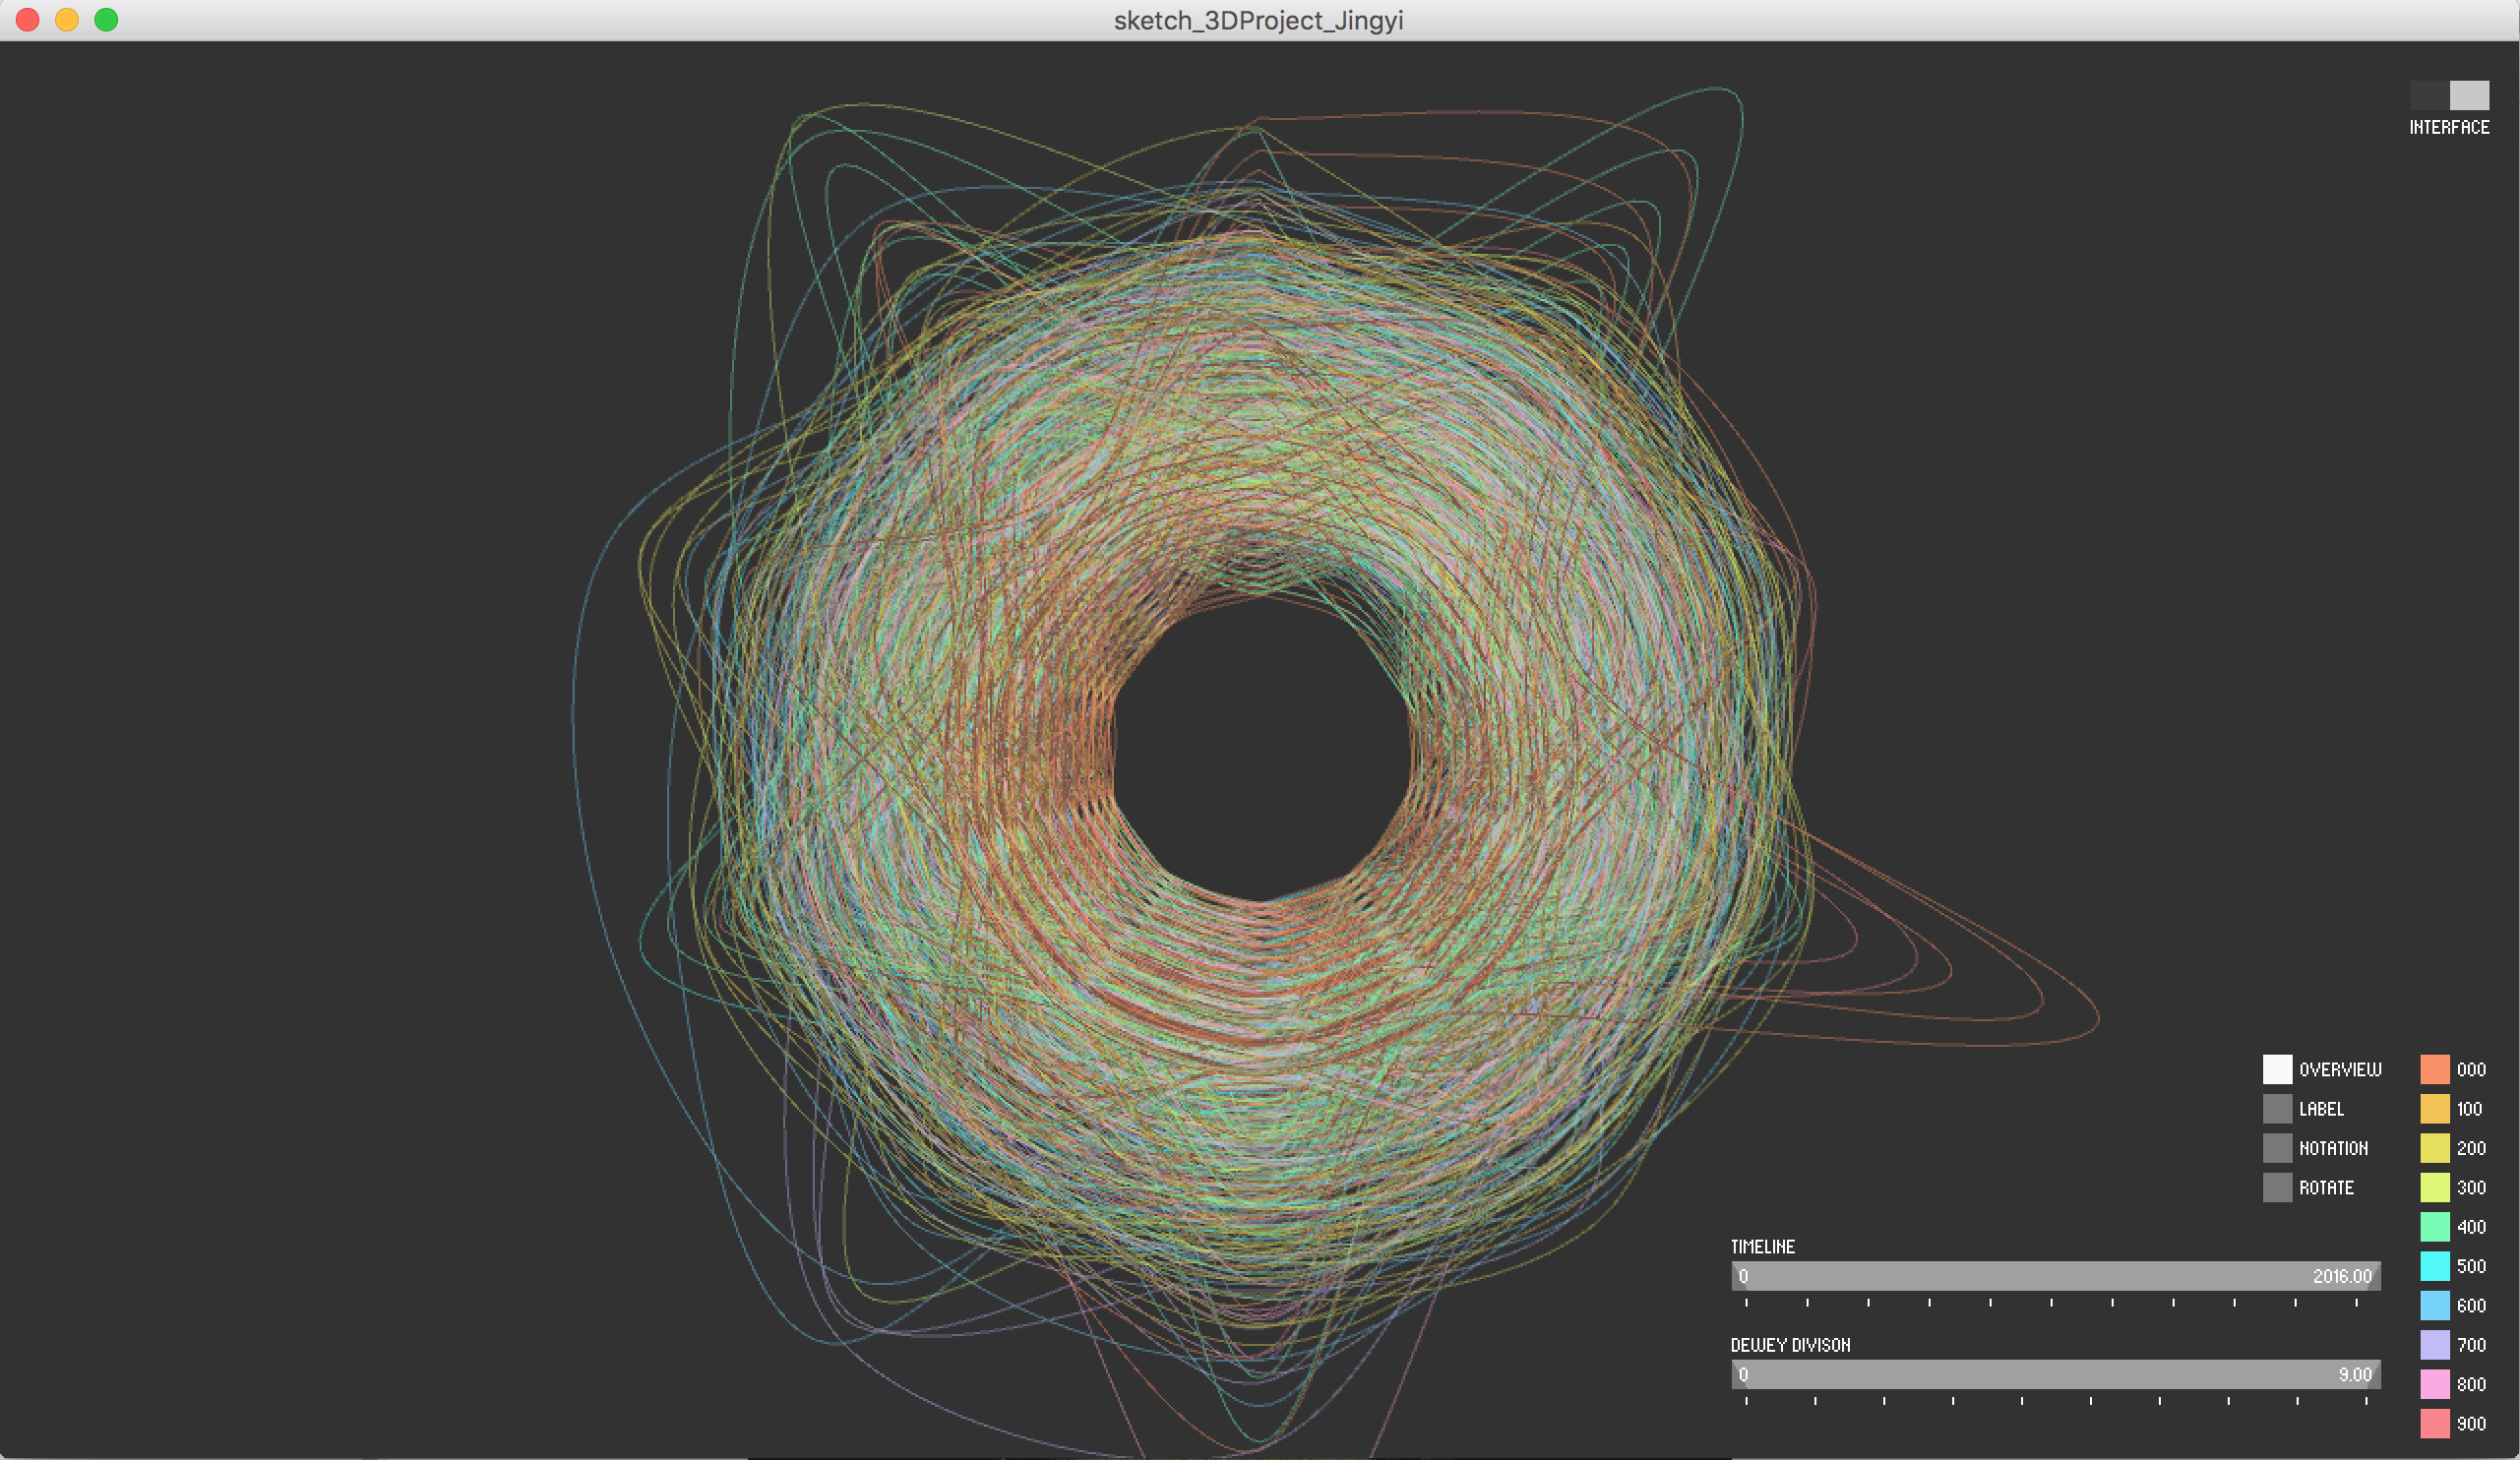
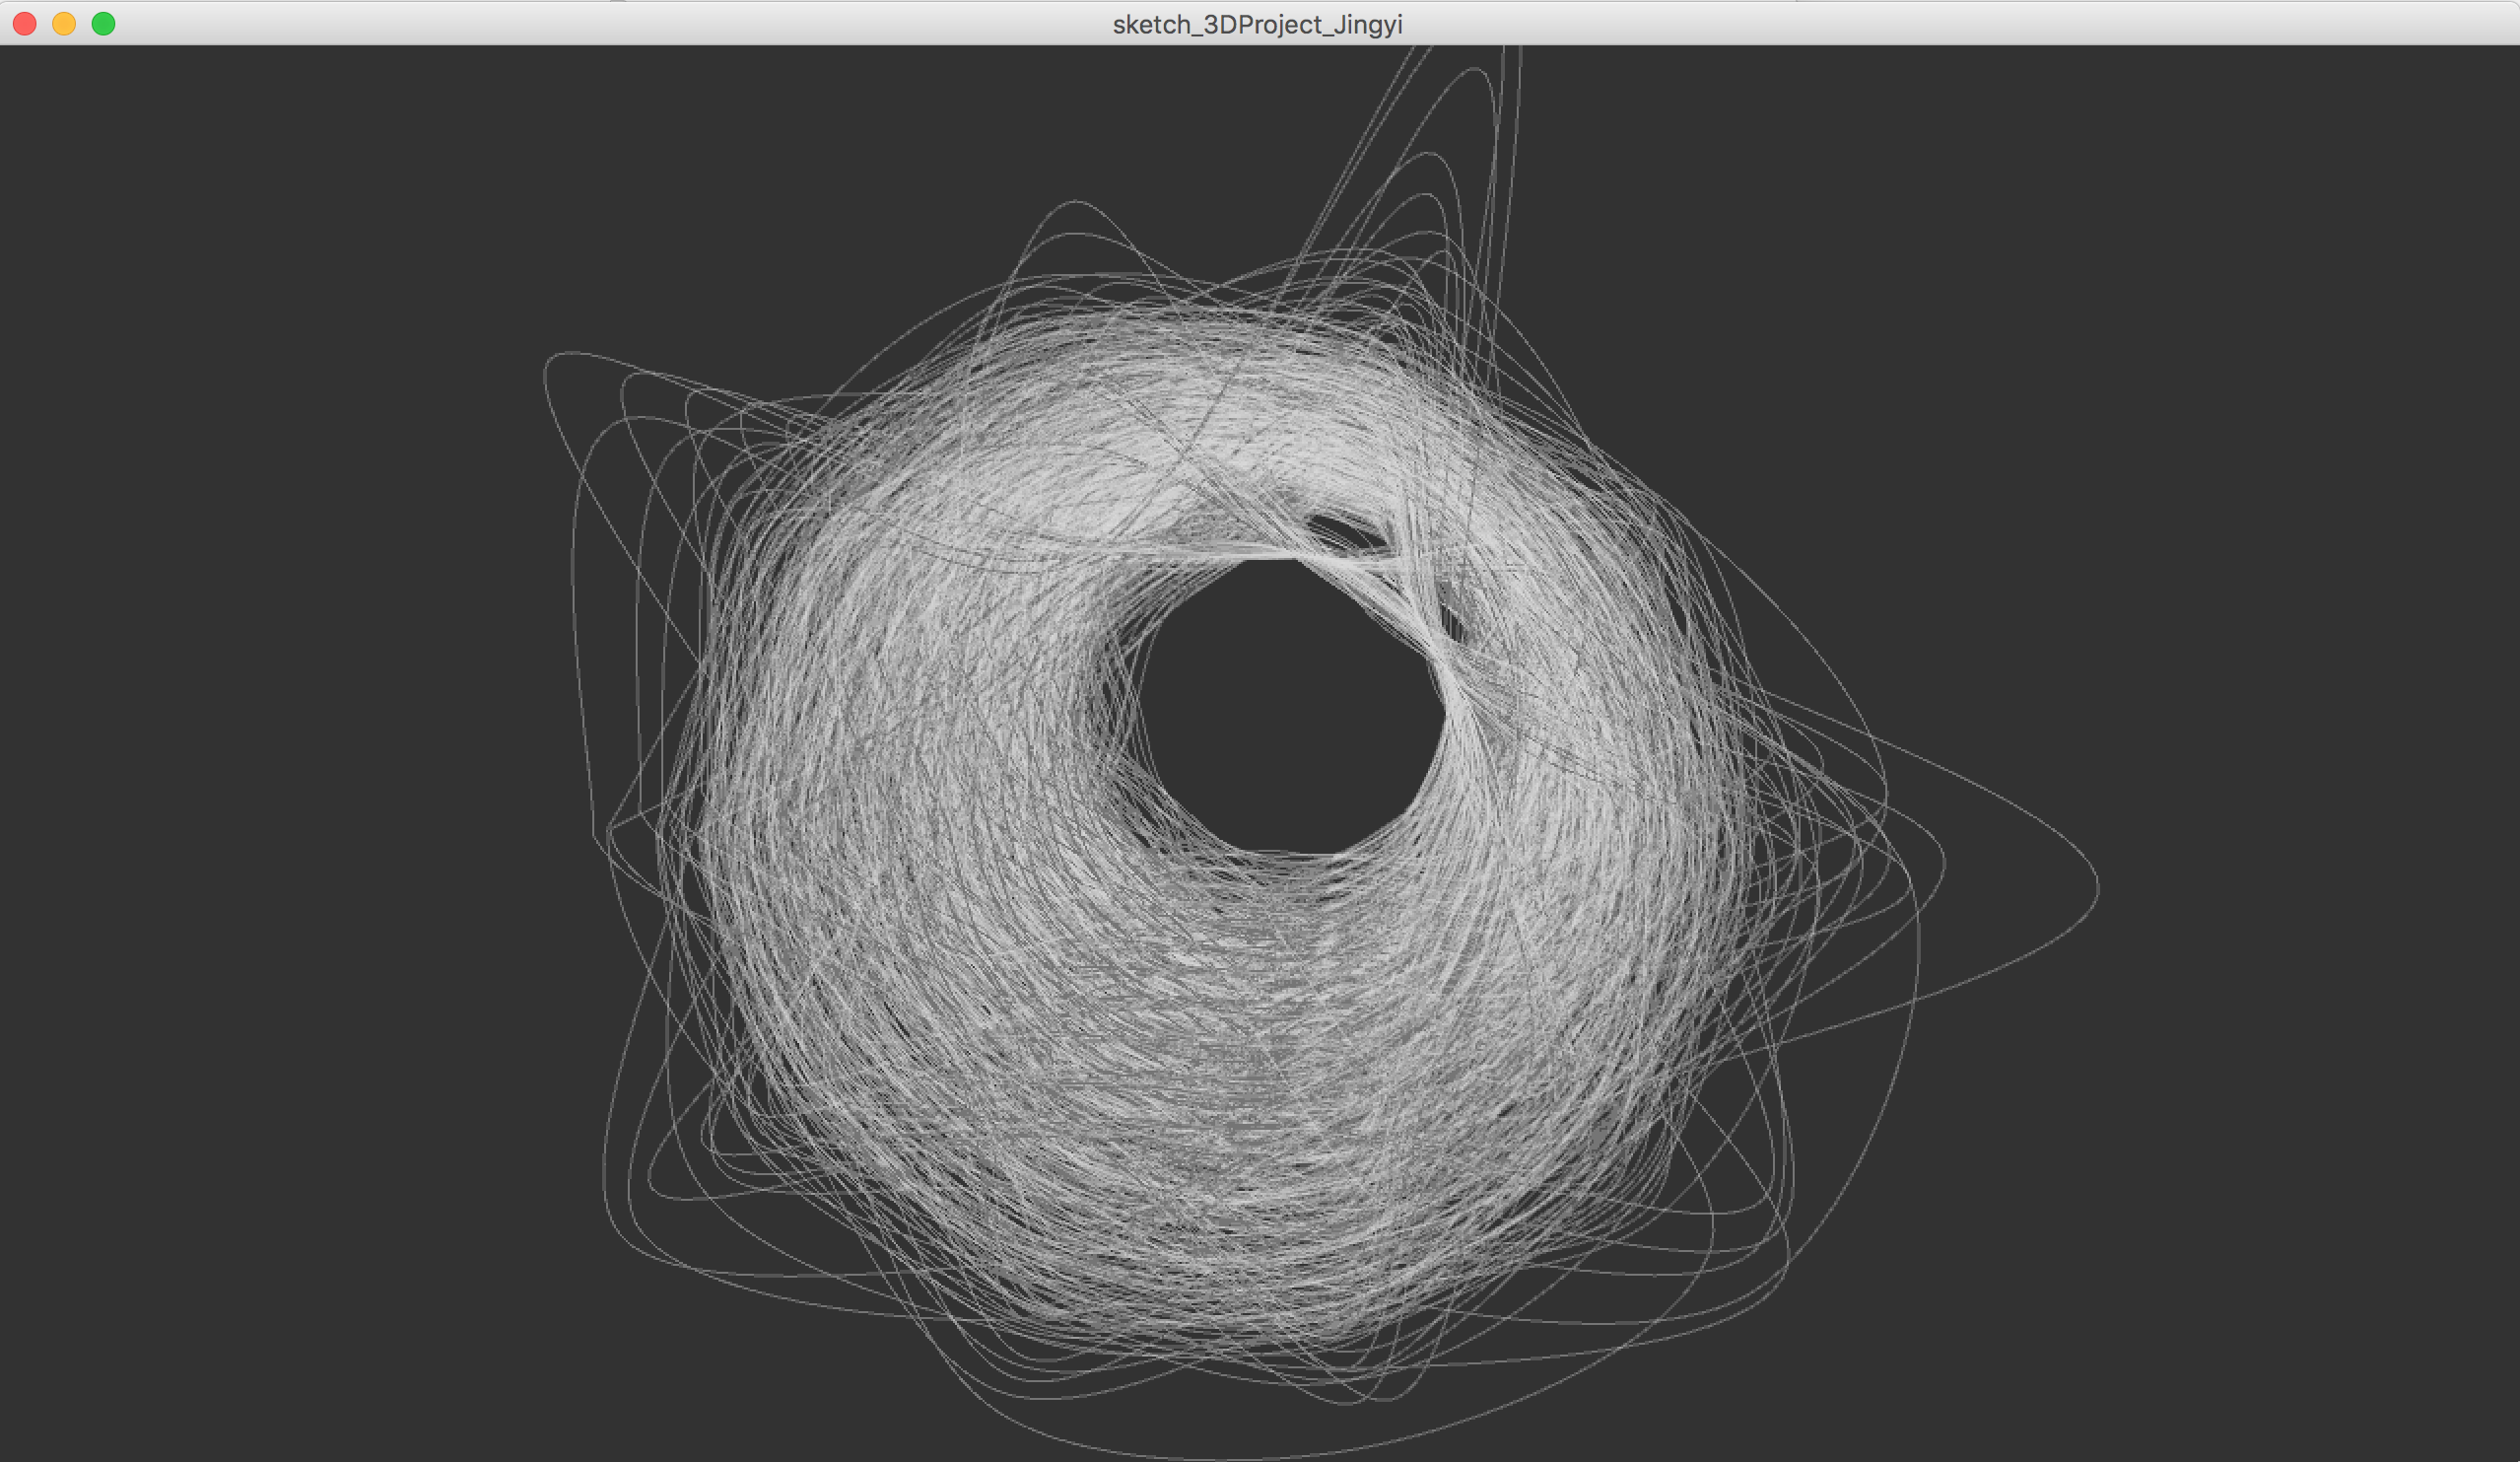
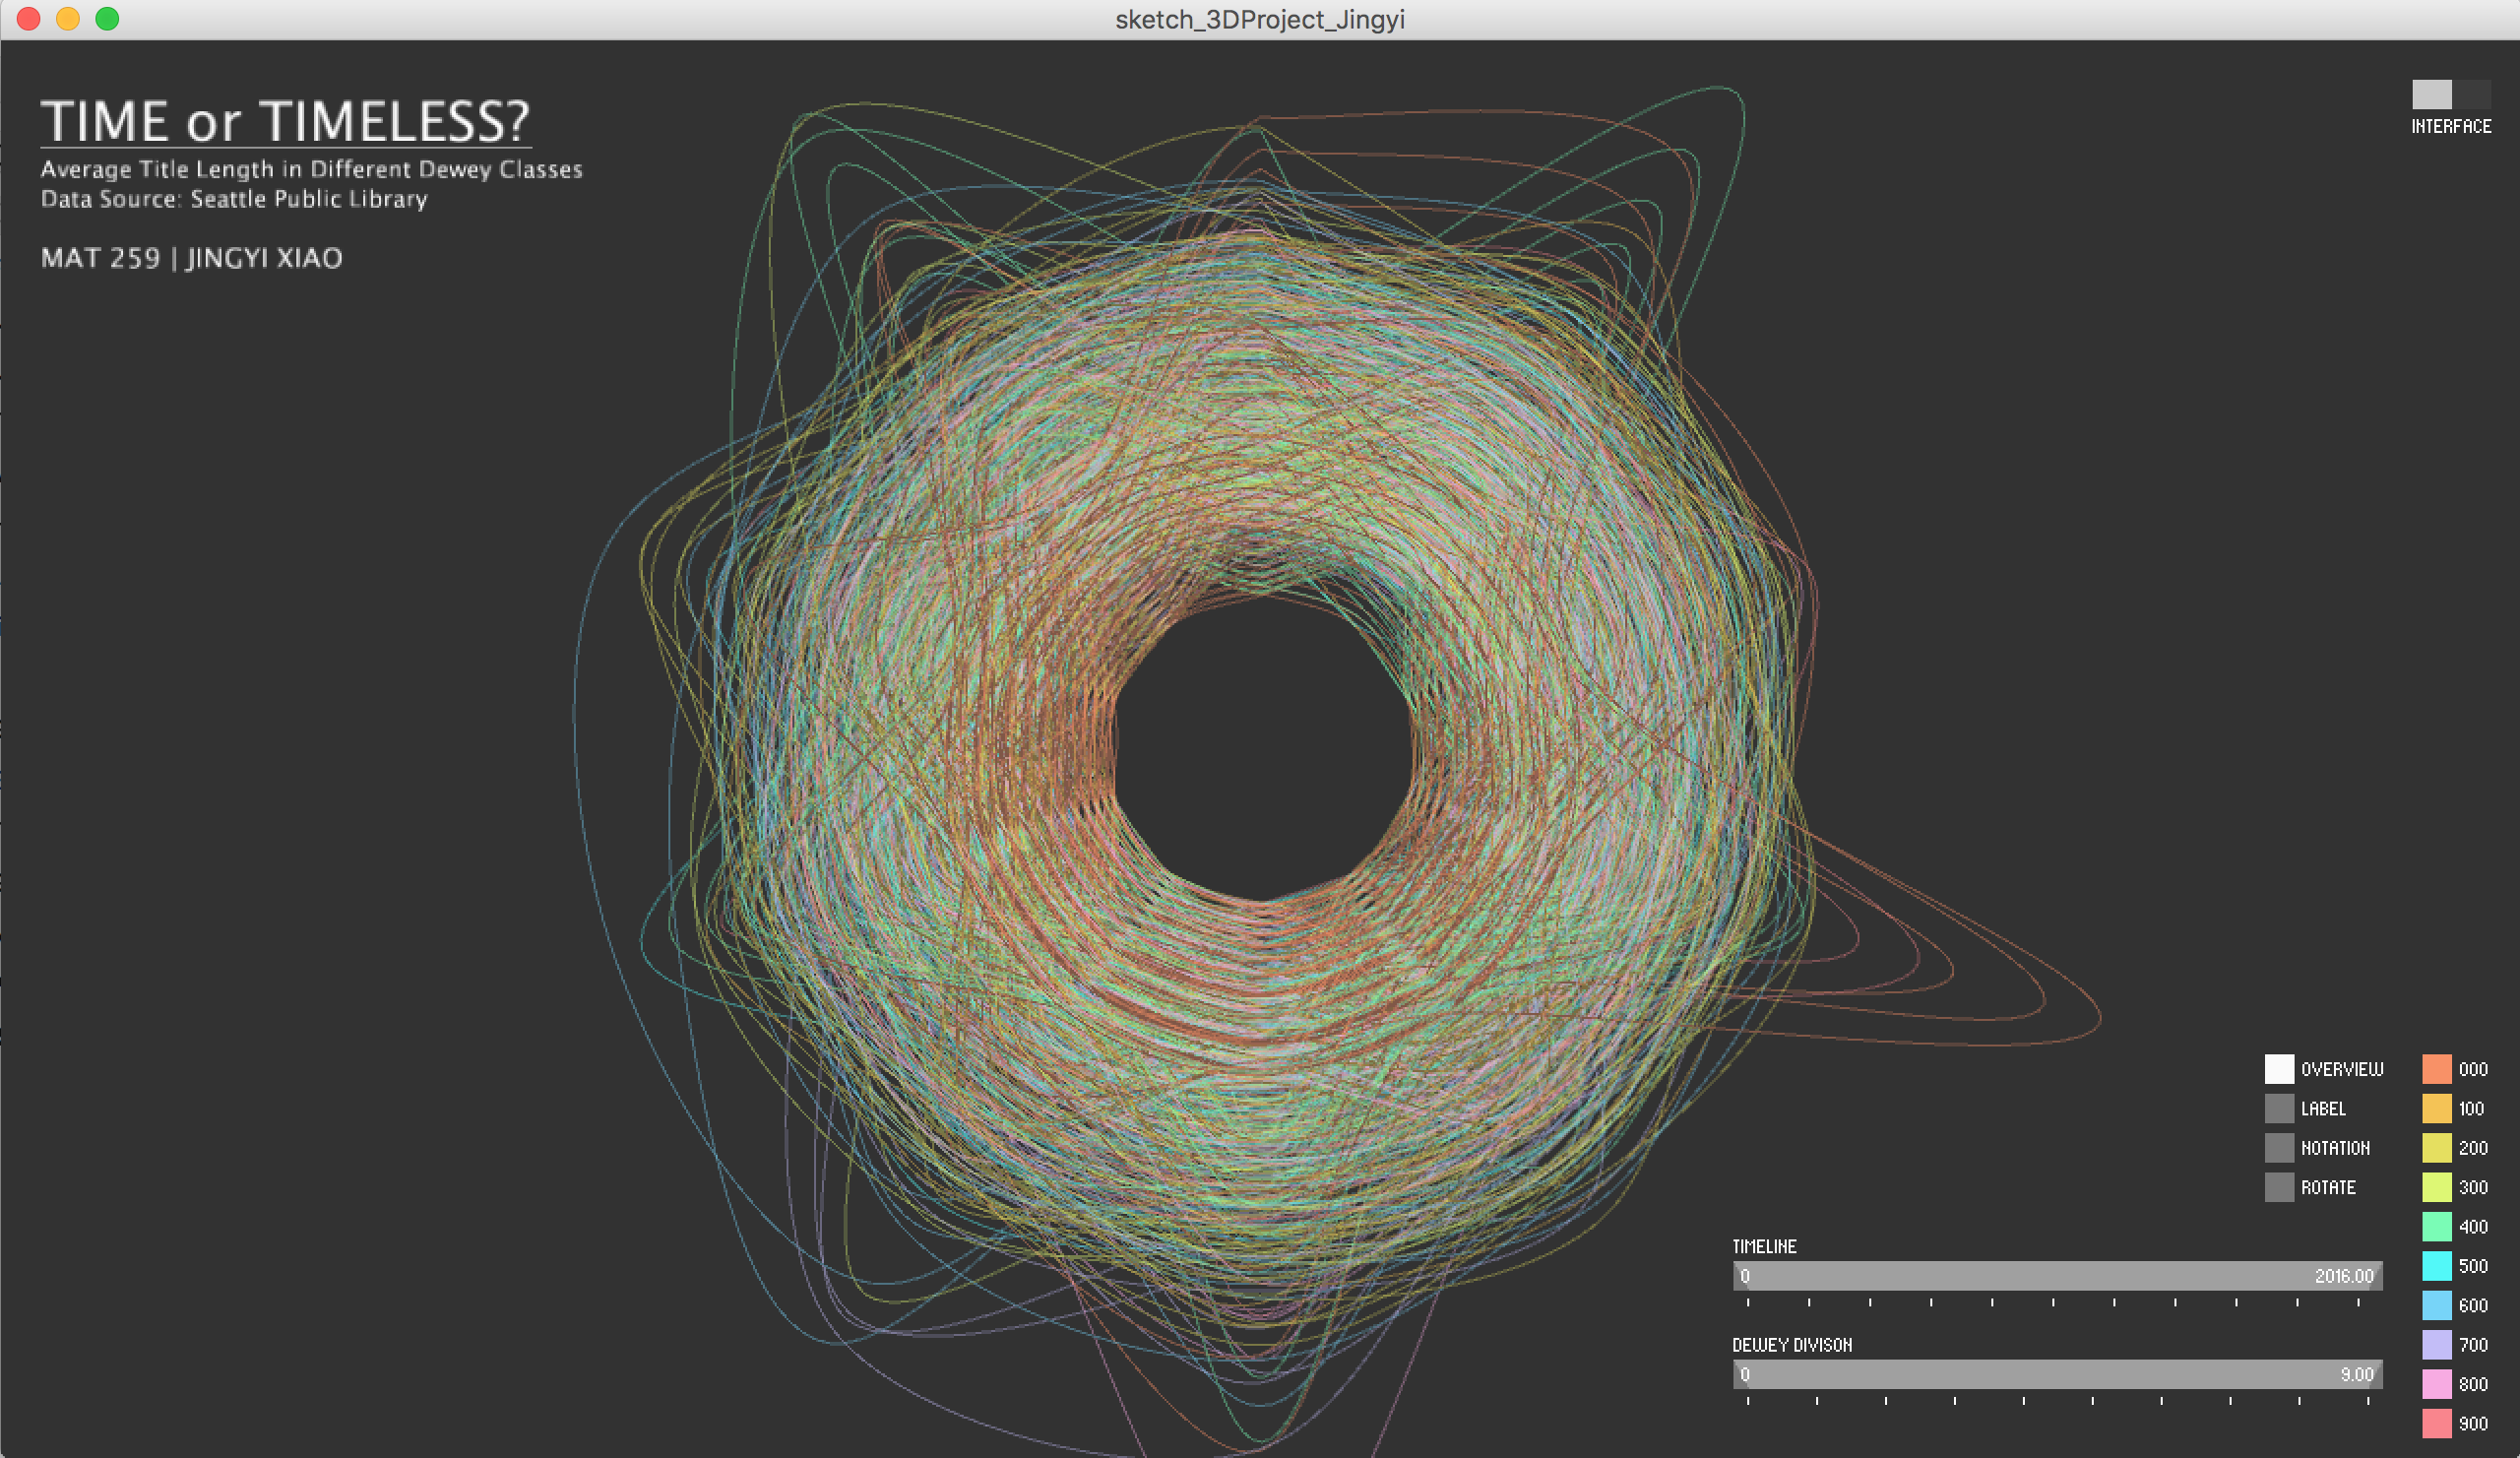
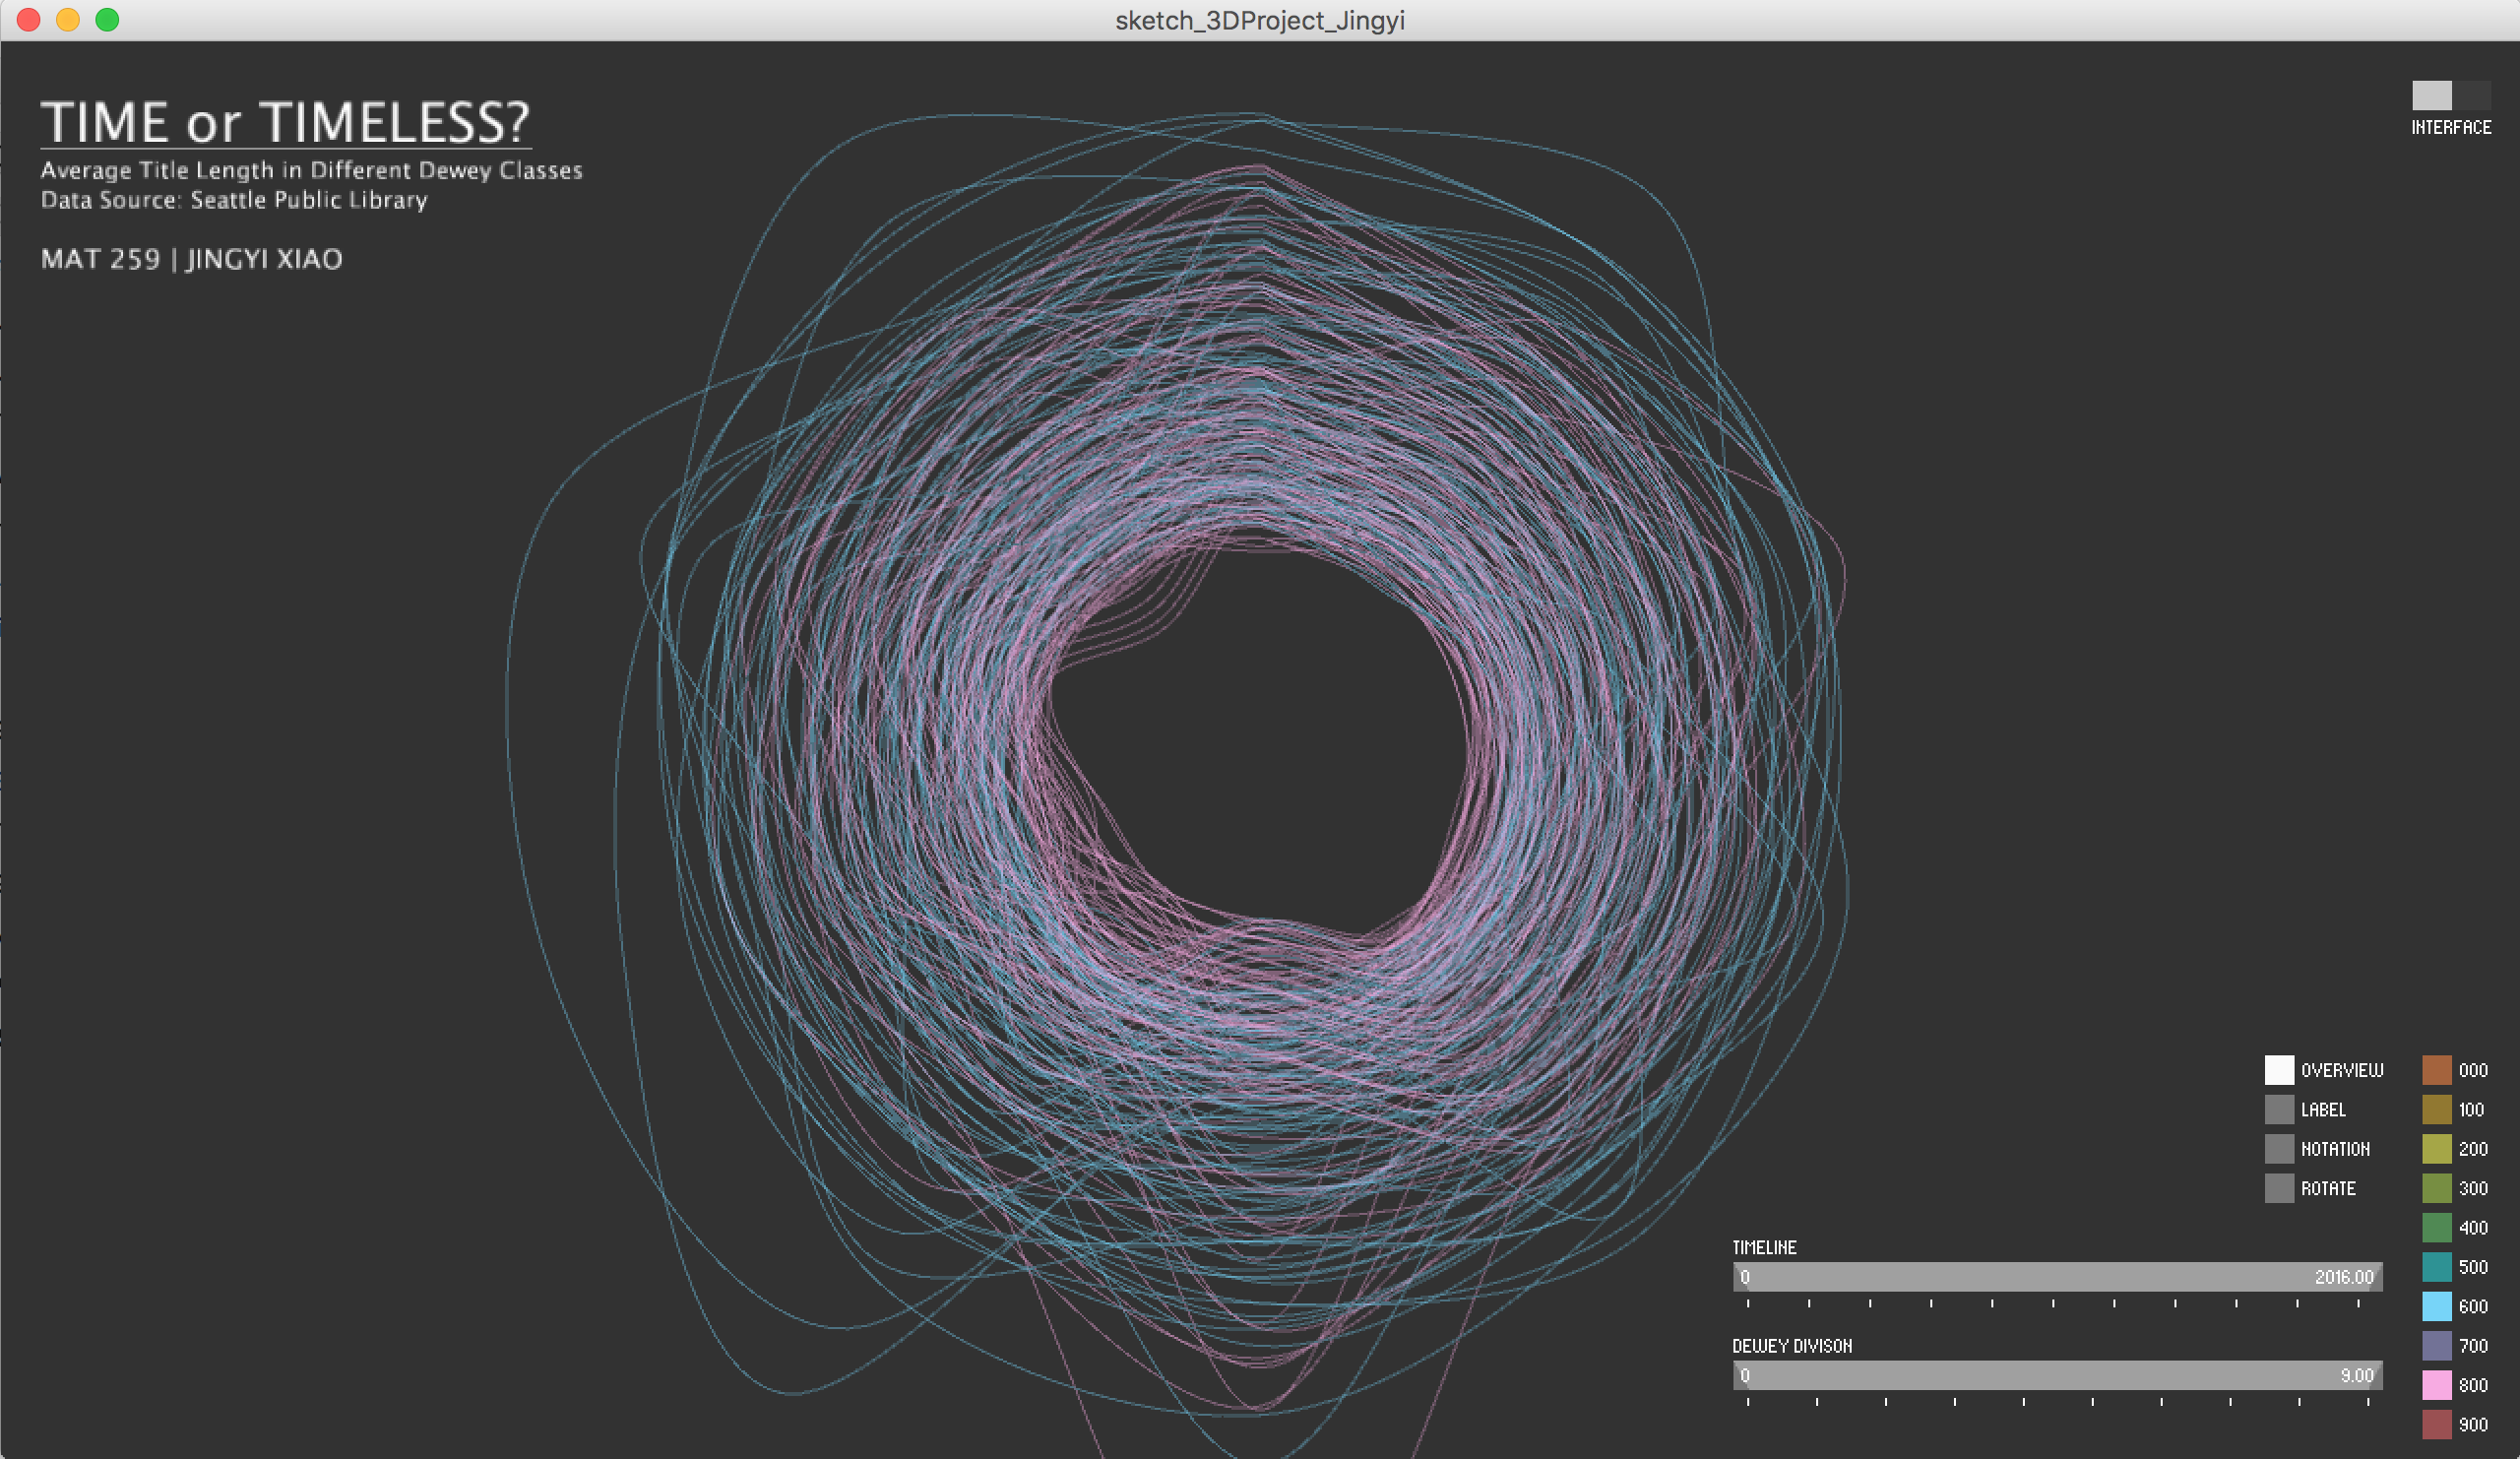
Visualization concept
In the front view, there are lots of curves overlap together. Every color represents a Dewey class. Time goes from back to front. There are 11 'bundles' represent 11 years (2006-2016). In every bundle, there are 10 curves represent 10 Dewey divisions. Every curve is made up of 10 points (linked together), every point is a Dewey section within a Dewey division.
Interaction- Click 'OVERVIEW' checkbox to turn on/off the overview view.
- Click the colorful checkbox to turn on/off the particular Dewey class.
- Click 'LABEL' checkbox to turn on/off the label view.
- Click 'NOTATION' checkbox to turn on/off the notation view.
- Click 'ROTATE' checkbox to turn on/off the another perspective.
- Drag 'TIMELINE' buttons to change to particular time interval.
- Drag 'DEWET DIVISION' buttons to change to particular Dewey divisions.
- Click 'INTERFACE' icon to turn on/off the title information.
Just look the shape of every Dewey class, we can see the difference within some Dewey class is really small, like Dewey 300, 500, 600 and 800, while the others differ much, like Dewey 000, 400 and 900. So there is really no single pattern can be used to describe this phenomena.
Time-dependentAverage title length in some Dewey section changes a lot in the past 11 year. Like Dewey 93(incunable), changes from around 70 to 140(almost double). Dewey 298 (no longer used) changes from around 30 to 120, and then drop to 60 and go up a little bit in 2016. Title length in Dewey 435(Grammer of standard German), 561(Paleobotany), 626(Not assigned or no longer used), 673(Nonferrous metals), 756(Not assigned or no longer used), 825(English speeches), 903(Dictionaries, encyclopedias, concordances of history) and 927(Biography) also changes over time.
Time-independentMany Dewey sections have a very stable average title length. For example, title length of Dewey 512(Algebra) is very stable at around 30. And Dewey 600, 800 is also very stable.
Assumption- Some books are in a category of no longer used or not assigned, so books are mixed up and hard to find a pattern.
- Some books in certain Dewey class is not very popular and does not have many checkouts, the average is easily influenced by outliers when we do not have a lot of data. But when books are popular and have many checkouts, it is more like a normal distribution, and the average(mean) are more close to mathematical expectation value.