High School English Class Books
MAT 259, 2016
Jared Brooks
Concept
I wanted to find some data that were related by some topic, but also had books that were checked out often. I decided high school english class books would be a good choice. I looked up the top 8 most popular books for high school english and looked at their checkout frequency. I also wanted to see if the same old copies are being used over and over, or if the library was buying new copies.
I looked up the checkout and checkin dates for these 8 books, along with the barcode for each checkout with the following query:
Query
SELECT title,
year(cout),
week(cout),
year(cin),
week(cin),
barcode
FROM spl_2016.inraw
WHERE itemType like "%bk"
AND (title = "great Gatsby"
OR title = "lord of the flies"
OR title = "Romeo and Juliet"
OR title = "to kill a mockingbird"
OR title = "of mice and men"
OR title = "scarlet letter"
OR title = "catcher in the rye"
OR title = "macbeth")
AND year(cout) > 2004
AND barcode > 10000000000
Result
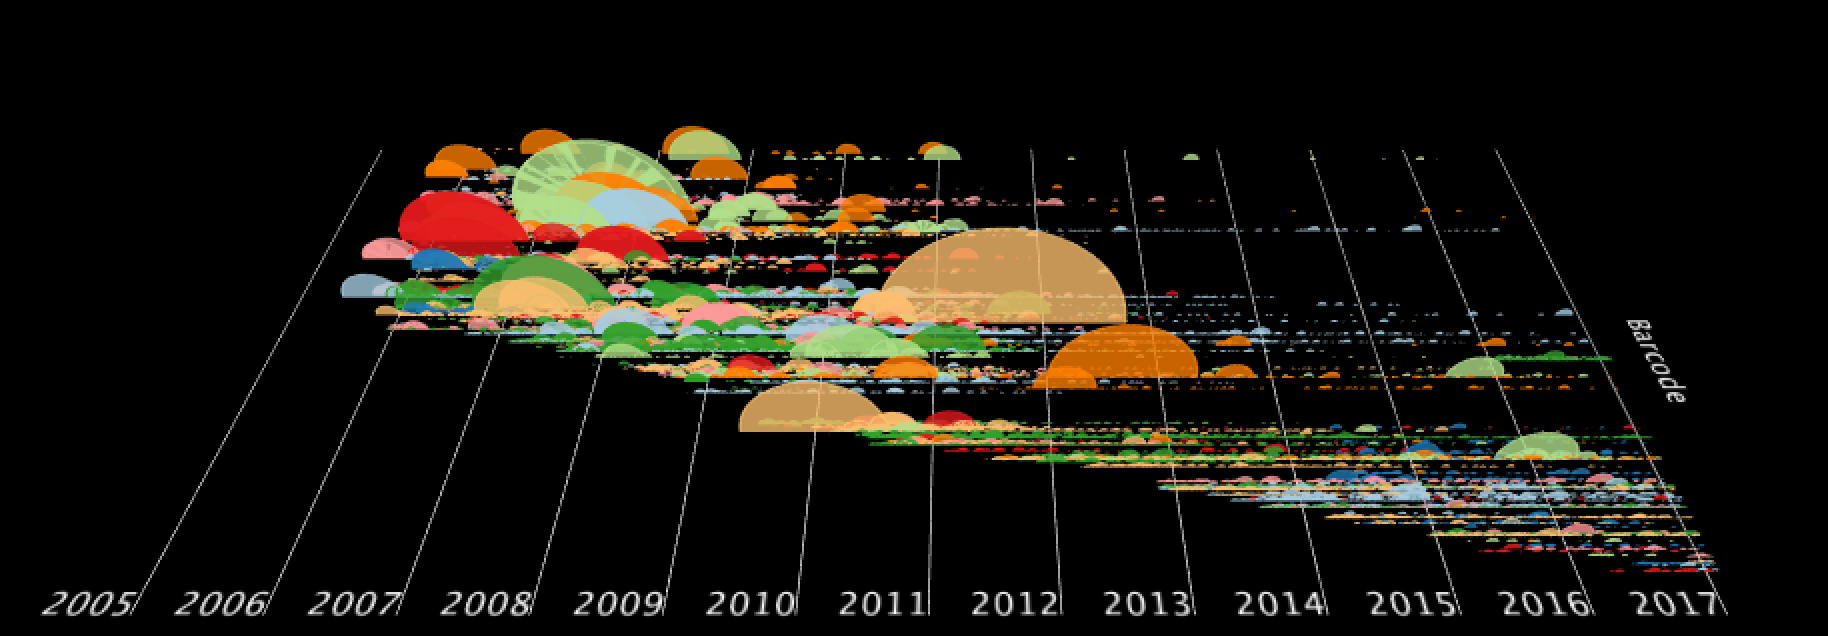
I drew circular arcs from checkout to checkin along the xaxis, with different colors for each title, and placed them on the yaxis according to their barcode. I've also added some animation that shows the dates as a wave, so the wave lights up 2005 data, then 2006, and so on. Along with that, you can toggle music so that the wave plays different notes for each title and the note are modulated by the average barcode so that low barcode have soft, pure notes, and the higher barcodes sound more distorted.
On the flip-side of this visualization, I've plotted a histogram of the popularity of each title by month, and this also can do the wave animation. Both height and opacity depend on checkout popularity.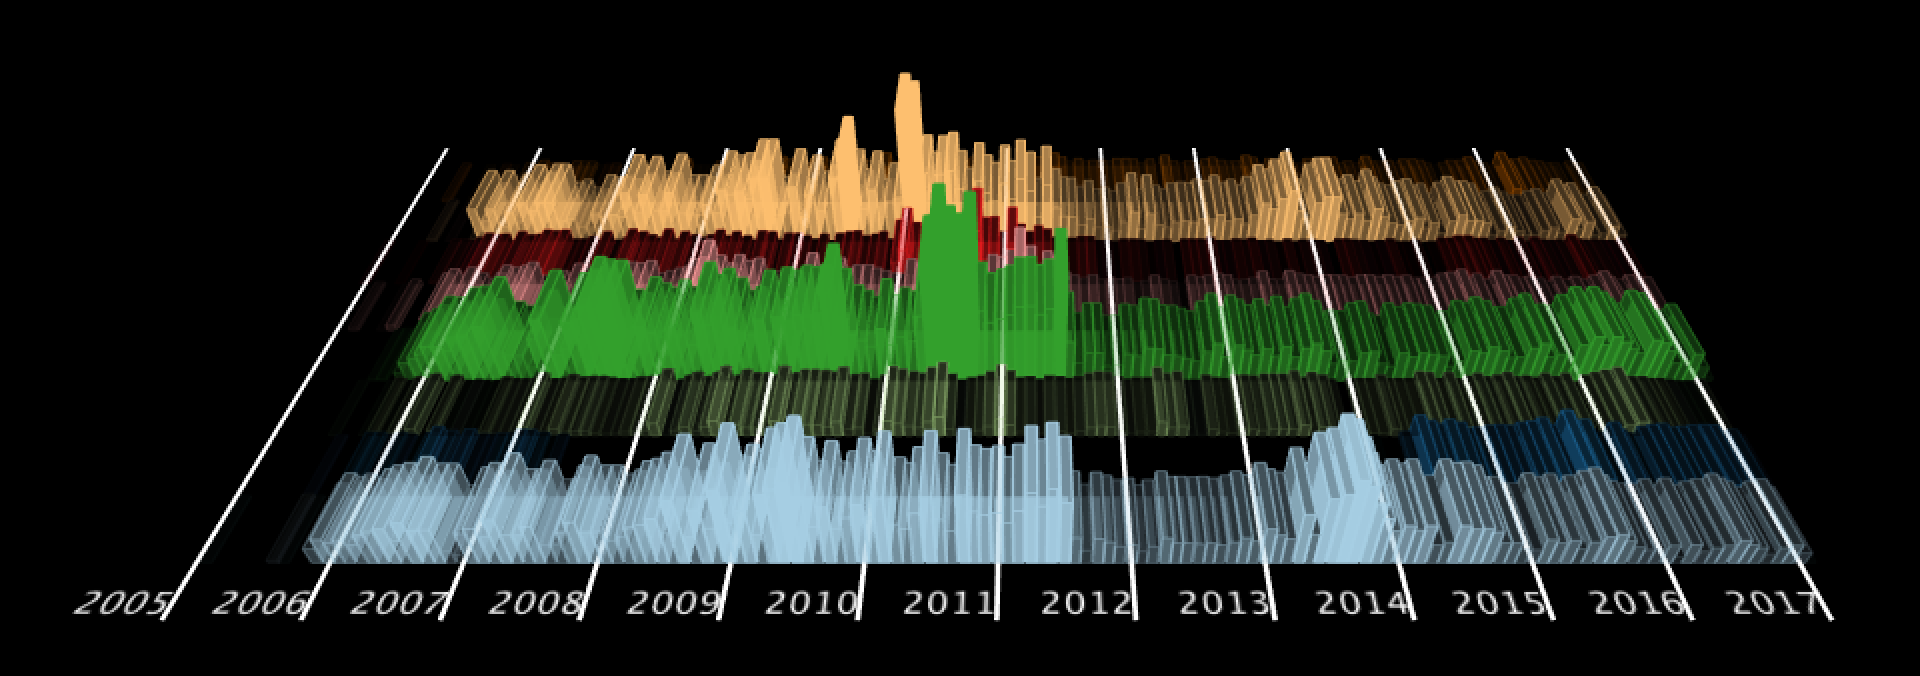
There is interaction functionality to quickly flip between the visualization top and bottom by pressing 'f'. The data for this side come from the following query:
Query
SELECT DATE_FORMAT(cout,'%Y/%m') AS yearmonth,
sum(case when title = "great Gatsby" then 1 else 0 end) as greatgatsby,
sum(case when title = "lord of the flies" then 1 else 0 end) as lordoftheflies,
sum(case when title = "Romeo and Juliet" then 1 else 0 end) as romeoandjuliet,
sum(case when title = "to kill a mockingbird" then 1 else 0 end) as tokillamockingbird,
sum(case when title = "of mice and men" then 1 else 0 end) as ofmiceandmen,
sum(case when title = "scarlet letter" then 1 else 0 end) as scarletletter,
sum(case when title = "catcher in the rye" then 1 else 0 end) as catcherintherye,
sum(case when title = "macbeth" then 1 else 0 end) as macbeth
FROM spl_2016.inraw
WHERE itemType like "%bk"
AND year(cout) > 2004
AND barcode > 10000000000
GROUP BY yearmonth
ORDER BY yearmonth
Evaluation/Analysis
Mainly I learned a lot about the subtleties of plotting in 3D, too many to go into here. But as for the data, it is interesting to see that most of the barcodes existed since 2005, but almost half have been created since then. The rate at which the library gets new copies of the books can be seen from the top-side visualization.
Still, though, some books have old copies that still get used. And some books go in and out of popularity (Lord of the Flies).
Still, though, some books have old copies that still get used. And some books go in and out of popularity (Lord of the Flies).
Code