Revolving around the Space Needle
MAT 259, 2016
Ariella Gilmore
Concept
I was interested in knowing how the decade from 2006 to 2016 effected people's interests in the planets in our solar system. I looked at the average duration of checkout for each item that contained a planet's name in the title and the amount of times items were checked out that contained a planet's name. I also included Pluto as being one of the planets because I thought it might give interesting data points compared to the rest of the planets.
Query
1st Query:
SELECT
year(cout),
COUNT(CASE WHEN title LIKE '%Mercury%' THEN 1 END) as
Mercury,
COUNT(CASE WHEN title LIKE '%Venus%' THEN 1 END) as
Venus,
COUNT(CASE WHEN title LIKE '%Earth%' THEN 1 END) as
Earth,
COUNT(CASE WHEN title LIKE '%Mars%' THEN 1 END) as
Mars,
COUNT(CASE WHEN title LIKE '%Jupiter%' THEN 1 END) as
Jupiter,
COUNT(CASE WHEN title LIKE '%Saturn%' THEN 1 END) as
Saturn,
COUNT(CASE WHEN title LIKE '%Uranus%' THEN 1 END) as
Uranus,
COUNT(CASE WHEN title LIKE '%Neptune%' THEN 1 END) as
Neptune,
COUNT(CASE WHEN title LIKE '%Pluto%' THEN 1 END) as
Pluto
FROM spl_2016.inraw
WHERE year(cout) > 2005 and year(cout) < 2017
GROUP BY year(cout)
ORDER BY year(cout);
2nd Query:
SELECT
year(cout),
AVG(CASE WHEN title LIKE '%Mercury%' THEN datediff(cin,cout) END) as
Mercury,
AVG(CASE WHEN title LIKE '%Venus%' THEN datediff(cin,cout) END) as
Venus,
AVG(CASE WHEN title LIKE '%Earth%' THEN datediff(cin,cout) END) as
Earth,
AVG(CASE WHEN title LIKE '%Mars%' THEN datediff(cin,cout) END) as
Mars,
AVG(CASE WHEN title LIKE '%Jupiter%' THEN datediff(cin,cout) END) as
Jupiter,
AVG(CASE WHEN title LIKE '%Saturn%' THEN datediff(cin,cout) END) as
Saturn,
AVG(CASE WHEN title LIKE '%Uranus%' THEN datediff(cin,cout) END) as
Uranus,
AVG(CASE WHEN title LIplaKE '%Neptune%' THEN datediff(cin,cout) END) as
Neptune,
AVG(CASE WHEN title LIKE '%Pluto%' THEN datediff(cin,cout) END) as
Pluto
FROM spl_2016.inraw
WHERE year(cout) > 2005 and year(cout) < 2017
GROUP BY year(cout)
ORDER BY year(cout);
Third Query:
same as the first, but also includes months
SELECT
year(cout),
COUNT(CASE WHEN title LIKE '%Mercury%' THEN 1 END) as
Mercury,
COUNT(CASE WHEN title LIKE '%Venus%' THEN 1 END) as
Venus,
COUNT(CASE WHEN title LIKE '%Earth%' THEN 1 END) as
Earth,
COUNT(CASE WHEN title LIKE '%Mars%' THEN 1 END) as
Mars,
COUNT(CASE WHEN title LIKE '%Jupiter%' THEN 1 END) as
Jupiter,
COUNT(CASE WHEN title LIKE '%Saturn%' THEN 1 END) as
Saturn,
COUNT(CASE WHEN title LIKE '%Uranus%' THEN 1 END) as
Uranus,
COUNT(CASE WHEN title LIKE '%Neptune%' THEN 1 END) as
Neptune,
COUNT(CASE WHEN title LIKE '%Pluto%' THEN 1 END) as
Pluto
FROM spl_2016.inraw
WHERE year(cout) > 2005 and year(cout) < 2017
GROUP BY year(cout)
ORDER BY year(cout);
2nd Query:
SELECT
year(cout),
AVG(CASE WHEN title LIKE '%Mercury%' THEN datediff(cin,cout) END) as
Mercury,
AVG(CASE WHEN title LIKE '%Venus%' THEN datediff(cin,cout) END) as
Venus,
AVG(CASE WHEN title LIKE '%Earth%' THEN datediff(cin,cout) END) as
Earth,
AVG(CASE WHEN title LIKE '%Mars%' THEN datediff(cin,cout) END) as
Mars,
AVG(CASE WHEN title LIKE '%Jupiter%' THEN datediff(cin,cout) END) as
Jupiter,
AVG(CASE WHEN title LIKE '%Saturn%' THEN datediff(cin,cout) END) as
Saturn,
AVG(CASE WHEN title LIKE '%Uranus%' THEN datediff(cin,cout) END) as
Uranus,
AVG(CASE WHEN title LIplaKE '%Neptune%' THEN datediff(cin,cout) END) as
Neptune,
AVG(CASE WHEN title LIKE '%Pluto%' THEN datediff(cin,cout) END) as
Pluto
FROM spl_2016.inraw
WHERE year(cout) > 2005 and year(cout) < 2017
GROUP BY year(cout)
ORDER BY year(cout);
Third Query:
same as the first, but also includes months
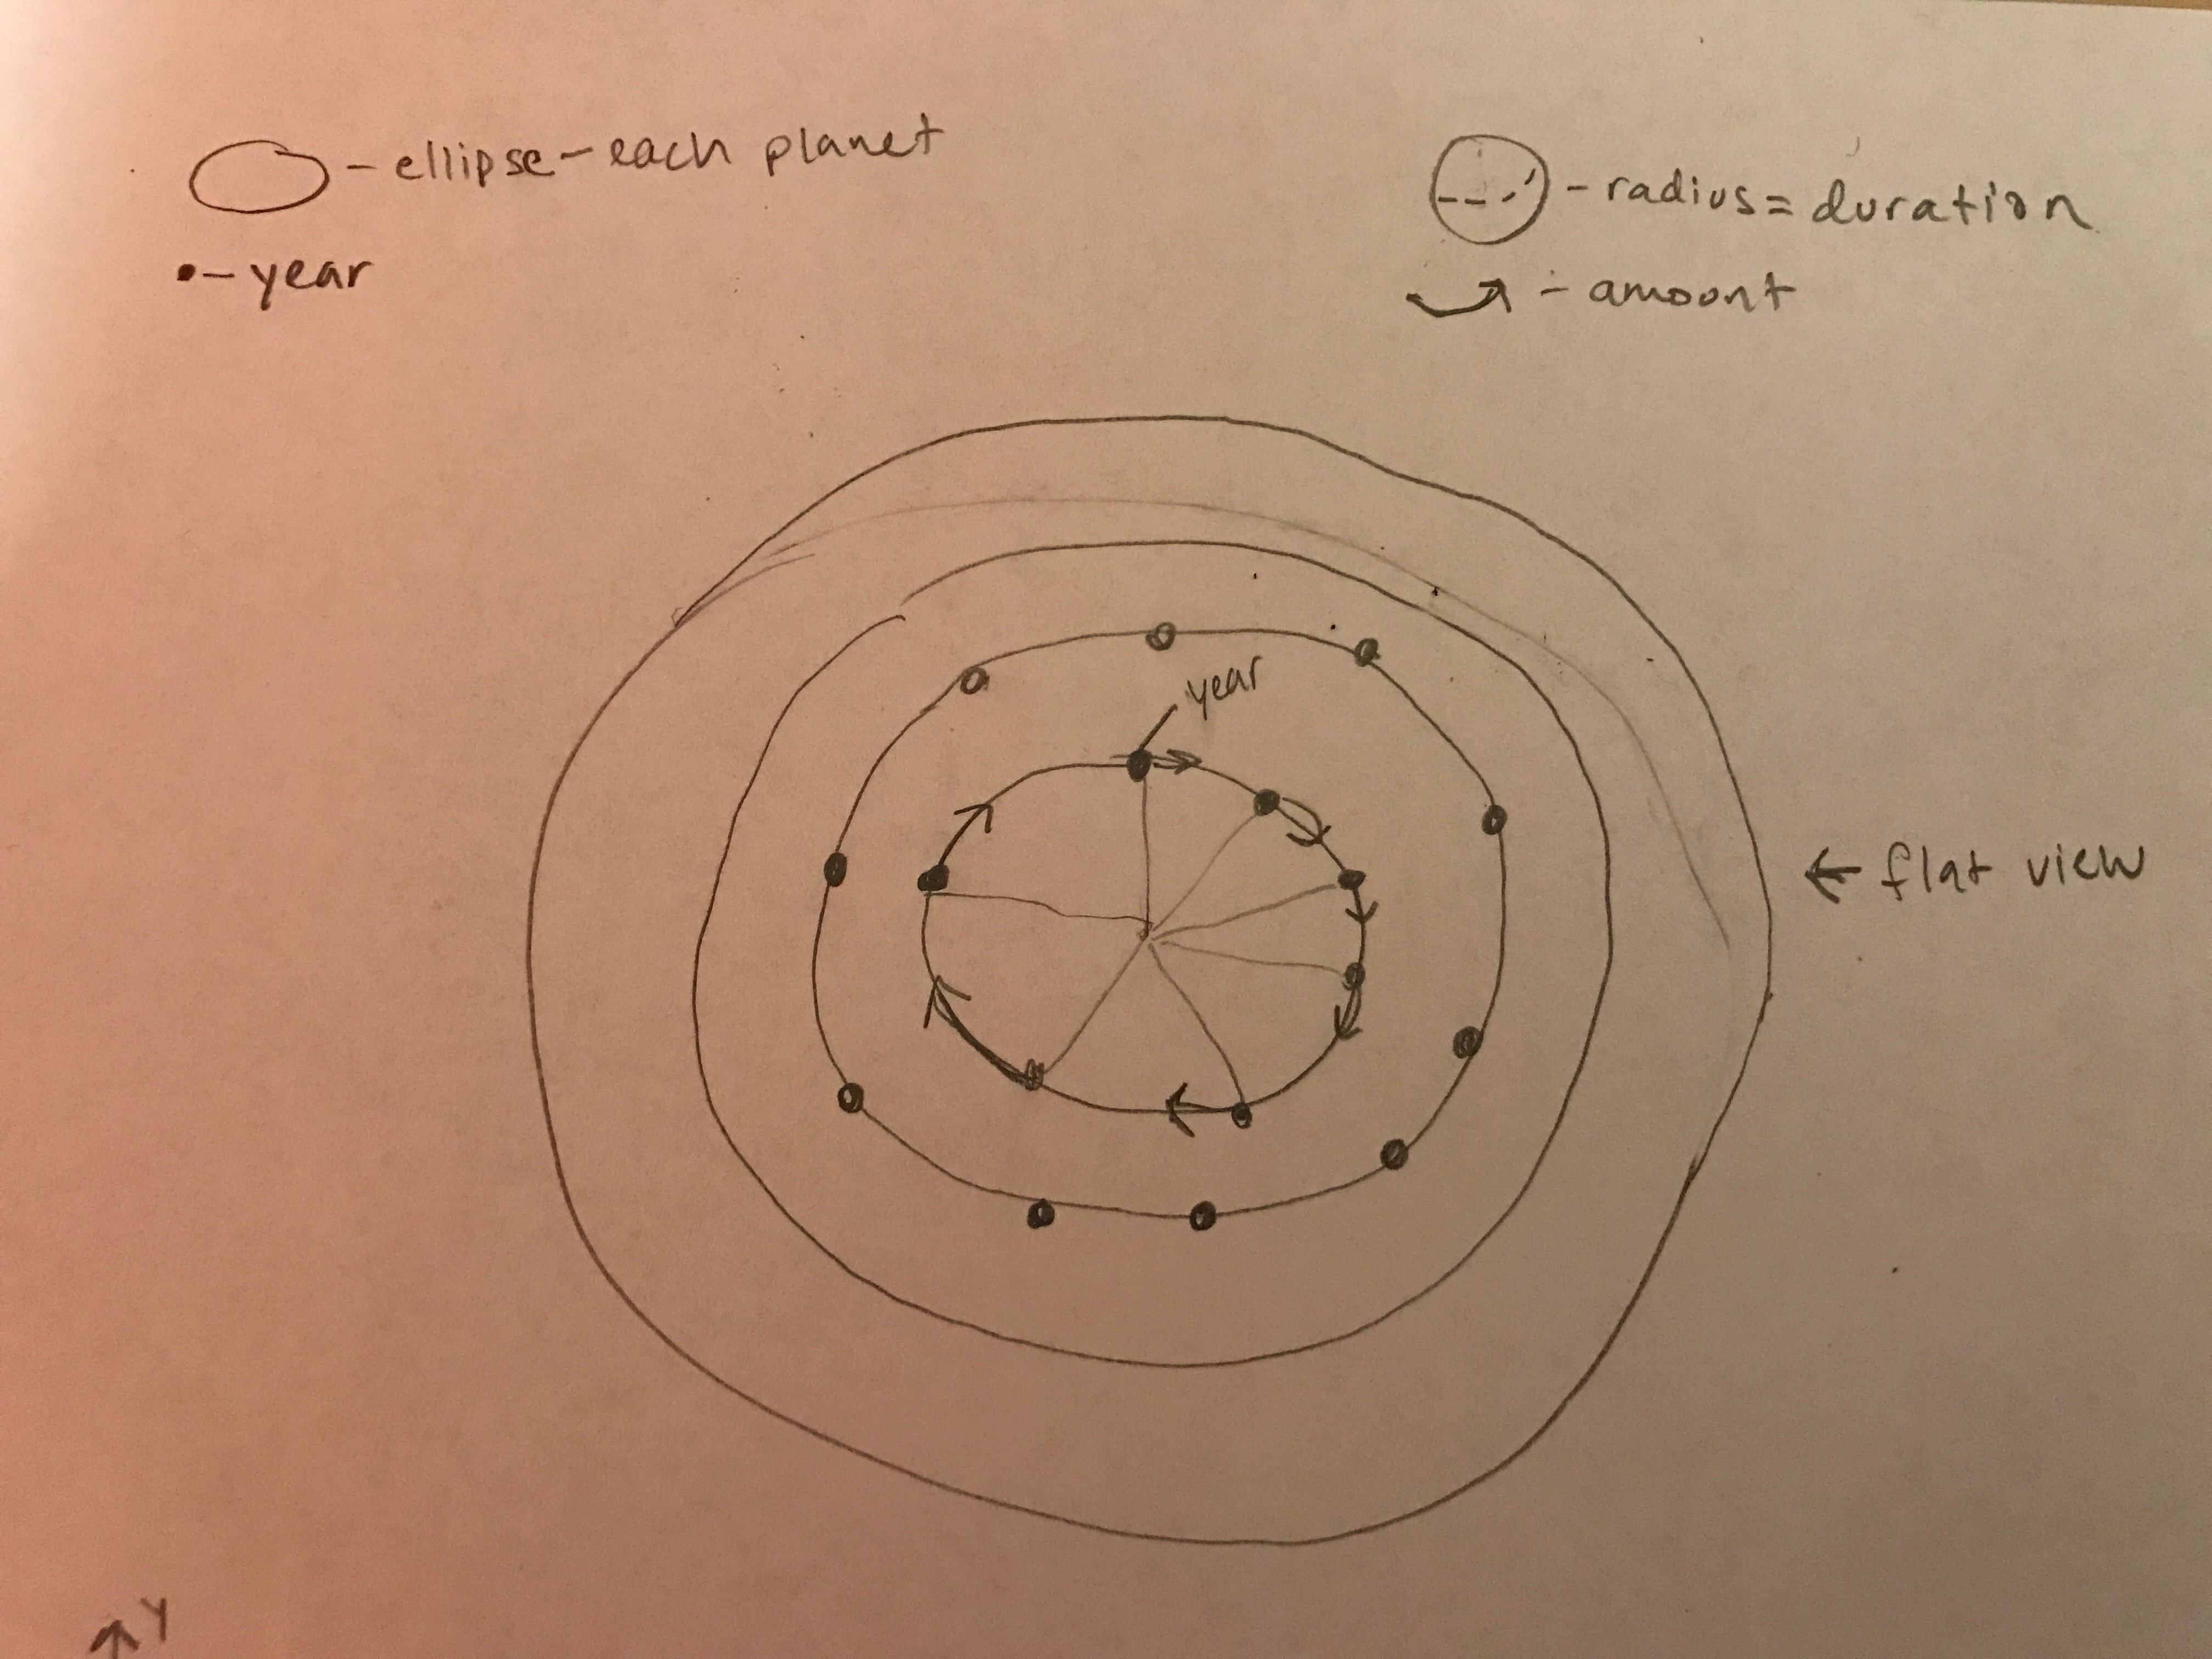
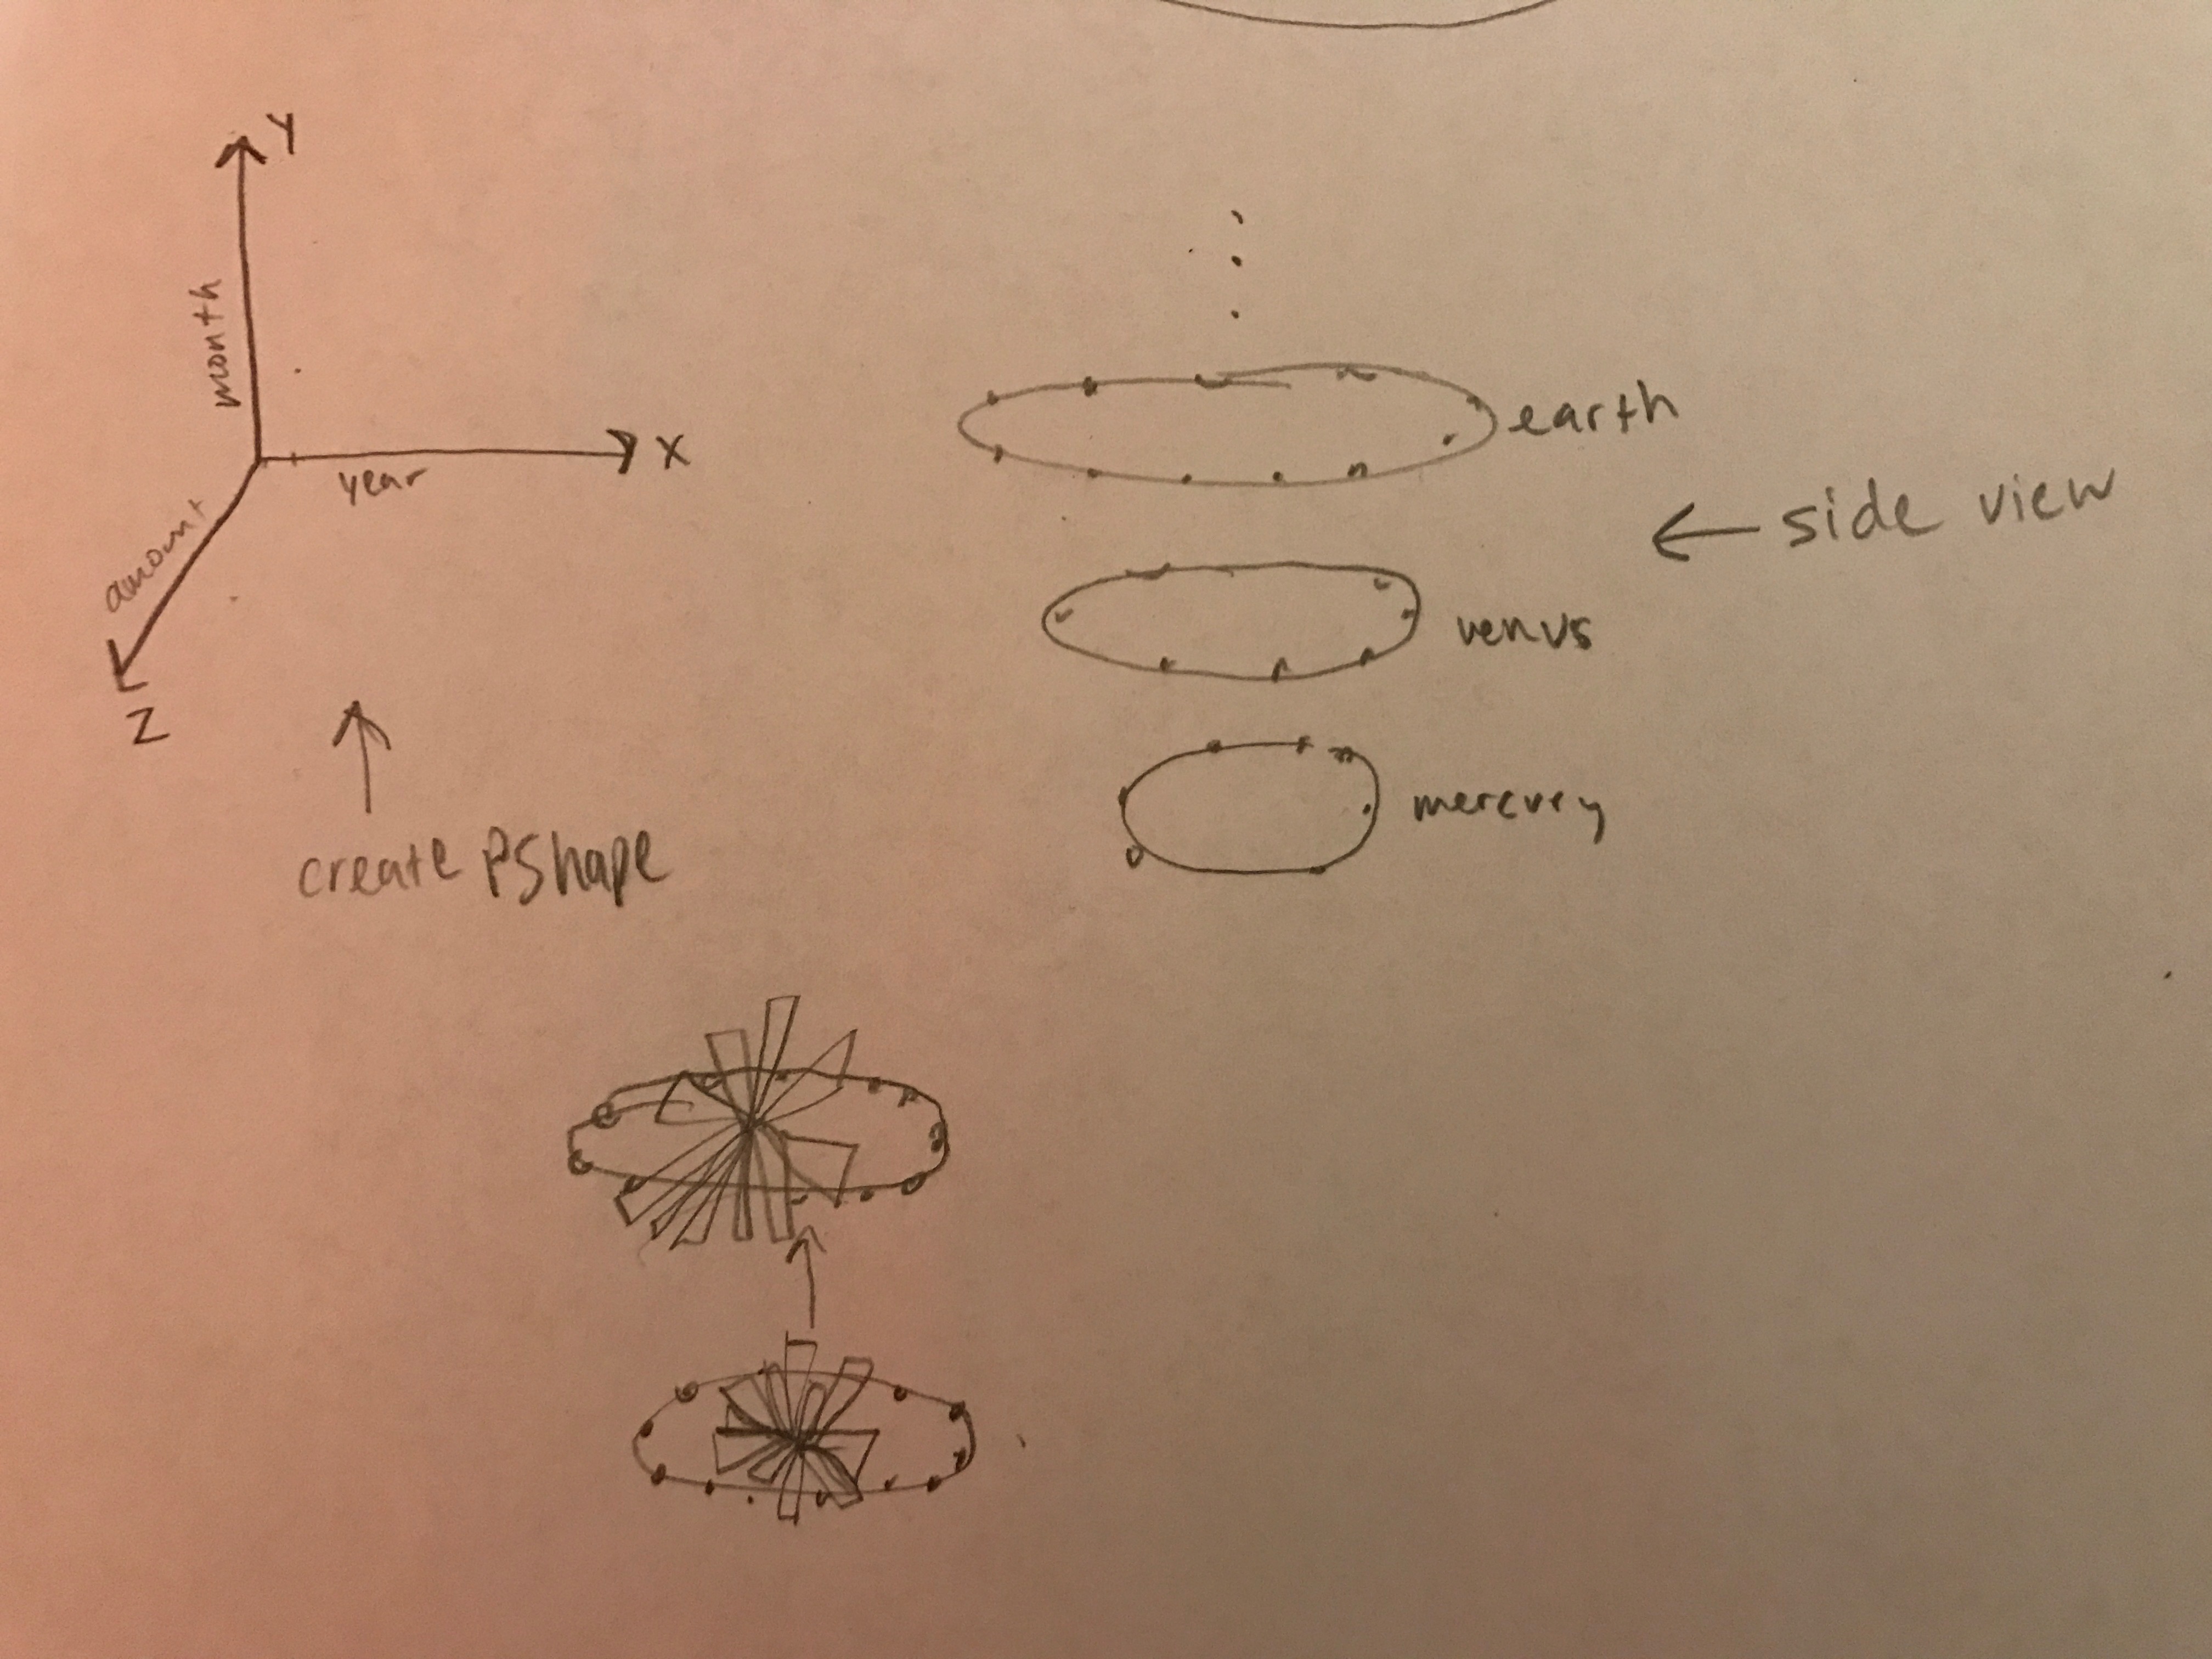
Preliminary sketches
The first image illustrates the basic design of each ellipse being a planet and the spheres are each year. The second image shows how my design evolved by making the design take up more of the 3D space and use more data that I did not think of before.
Process
I first started with seperating each dewey class and creating this orbital shape with sphere revolving around an ellipse. This gave me the idea of using the metaphor of space, which is why I focused my project on planets.
This first image does not have any orbits, which makes it confusing what track each sphere is on. Also, although it is distinct and clear that each year is a seperate color, the colors are not very visually nice to look at.
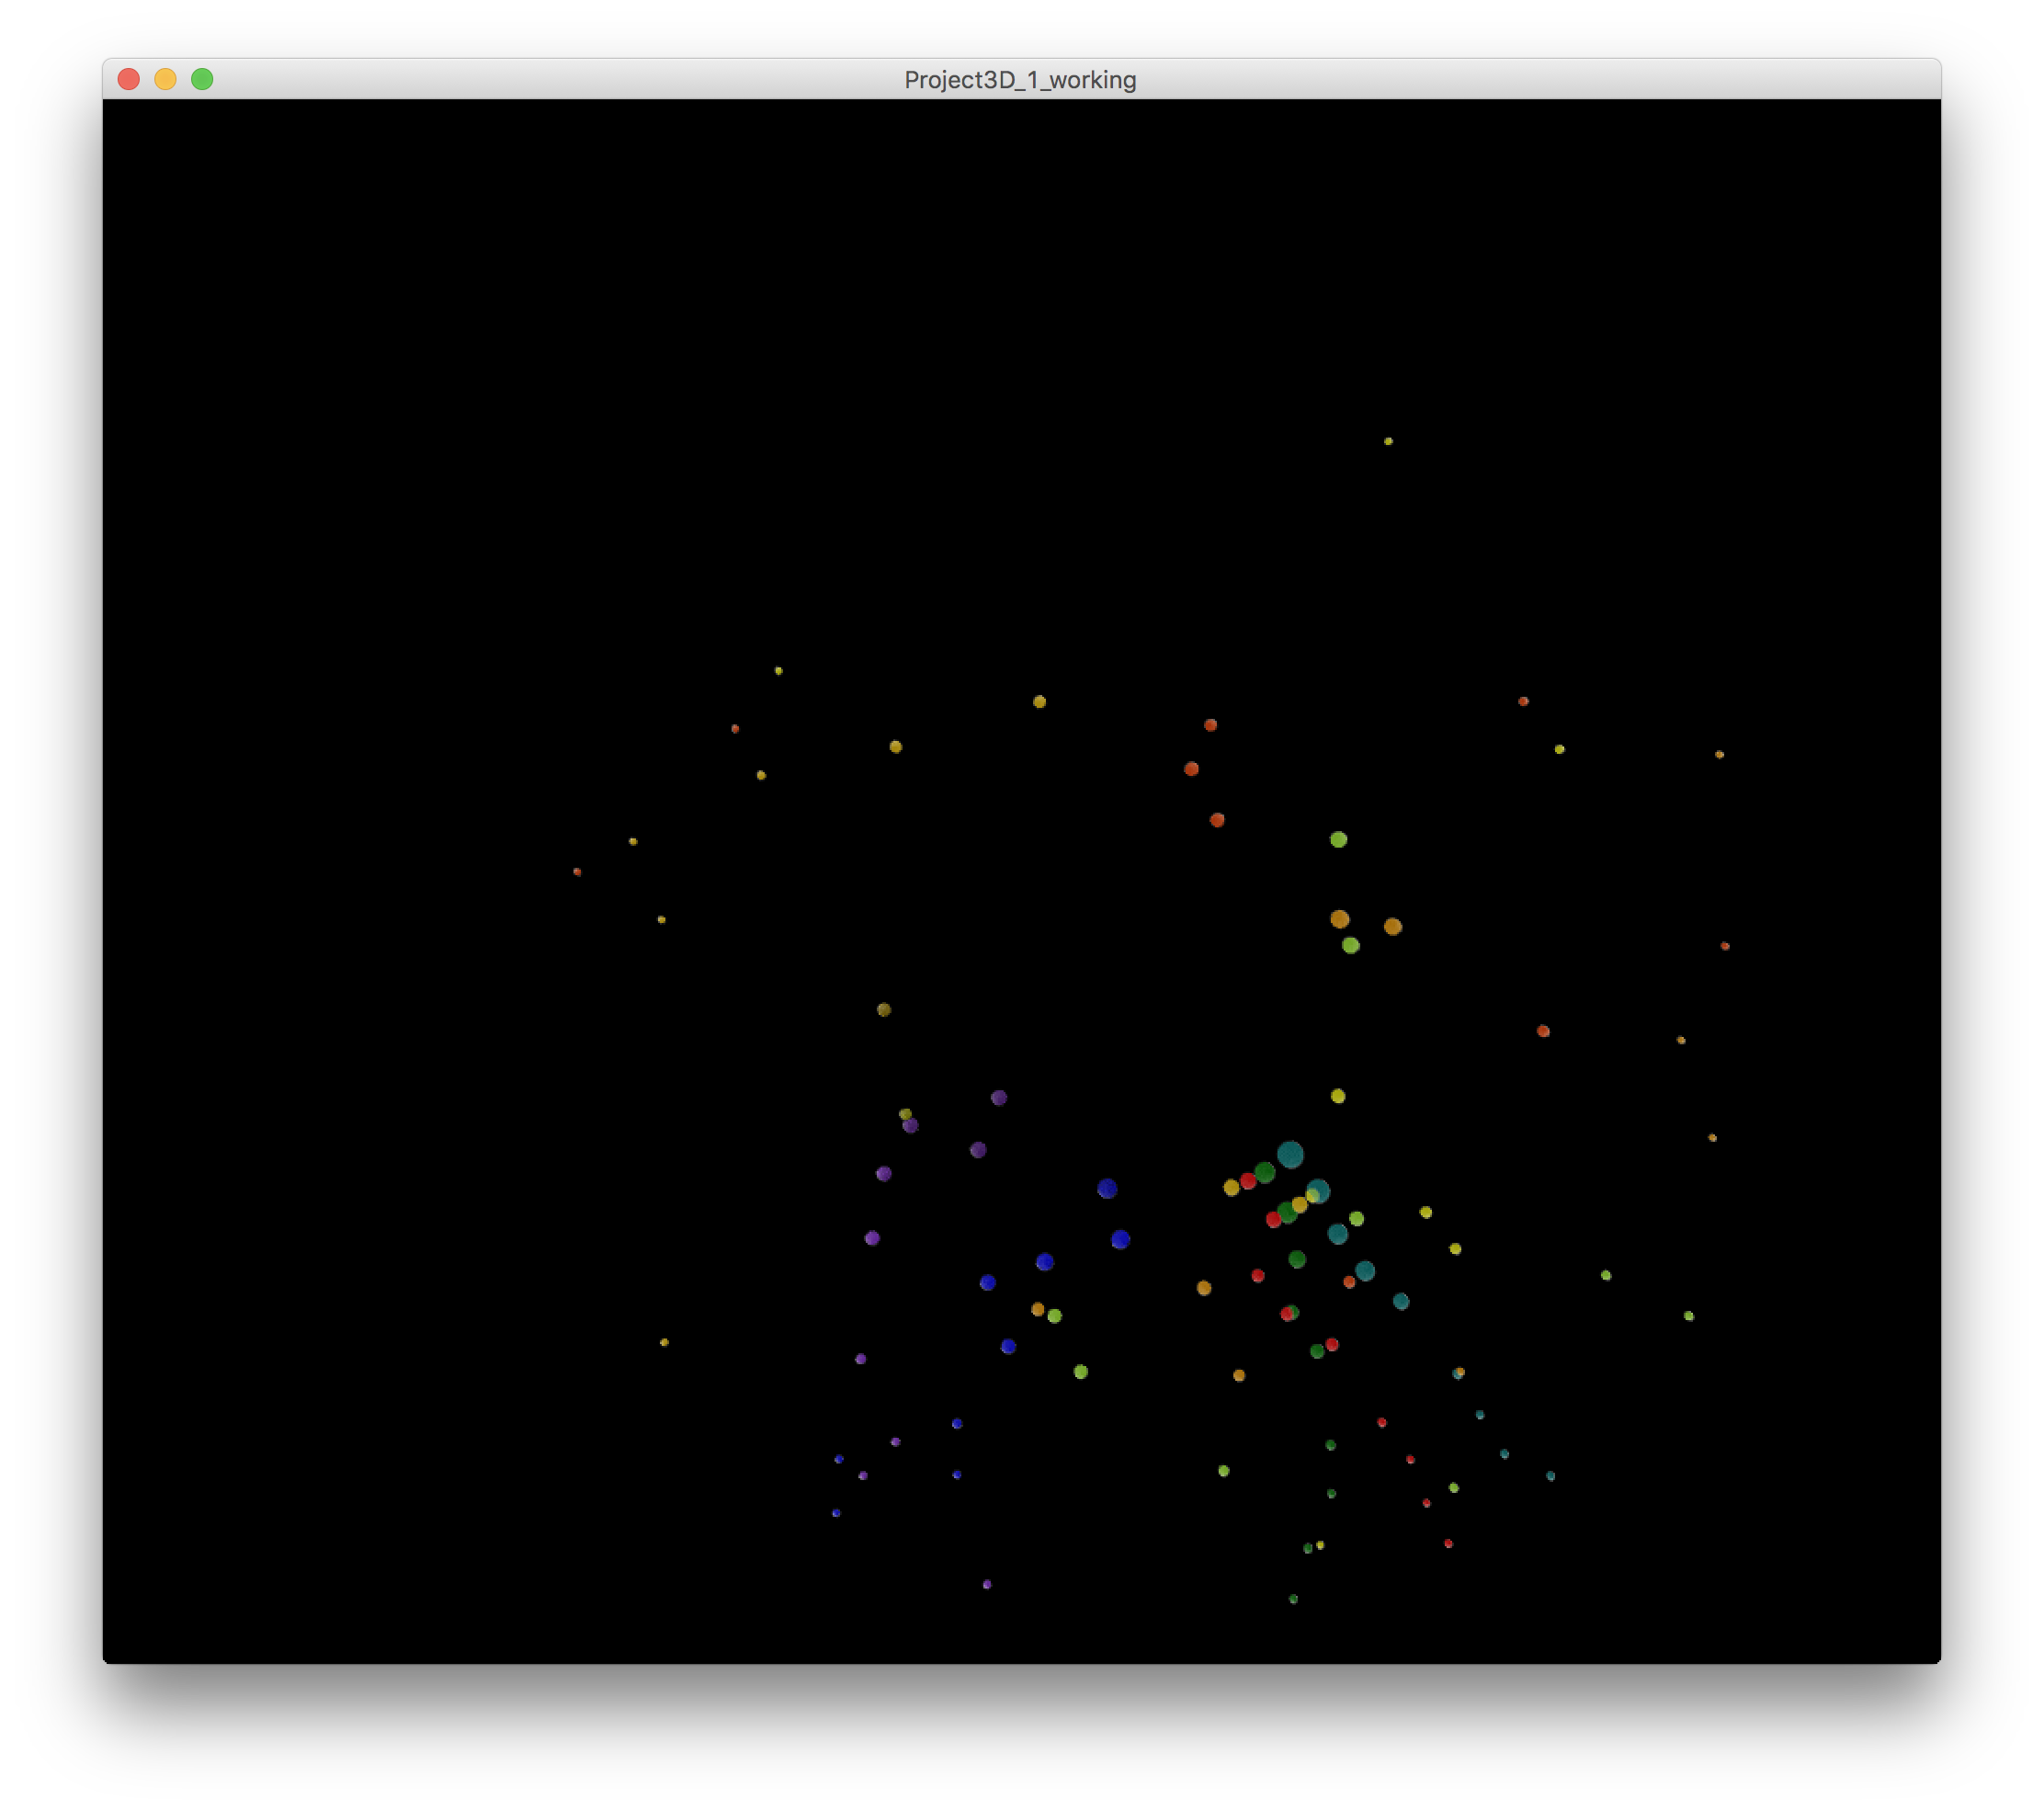
The second image adapts the qualities I was missing in the first image.
This first image does not have any orbits, which makes it confusing what track each sphere is on. Also, although it is distinct and clear that each year is a seperate color, the colors are not very visually nice to look at.
The second image adapts the qualities I was missing in the first image.
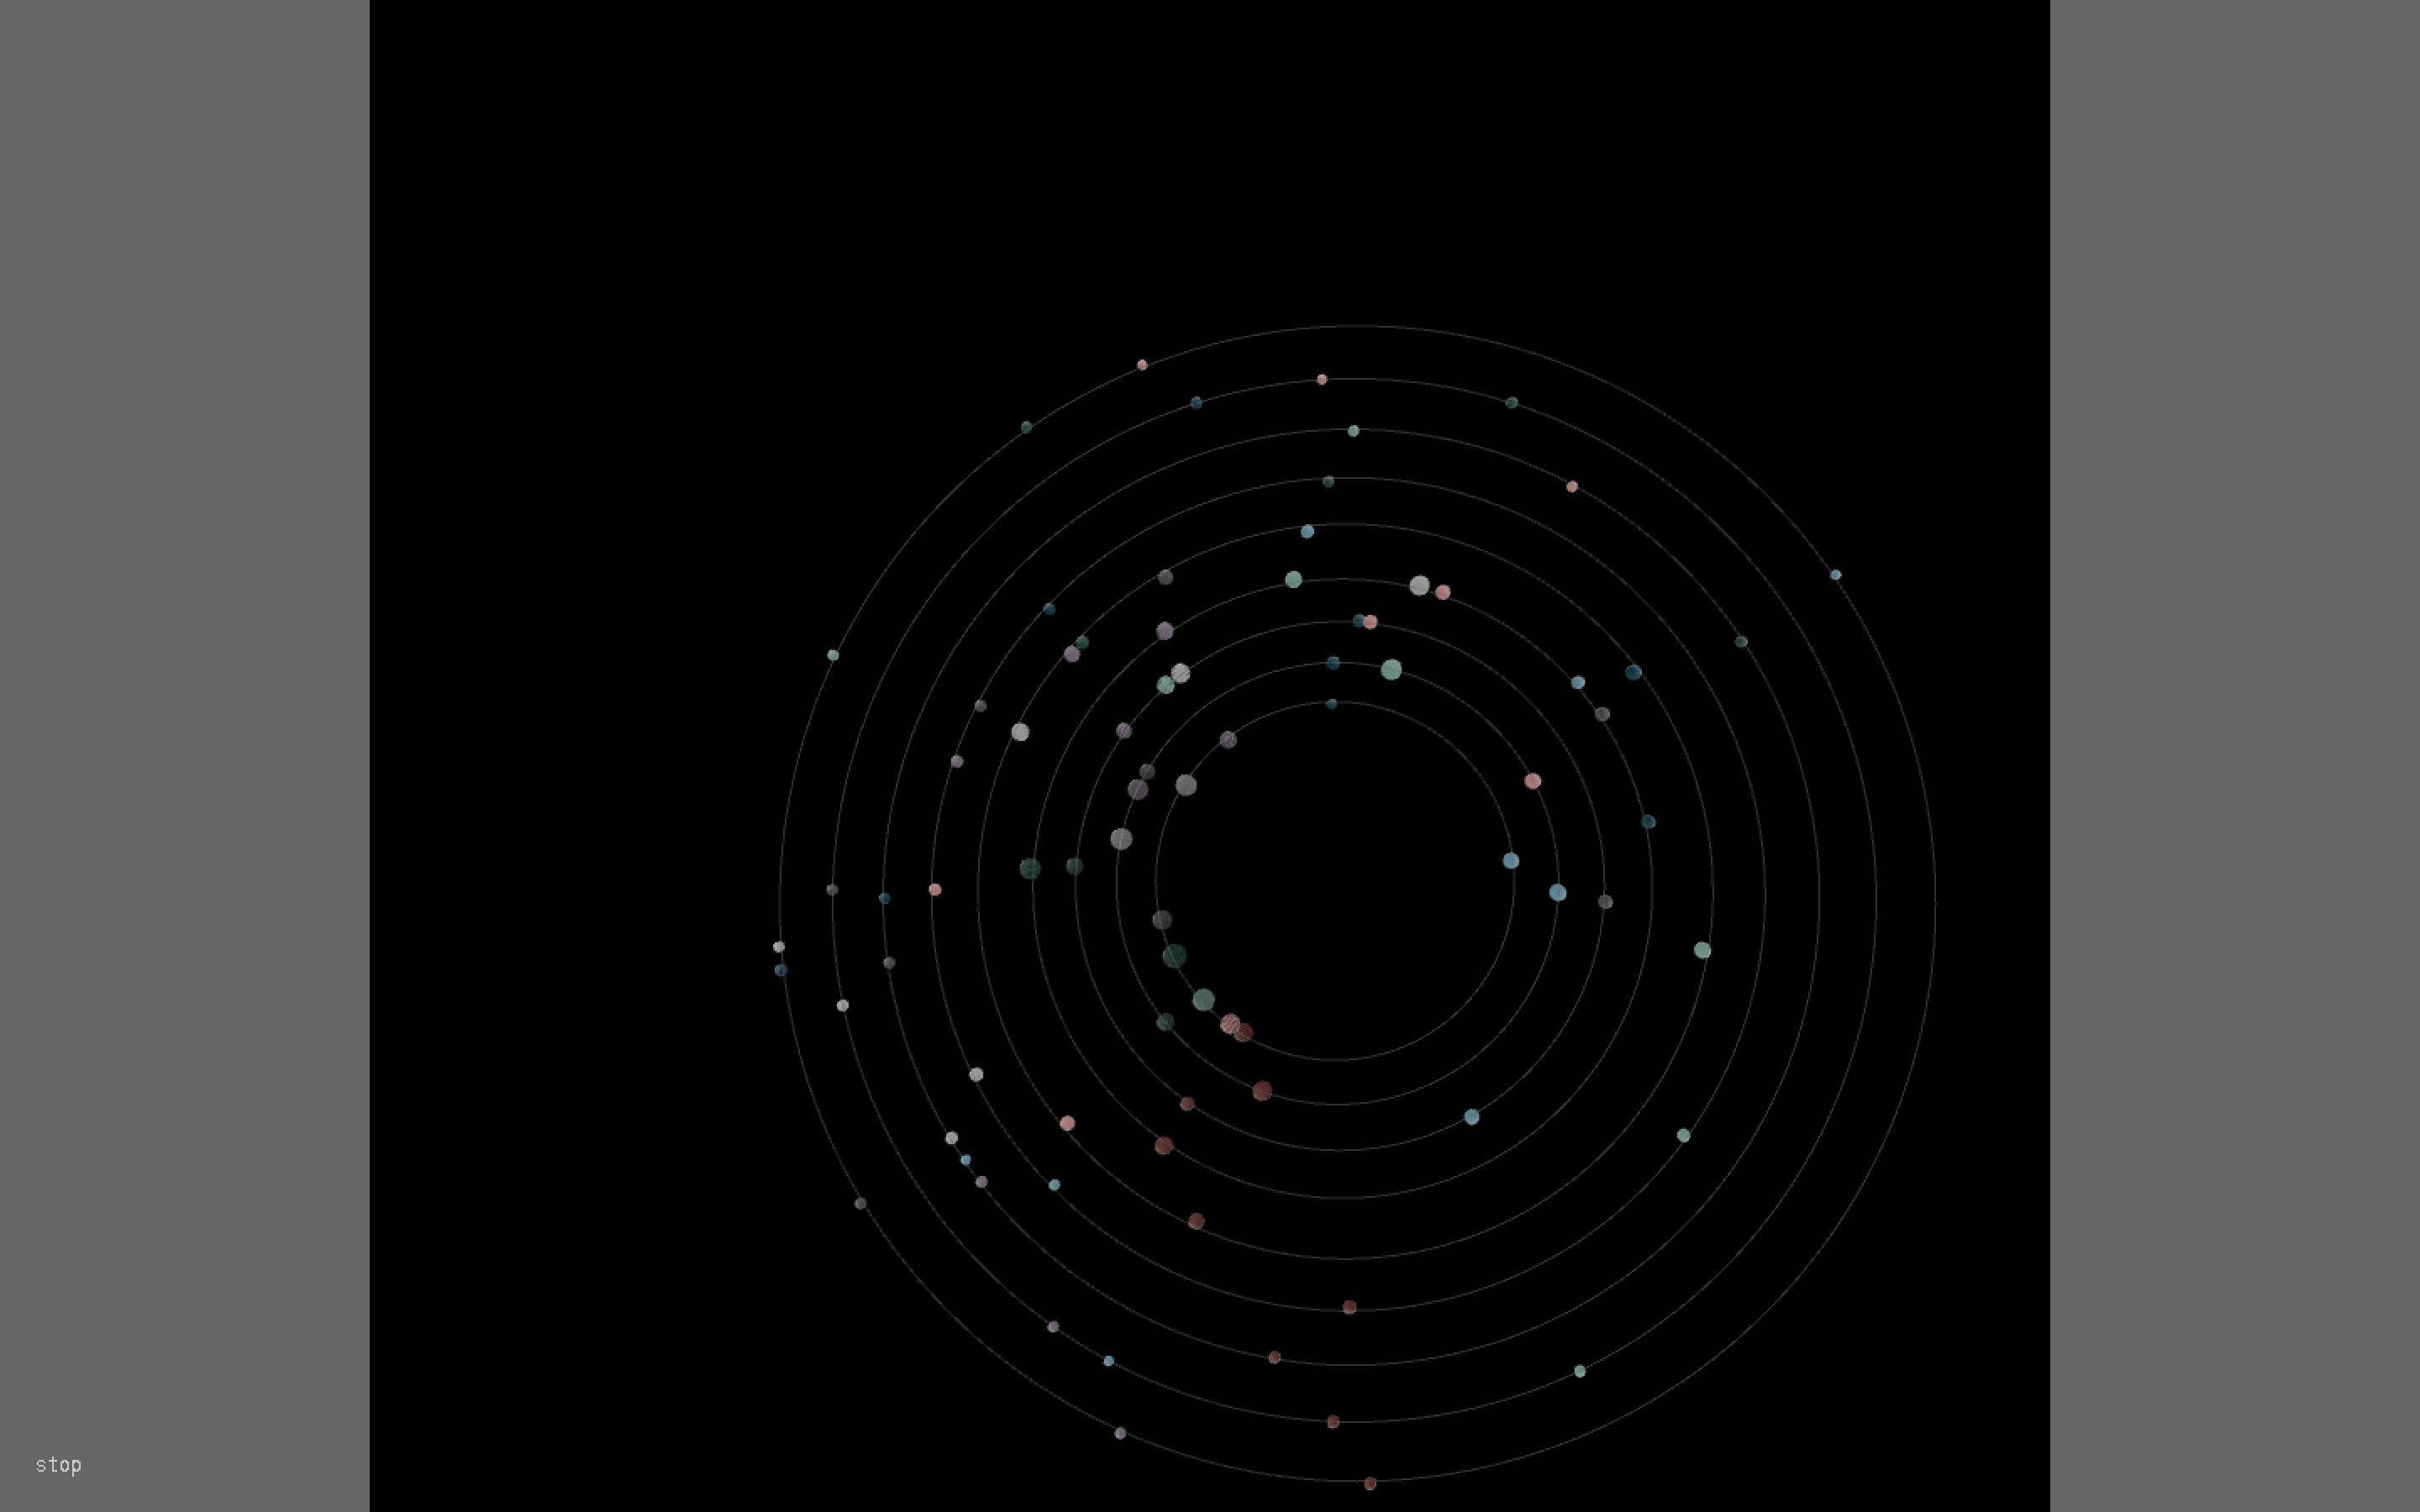
Final result
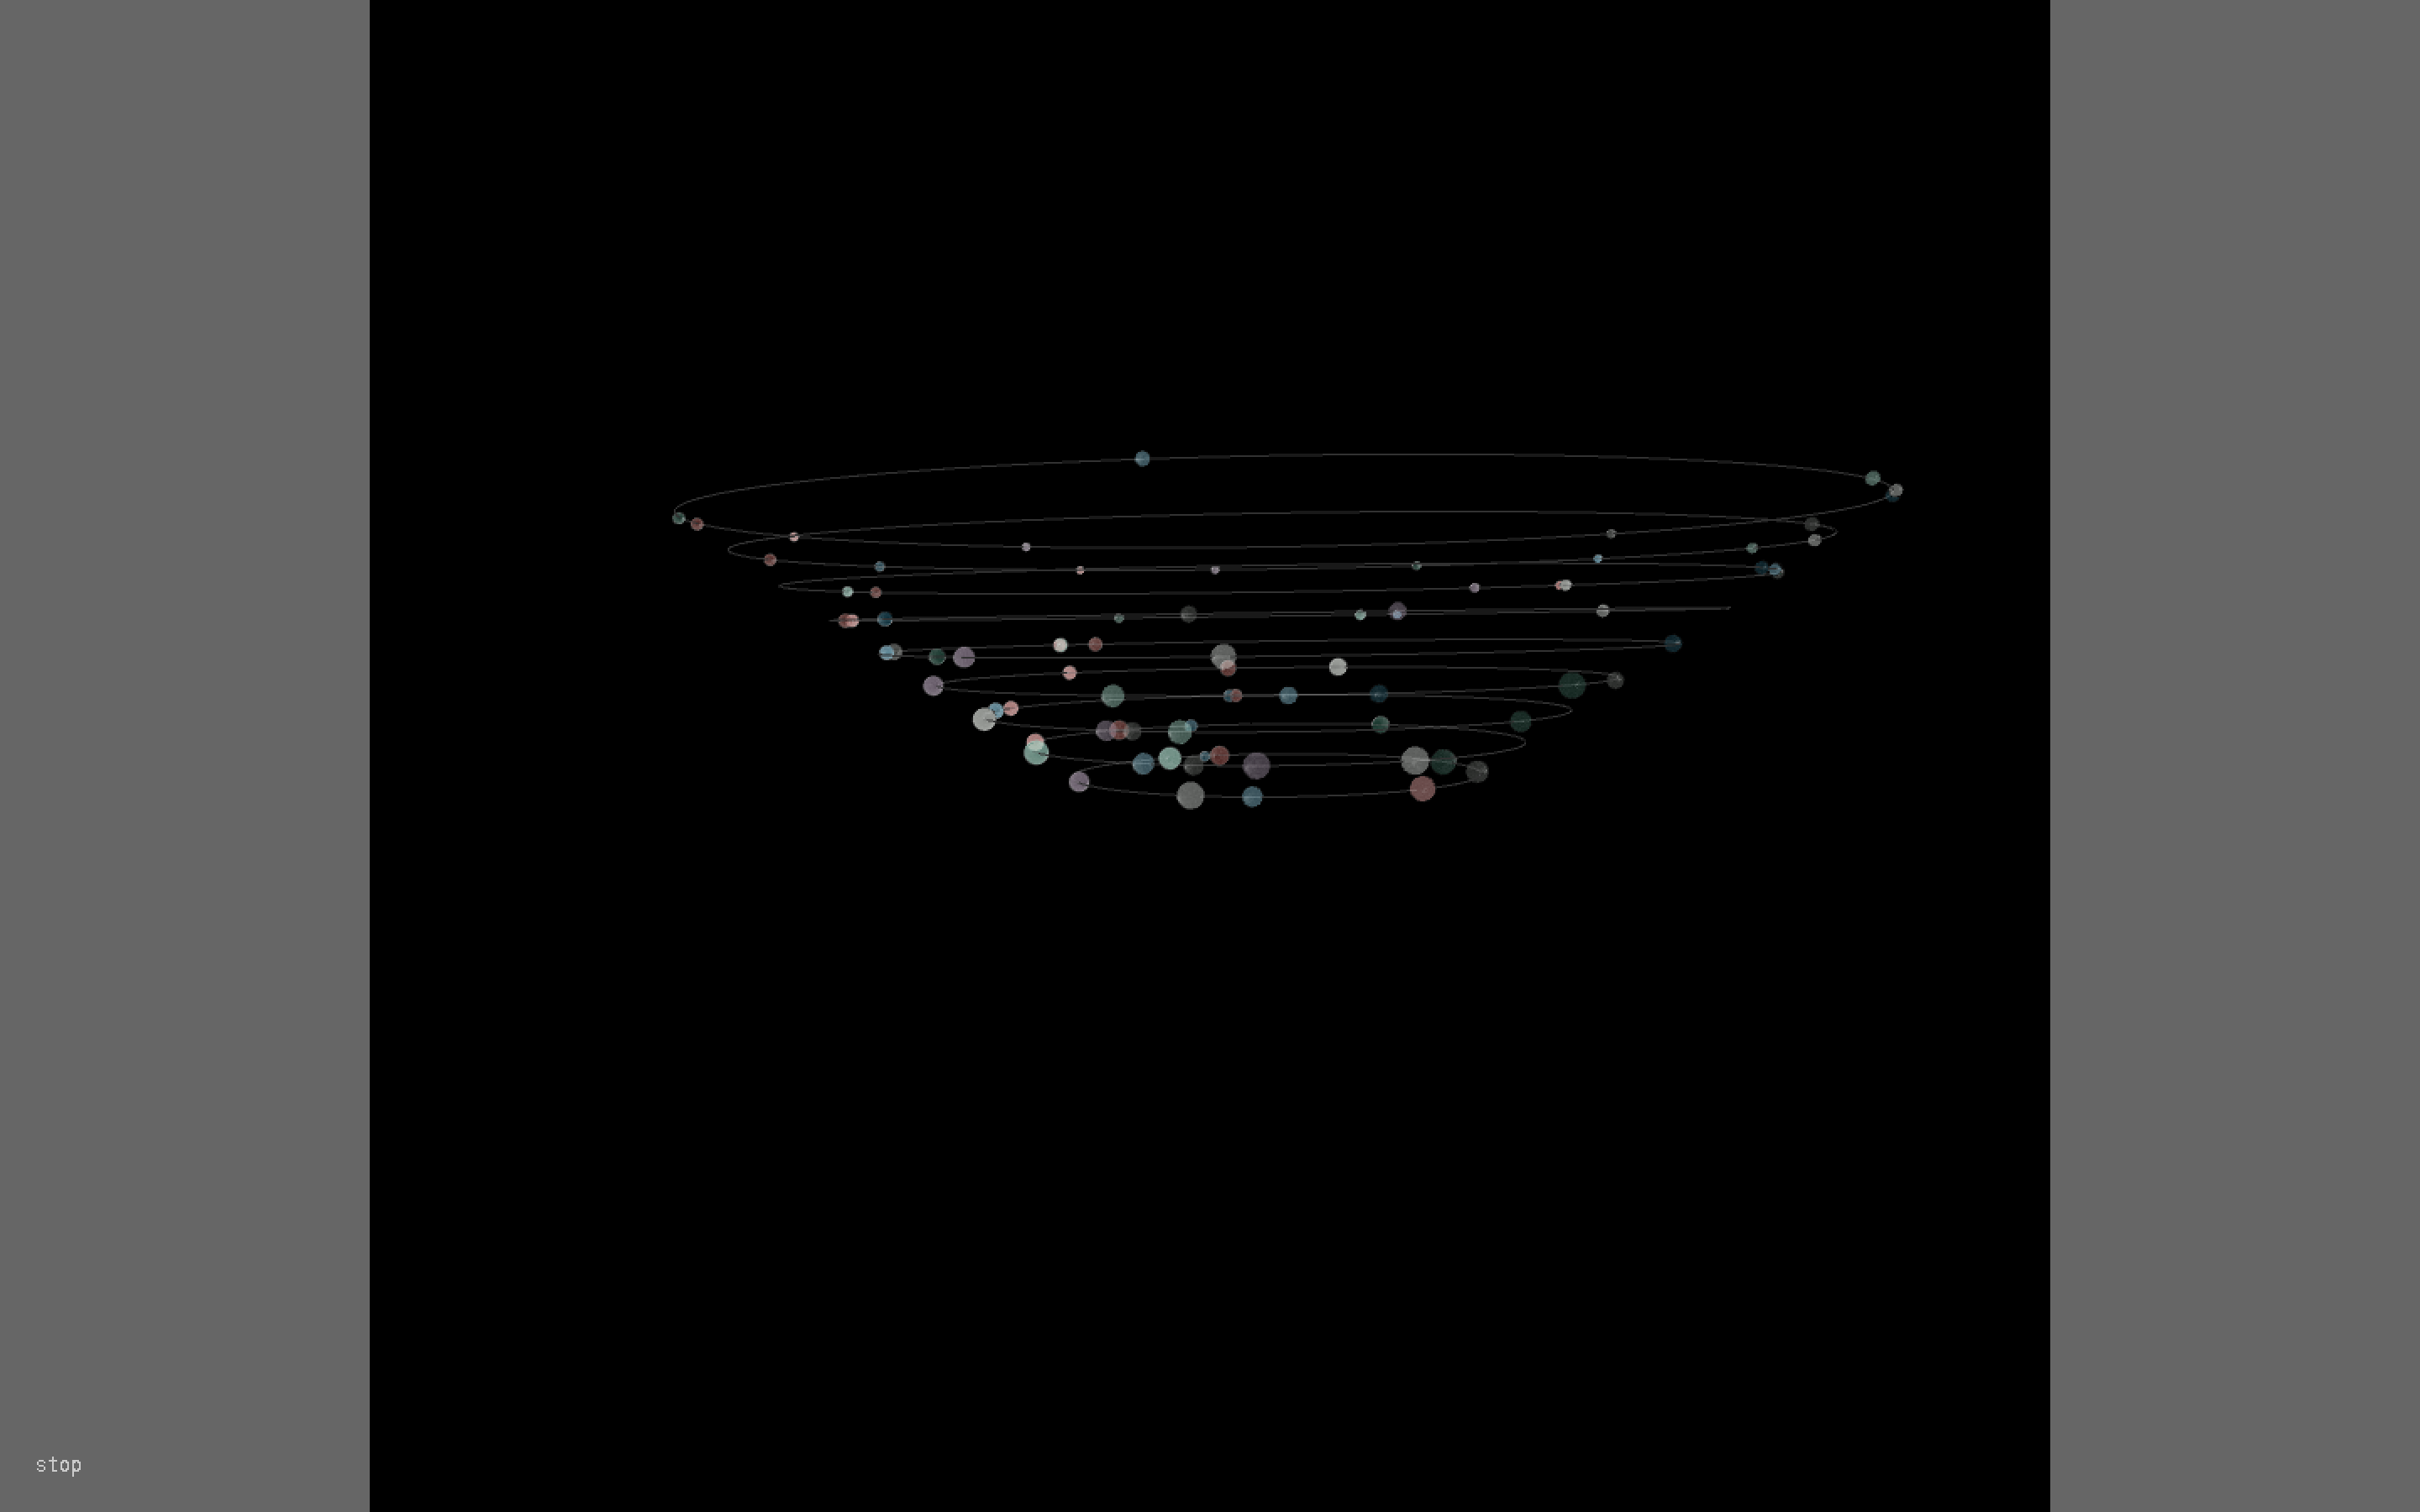
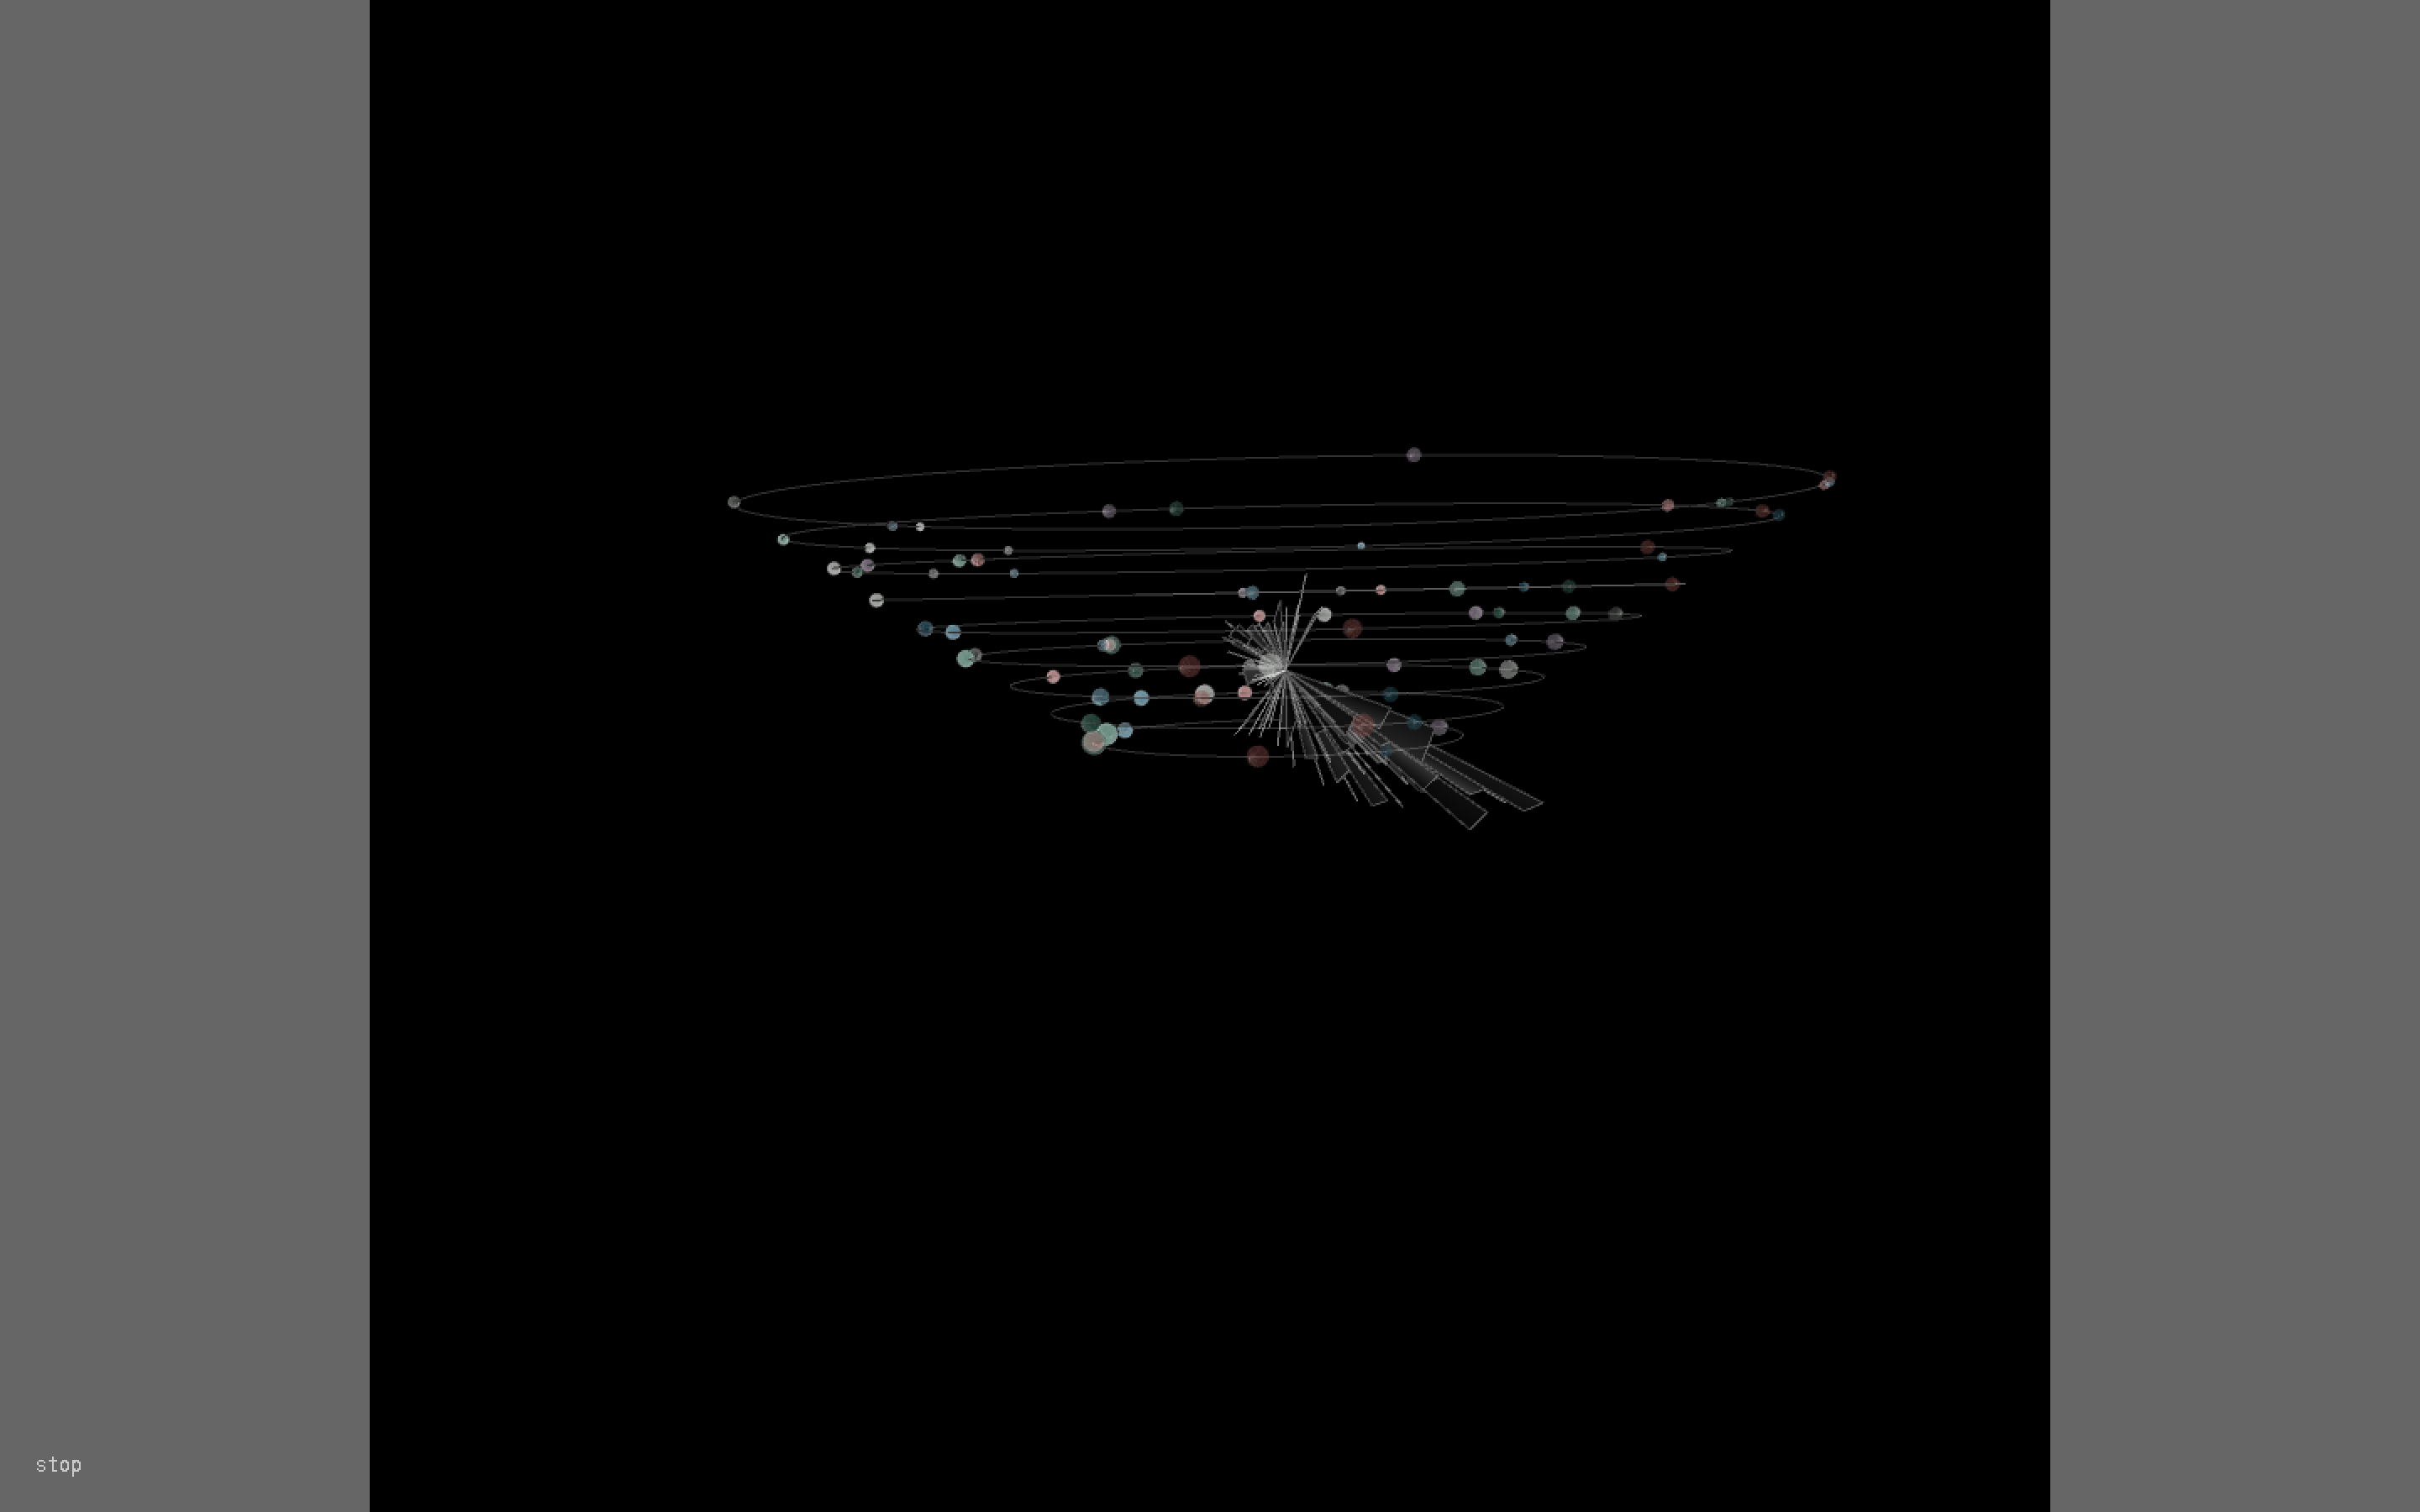
The design I decided to create a space metaphor, so the center is the first planet, Mercury, and each ring is the following planet all the way to Pluto being the last outer ring. The spheres rotating around each ring represent each year, so each ring as 10 spheres on it. The spheres are different sizes determined by the average duration each item was checked out and the rotation is determined by the amount of times they were checked out. The longer duration the bigger the radius and more times it is checked out the faster it will rotate. The years are being represented in sequential order by the colors: grey, pink, green, blue, purple, dark grey, red, dark green, dark blue, and black. I also added shapes in the center one for each planet. I am using a PShape were vectors are being made in the x,y,z axis representing month, year, amount checked out.
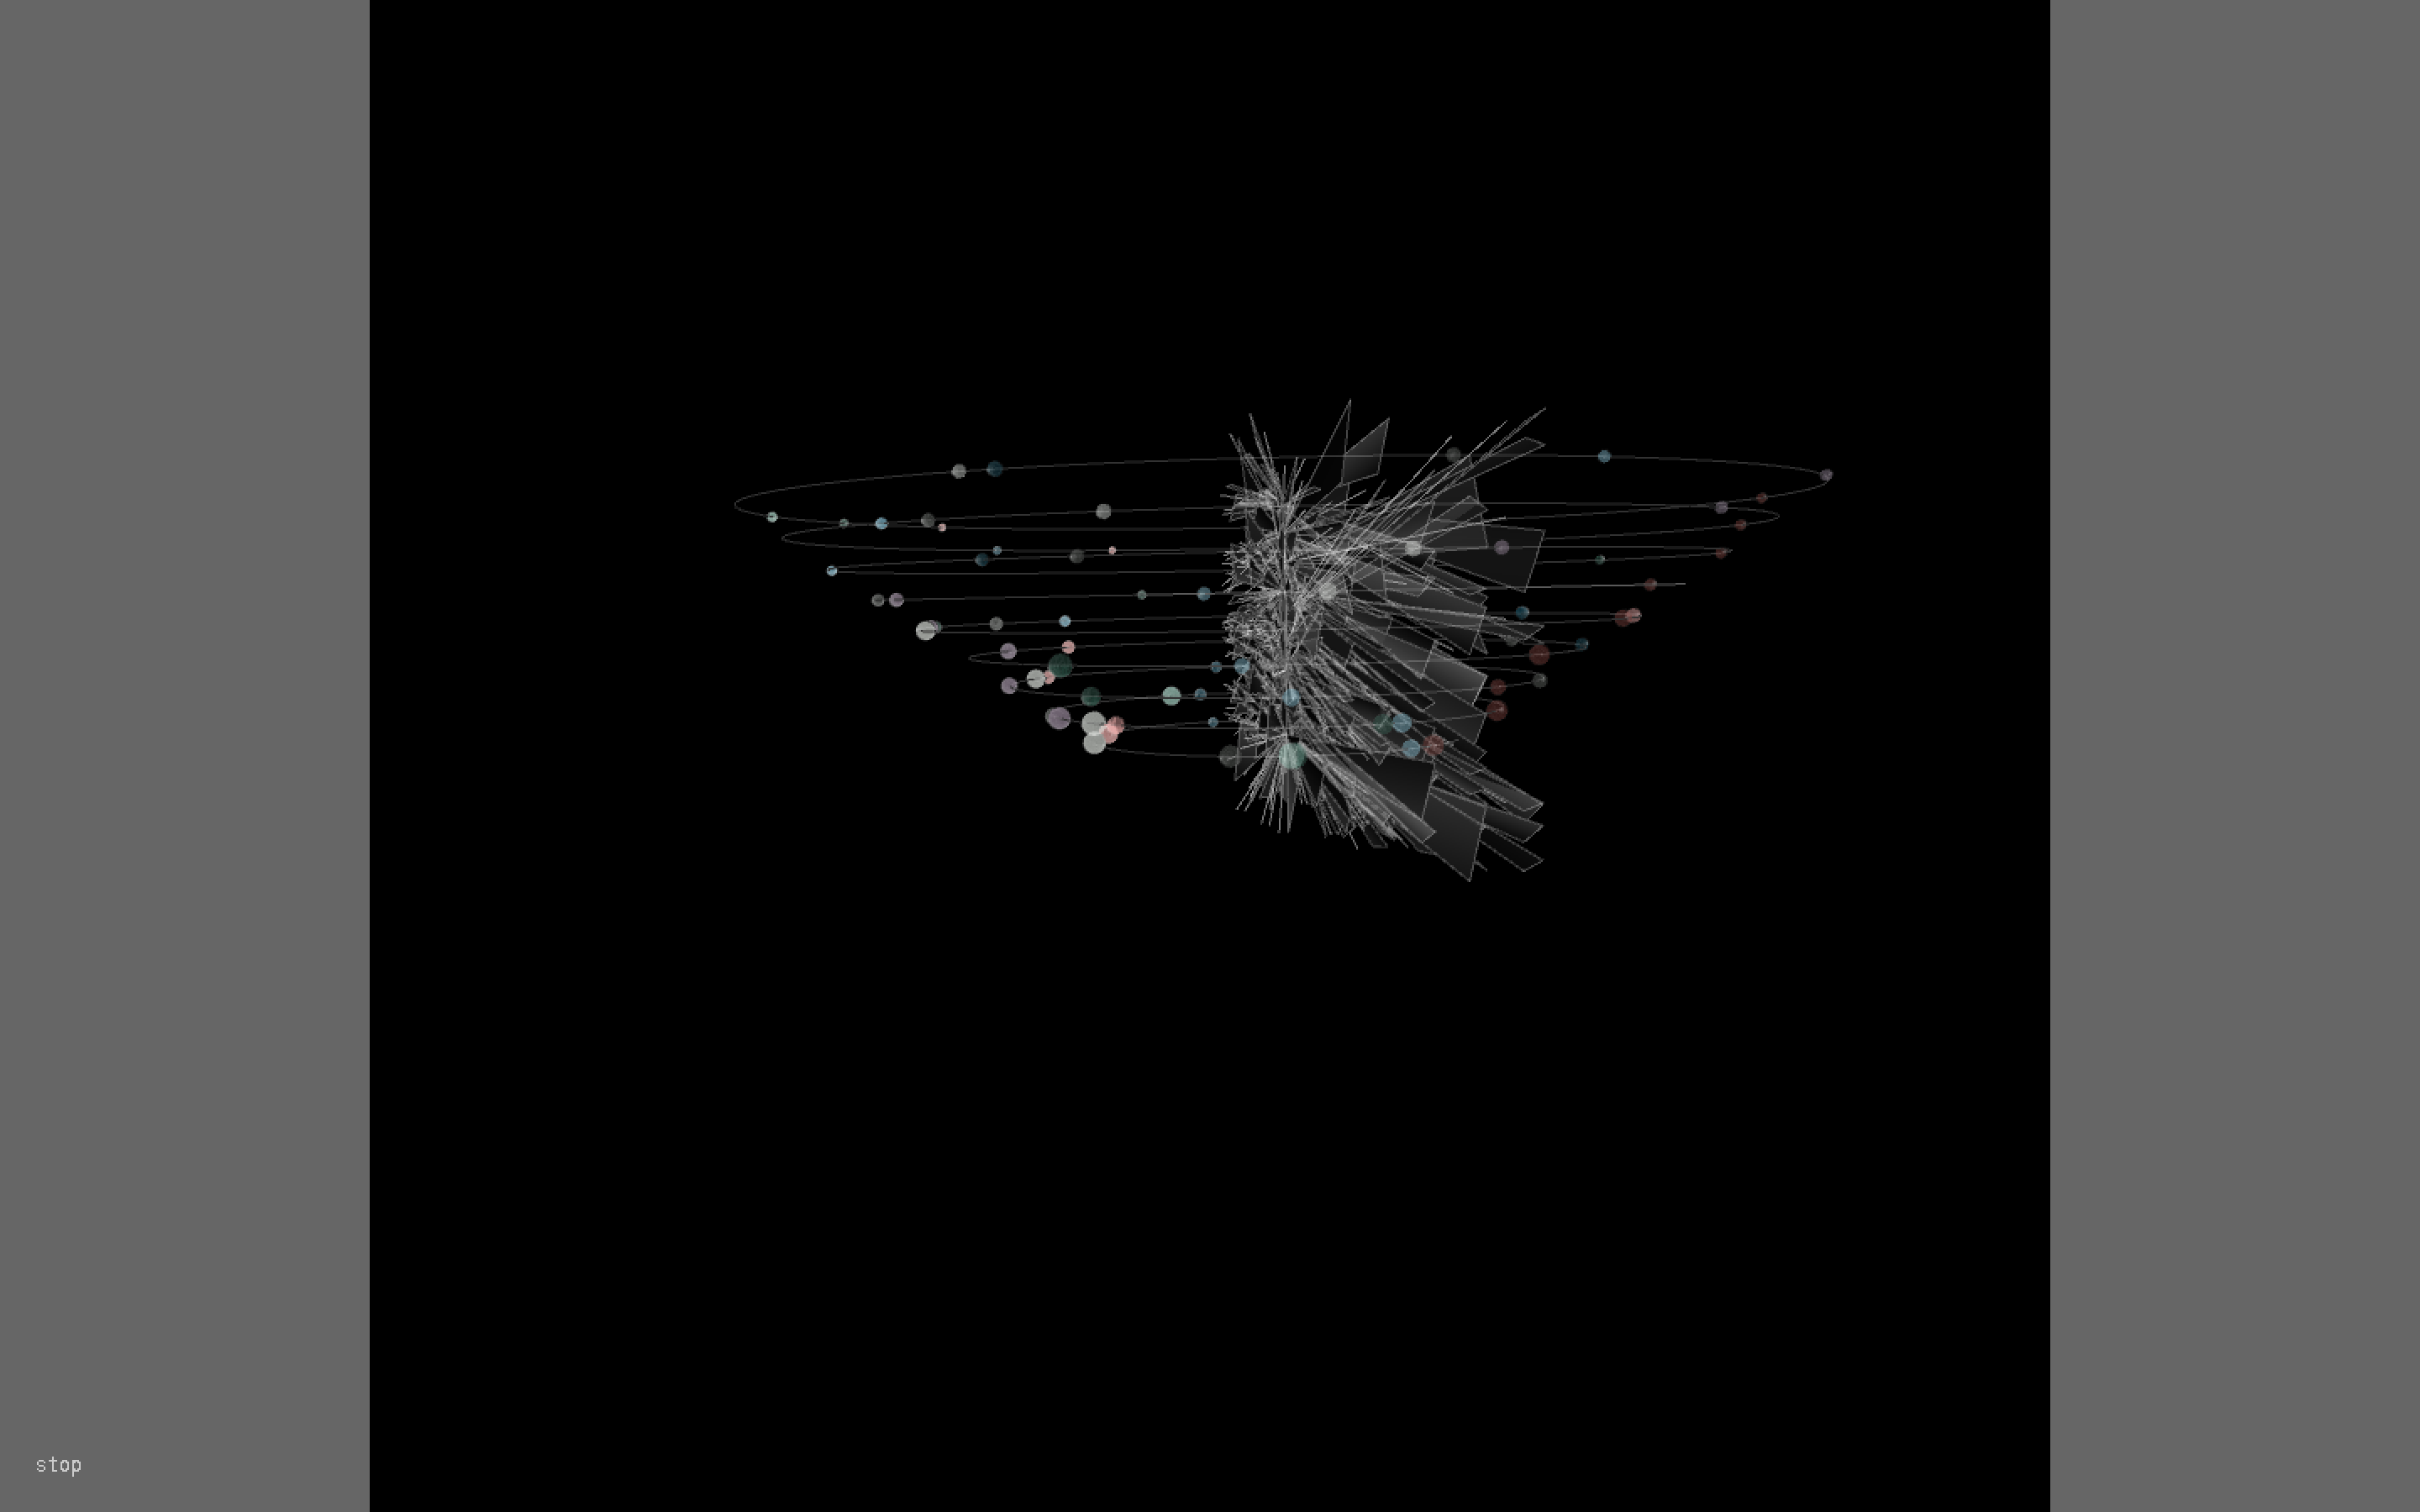
This image is similar to the previous image, but instead this shows the side view. The previous image when positioned on its side was just flat, instead of the planet's ellipses being stacked on top of each other. This angle gives a better visualization to see the data being described.
I am planning on adding labels and different buttons to filter through each mode, but have been really struggling on positioning it and stopping it from rotating. Currently, I have the keys 1 to 9 being able to filter through which year you want to show for each planet. Also you can click the letters, m(mercury, v(venus), e(earth), r(mars), j(jupiter), s(saturn), u(uranus), n(neptune), p(pluto), and 'a' for all of them.
Evaluation/Analysis
When creating the different PShape's for each planet I first began by mapping all the values compared to the other planet, but the values of Earth were to overpowering, so I had to map each planet separately. This then created all similar shapes, which I thought was interesting showing that the amounts checked out compared to each planet is all very relative to the other planets. The speed for the the spheres is more dramatic in Earth and Pluto. Pluto was no longer called a planet in 2006, but it became more popular to checkout items with pluto in the title in 2009, which is interesting. The only significant thing I could find about Pluto in 2009 was that it was one of four object recognized as plutoids.
Code