TOWER OF BABEL: Programming Language Popularity by Proxy
MAT 259, 2017
Sara Lafia
Concept
This exploratory visualization shows the relationship between book checkouts over time and their relative popularities. The assumption is that an increasing number of books checked out, pertaining to each programming language, translates to an increasing popularity of the programming language. This visualization offers insight into cultural shifts given the choices of programming languages that Seattle residents are choosing to teach themselves in the midst of a technology boom over the last decade. The three variables exposed in this visualization are time, programming language, and share of book checkouts.
Query
SELECT
MONTH(t.checkOut) AS monthOut,
YEAR(t.checkOut) AS yearOut,
SUM(i.title LIKE '%java%') AS Java,
SUM(i.title LIKE '%python%') AS Python,
SUM(i.title LIKE '%php%') AS PHP,
SUM(i.title LIKE '%javascript%') AS JavaScript,
SUM(i.title LIKE '%perl%') AS Perl,
SUM(i.title LIKE '%ruby%') AS Ruby,
SUM((i.title LIKE '%java%') + (i.title LIKE '%python%') + (i.title LIKE '%php%') + (i.title LIKE '%javascript%') + (i.title LIKE '%perl%') + (i.title LIKE '%ruby%')) AS totalPYPL,
SUM(d.deweyClass = 005) AS monthly005Total
FROM
(spl_2016.transactions AS t
INNER JOIN spl_2016.title AS i ON t.bibNumber = i.bibNumber)
INNER JOIN
spl_2016.deweyClass AS d ON (t.bibNumber = d.bibNumber)
WHERE
(d.deweyClass = 005)
AND (YEAR(t.checkOut) BETWEEN 2006 AND 2016)
GROUP BY yearOut , monthOut
ORDER BY yearOut , monthOut
The processing time was 4.001 seconds for this query.
The processing time was 4.001 seconds for this query.
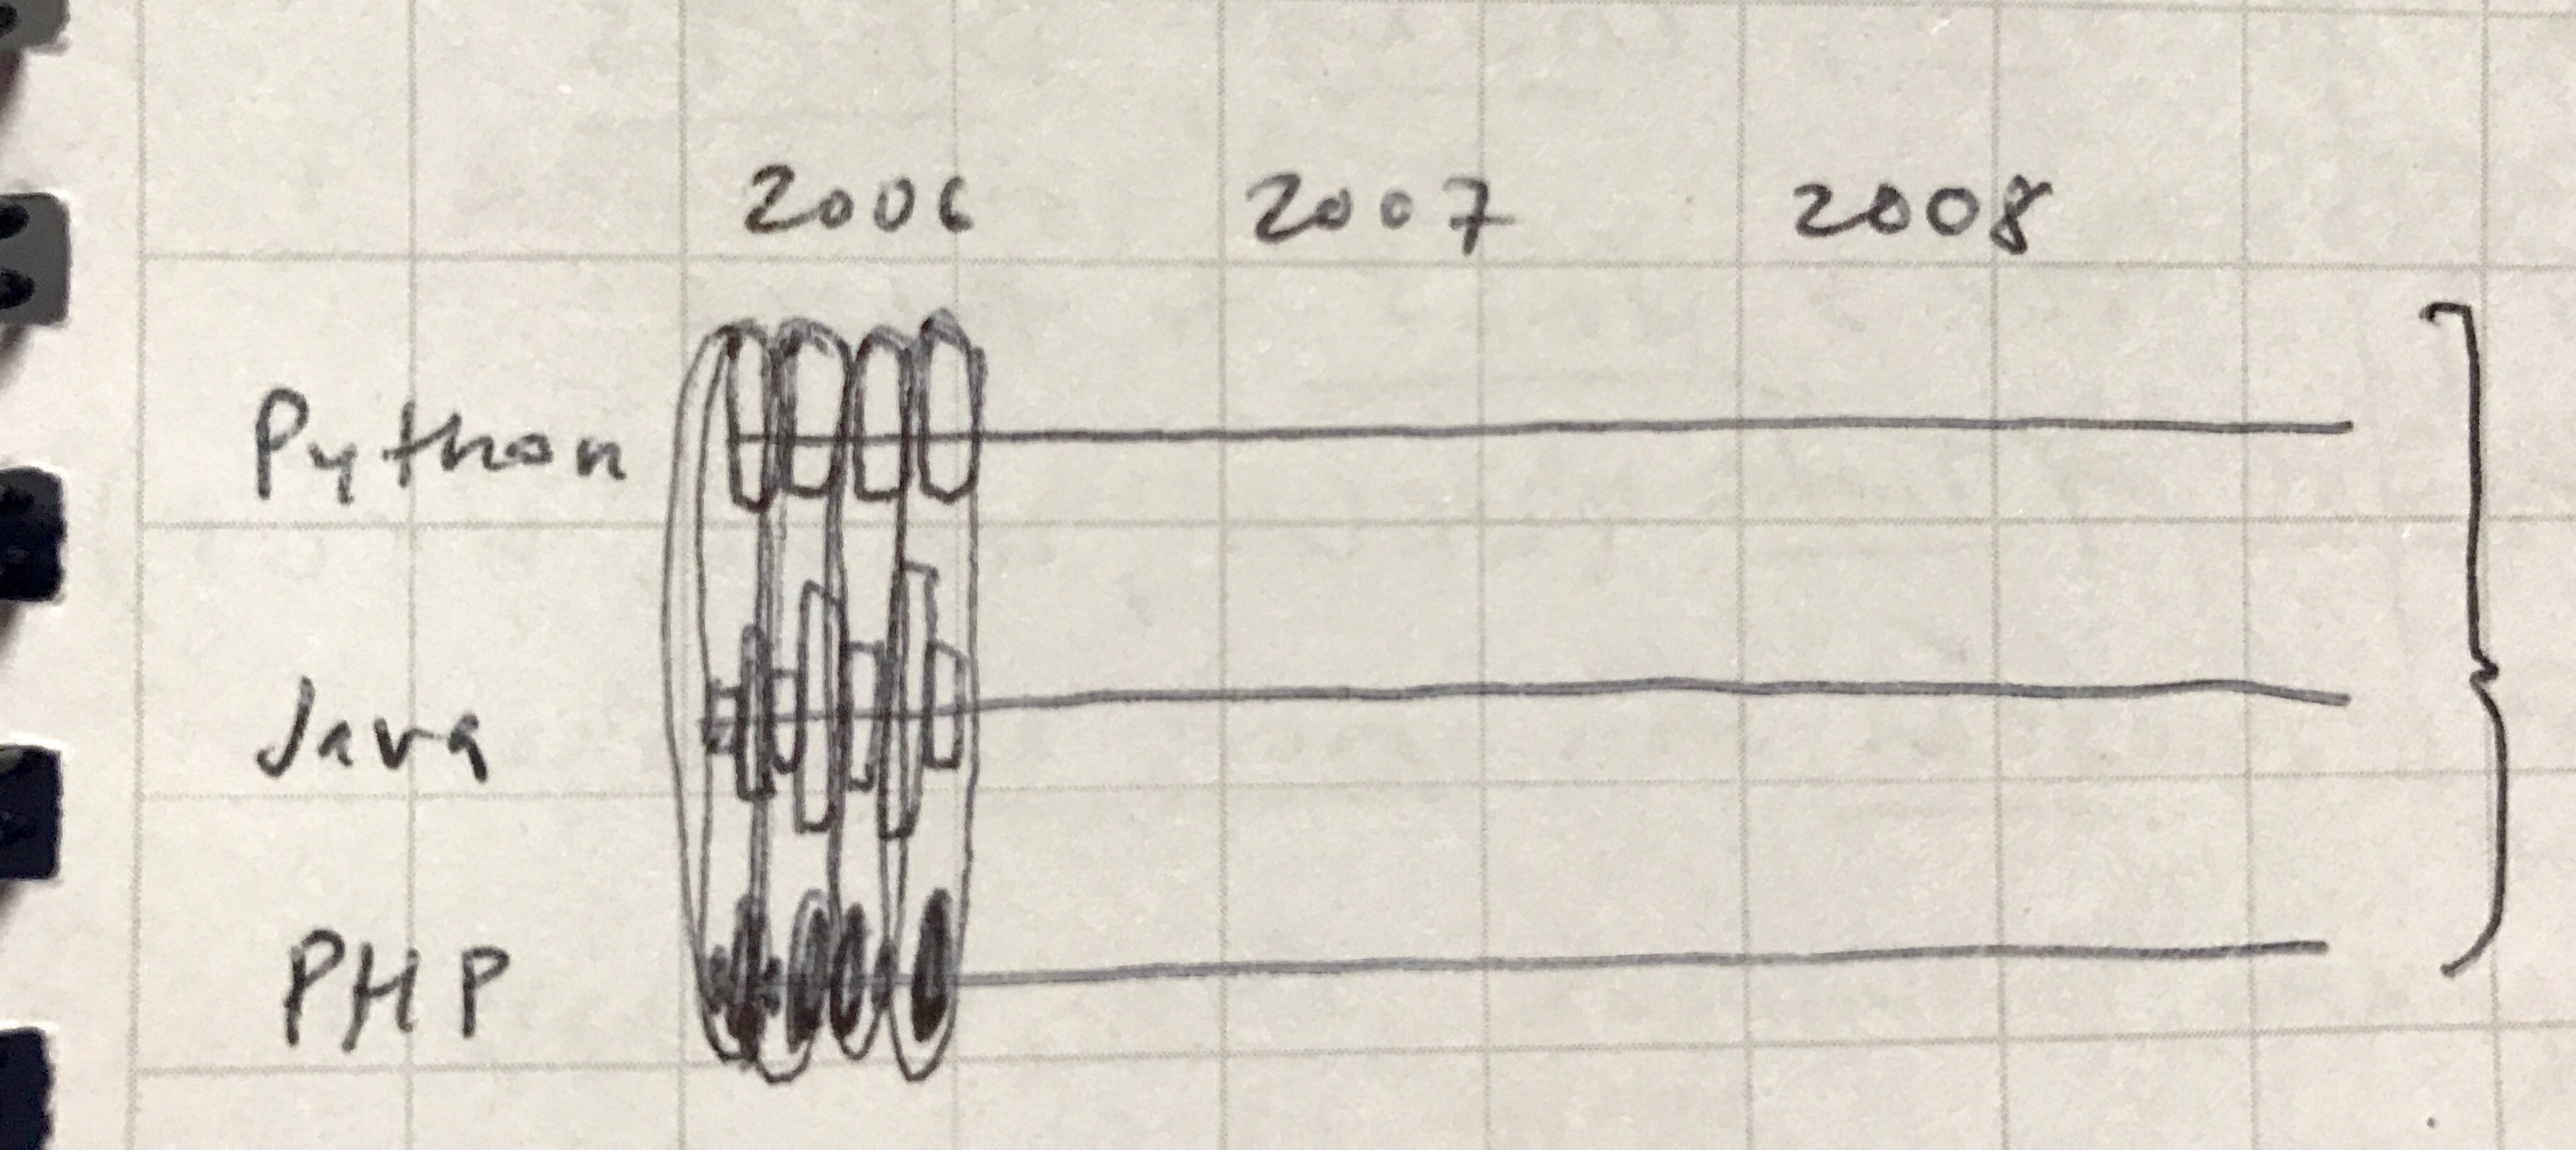
Preliminary sketches
The concept is to first discretize the reference books by keyword title match and aggregate them. This provides a month-to-month view of change over a decade, based on number of checkouts.
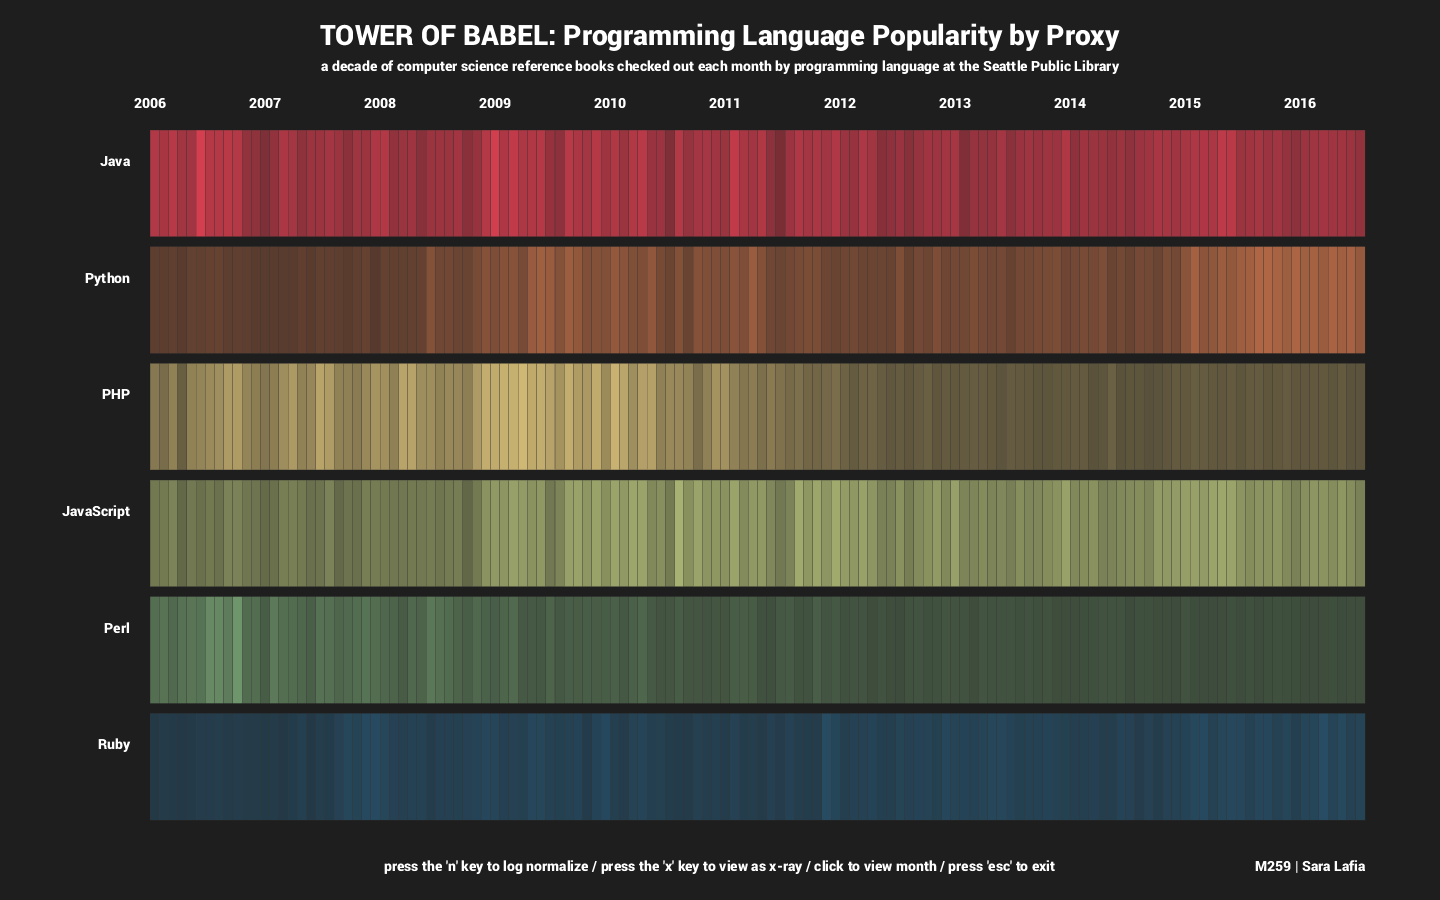
Final result
The final result is a simple frame where the hue of each brick in the language tower is saturated based on its checkout frequency. The resolution of the bricks is monthly, which is appropriate for tracking rise and fall over time, relative to the maximum number of checkouts for each language.
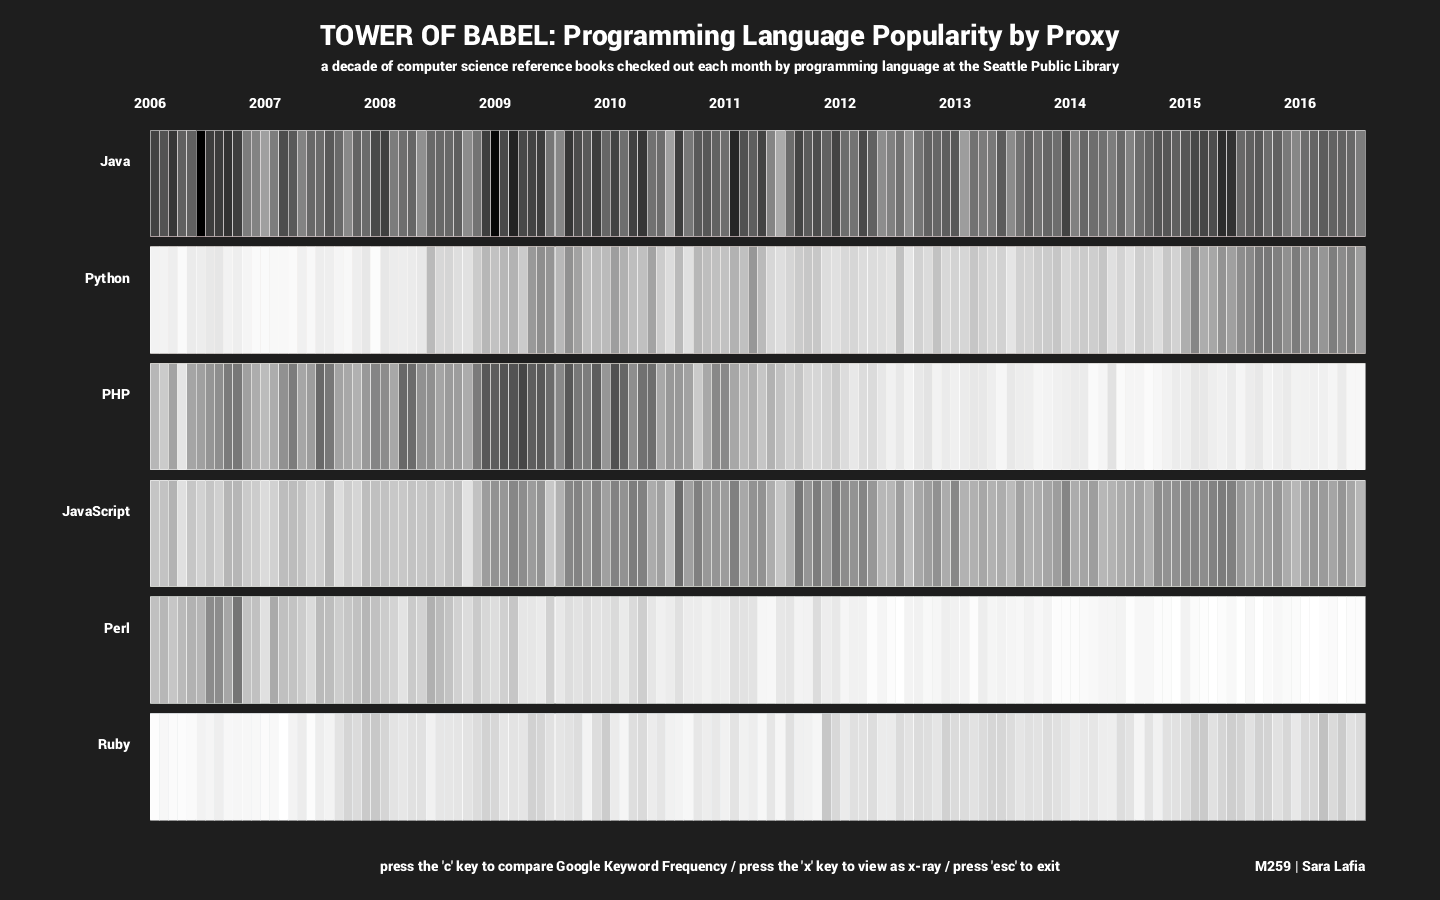
Pressing the 'x' key in the visualzation shifts the color scheme to grayscale, allowing a see-through view. It is more apparent from this rendition that Java was the consistantly dominant language over time, whereas languages such as Ruby were relatively unpopular for much of the decade.
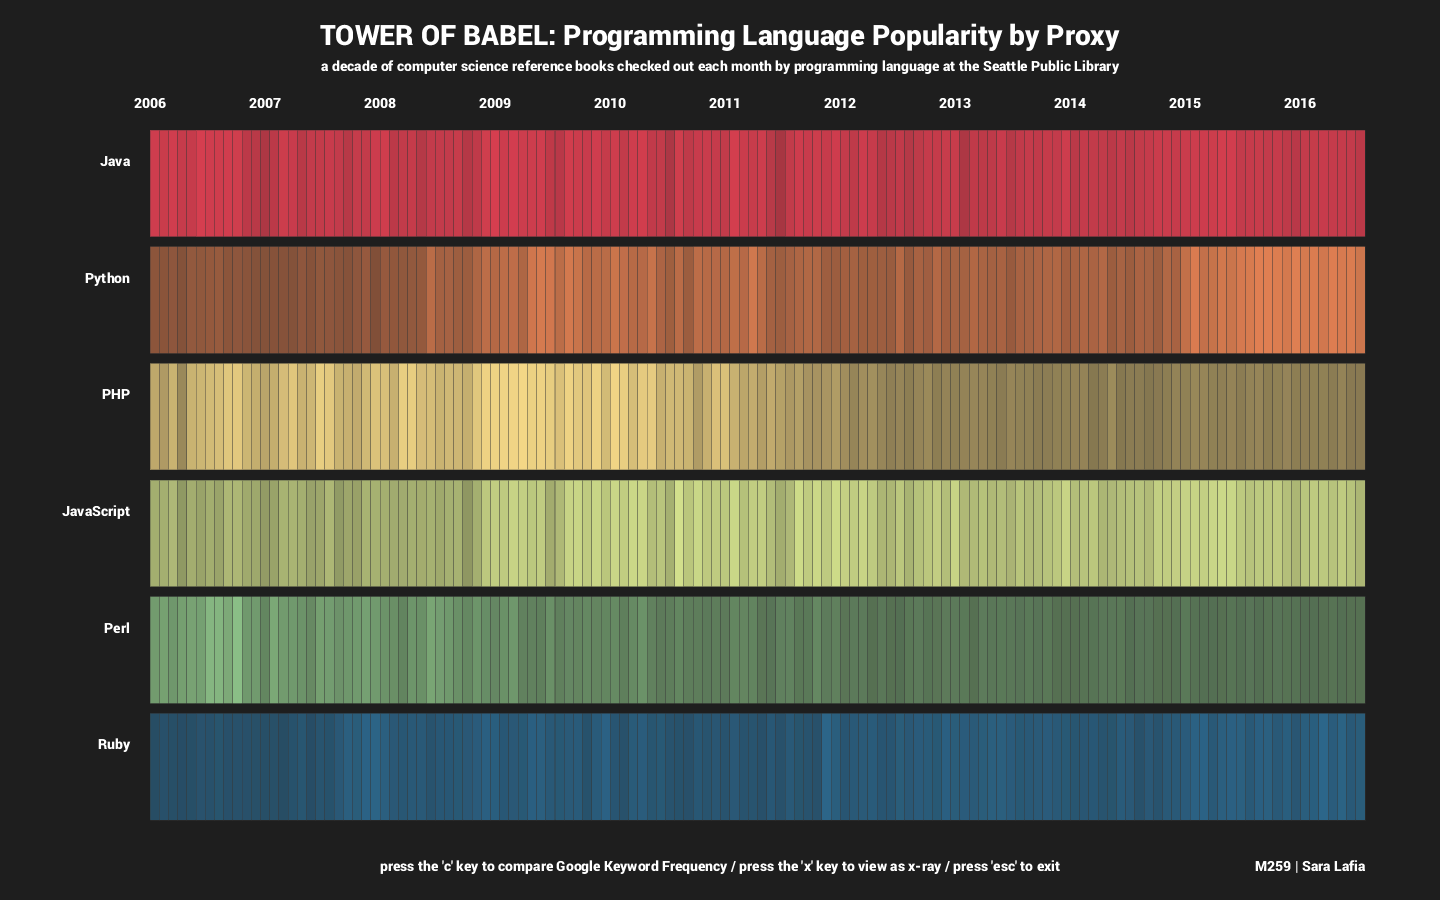
Finally, pressing the 'c' key in the visualzation log-normalizes the saturation of the bricks, and shows the number of checkouts relative to the total number across programming language categories rather than within each category. This allows for cross-language comparison.
Pressing the 'x' key in the visualzation shifts the color scheme to grayscale, allowing a see-through view. It is more apparent from this rendition that Java was the consistantly dominant language over time, whereas languages such as Ruby were relatively unpopular for much of the decade.
Finally, pressing the 'c' key in the visualzation log-normalizes the saturation of the bricks, and shows the number of checkouts relative to the total number across programming language categories rather than within each category. This allows for cross-language comparison.
Evaluation/Analysis
The brighter the brick in the tower of each language, the greater its share of checkouts. Thus, we see the rise and fall of each tower; brighter sections indicate periods of stronger popularity, while darker periods indicate declining popularity. This translates roughly to the chronological trends approximated by Google in their keyword search frequency of each programming language over the same decade, which will be explored in a subsequent analysis. It's important to note that the checkout frequency is a raw total and is not based on the total number of computer science reference books held by the library. This value is unknown. Subsequent analysis should also investigate the prevalence of other popular programming languages, such as C++.
Code