Technology versus the Library
MAT 259, 2016
Ariella Gilmore
Concept
Professor Legrady started this project around 2005, so now being over a decade later I thought it would be interesting to see how technology might have effected people's library usage. Over the past decade ebooks have become very popular and downloading virtually anything from books to movies to songs onto your phone, computuer, or tablet instaneously I thought would create a drastic significance on library checkouts.
Query
I created my query by seperating each dewey class by 100 and counting the amount of checkouts from each dewey class from 2005 to 2016. I also wanted to look at the amount of checkoutus of the media types seperating them between CD's, DVD's, and book's. I have each year seperated into months because it was able to show more information of the increasing and decreasing of checkouts of each dewey class and media type.
SELECT
year(cout),
COUNT(CASE WHEN deweyClass >= 000 AND deweyClass<100 THEN 1 END) as
Info,
COUNT(CASE WHEN deweyClass >= 100 AND deweyClass<200 THEN 1 END) as
Phil_Psych,
COUNT(CASE WHEN deweyClass >= 200 AND deweyClass<300 THEN 1 END) as
Religion,
COUNT(CASE WHEN deweyClass >= 300 AND deweyClass<400 THEN 1 END) as
SS,
COUNT(CASE WHEN deweyClass >= 400 AND deweyClass<500 THEN 1 END) as
Lang,
COUNT(CASE WHEN deweyClass >= 500 AND deweyClass<600 THEN 1 END) as
Science,
COUNT(CASE WHEN deweyClass >= 600 AND deweyClass<700 THEN 1 END) as
Tech,
COUNT(CASE WHEN deweyClass >= 700 AND deweyClass<800 THEN 1 END) as
Arts,
COUNT(CASE WHEN deweyClass >= 800 AND deweyClass<900 THEN 1 END) as
Lit,
COUNT(CASE WHEN deweyClass >= 900 AND deweyClass<1000 THEN 1 END) as
History,
SUM(CASE WHEN itemtype = 'accd' OR itemtype = 'arcd' OR itemtype = 'jccd'
OR itemtype = 'jrcd' THEN 1 ELSE 0 END) AS CD,
SUM(CASE WHEN itemtype = 'acdvd' OR itemtype = 'ardvd' OR itemtype = 'bcdvd'OR
itemtype = 'jcdvd' OR itemtype = 'jrdvd' THEN 1 ELSE 0 END) AS DVD,
SUM(CASE WHEN itemtype = 'acbk' OR itemtype = 'arbk ' OR itemtype = 'bcbk' OR
itemtype = 'drbk' OR itemtype = 'jcbk' OR itemtype = 'jrbk' OR itemtype = 'bccd'
THEN 1 ELSE 0 END) AS Book
FROM spl_2016.inraw
WHERE year(cout) >= "2005" and year(cout) < 2017
GROUP BY year(cout), month(cout)
ORDER BY year(cout);
Preliminary sketches
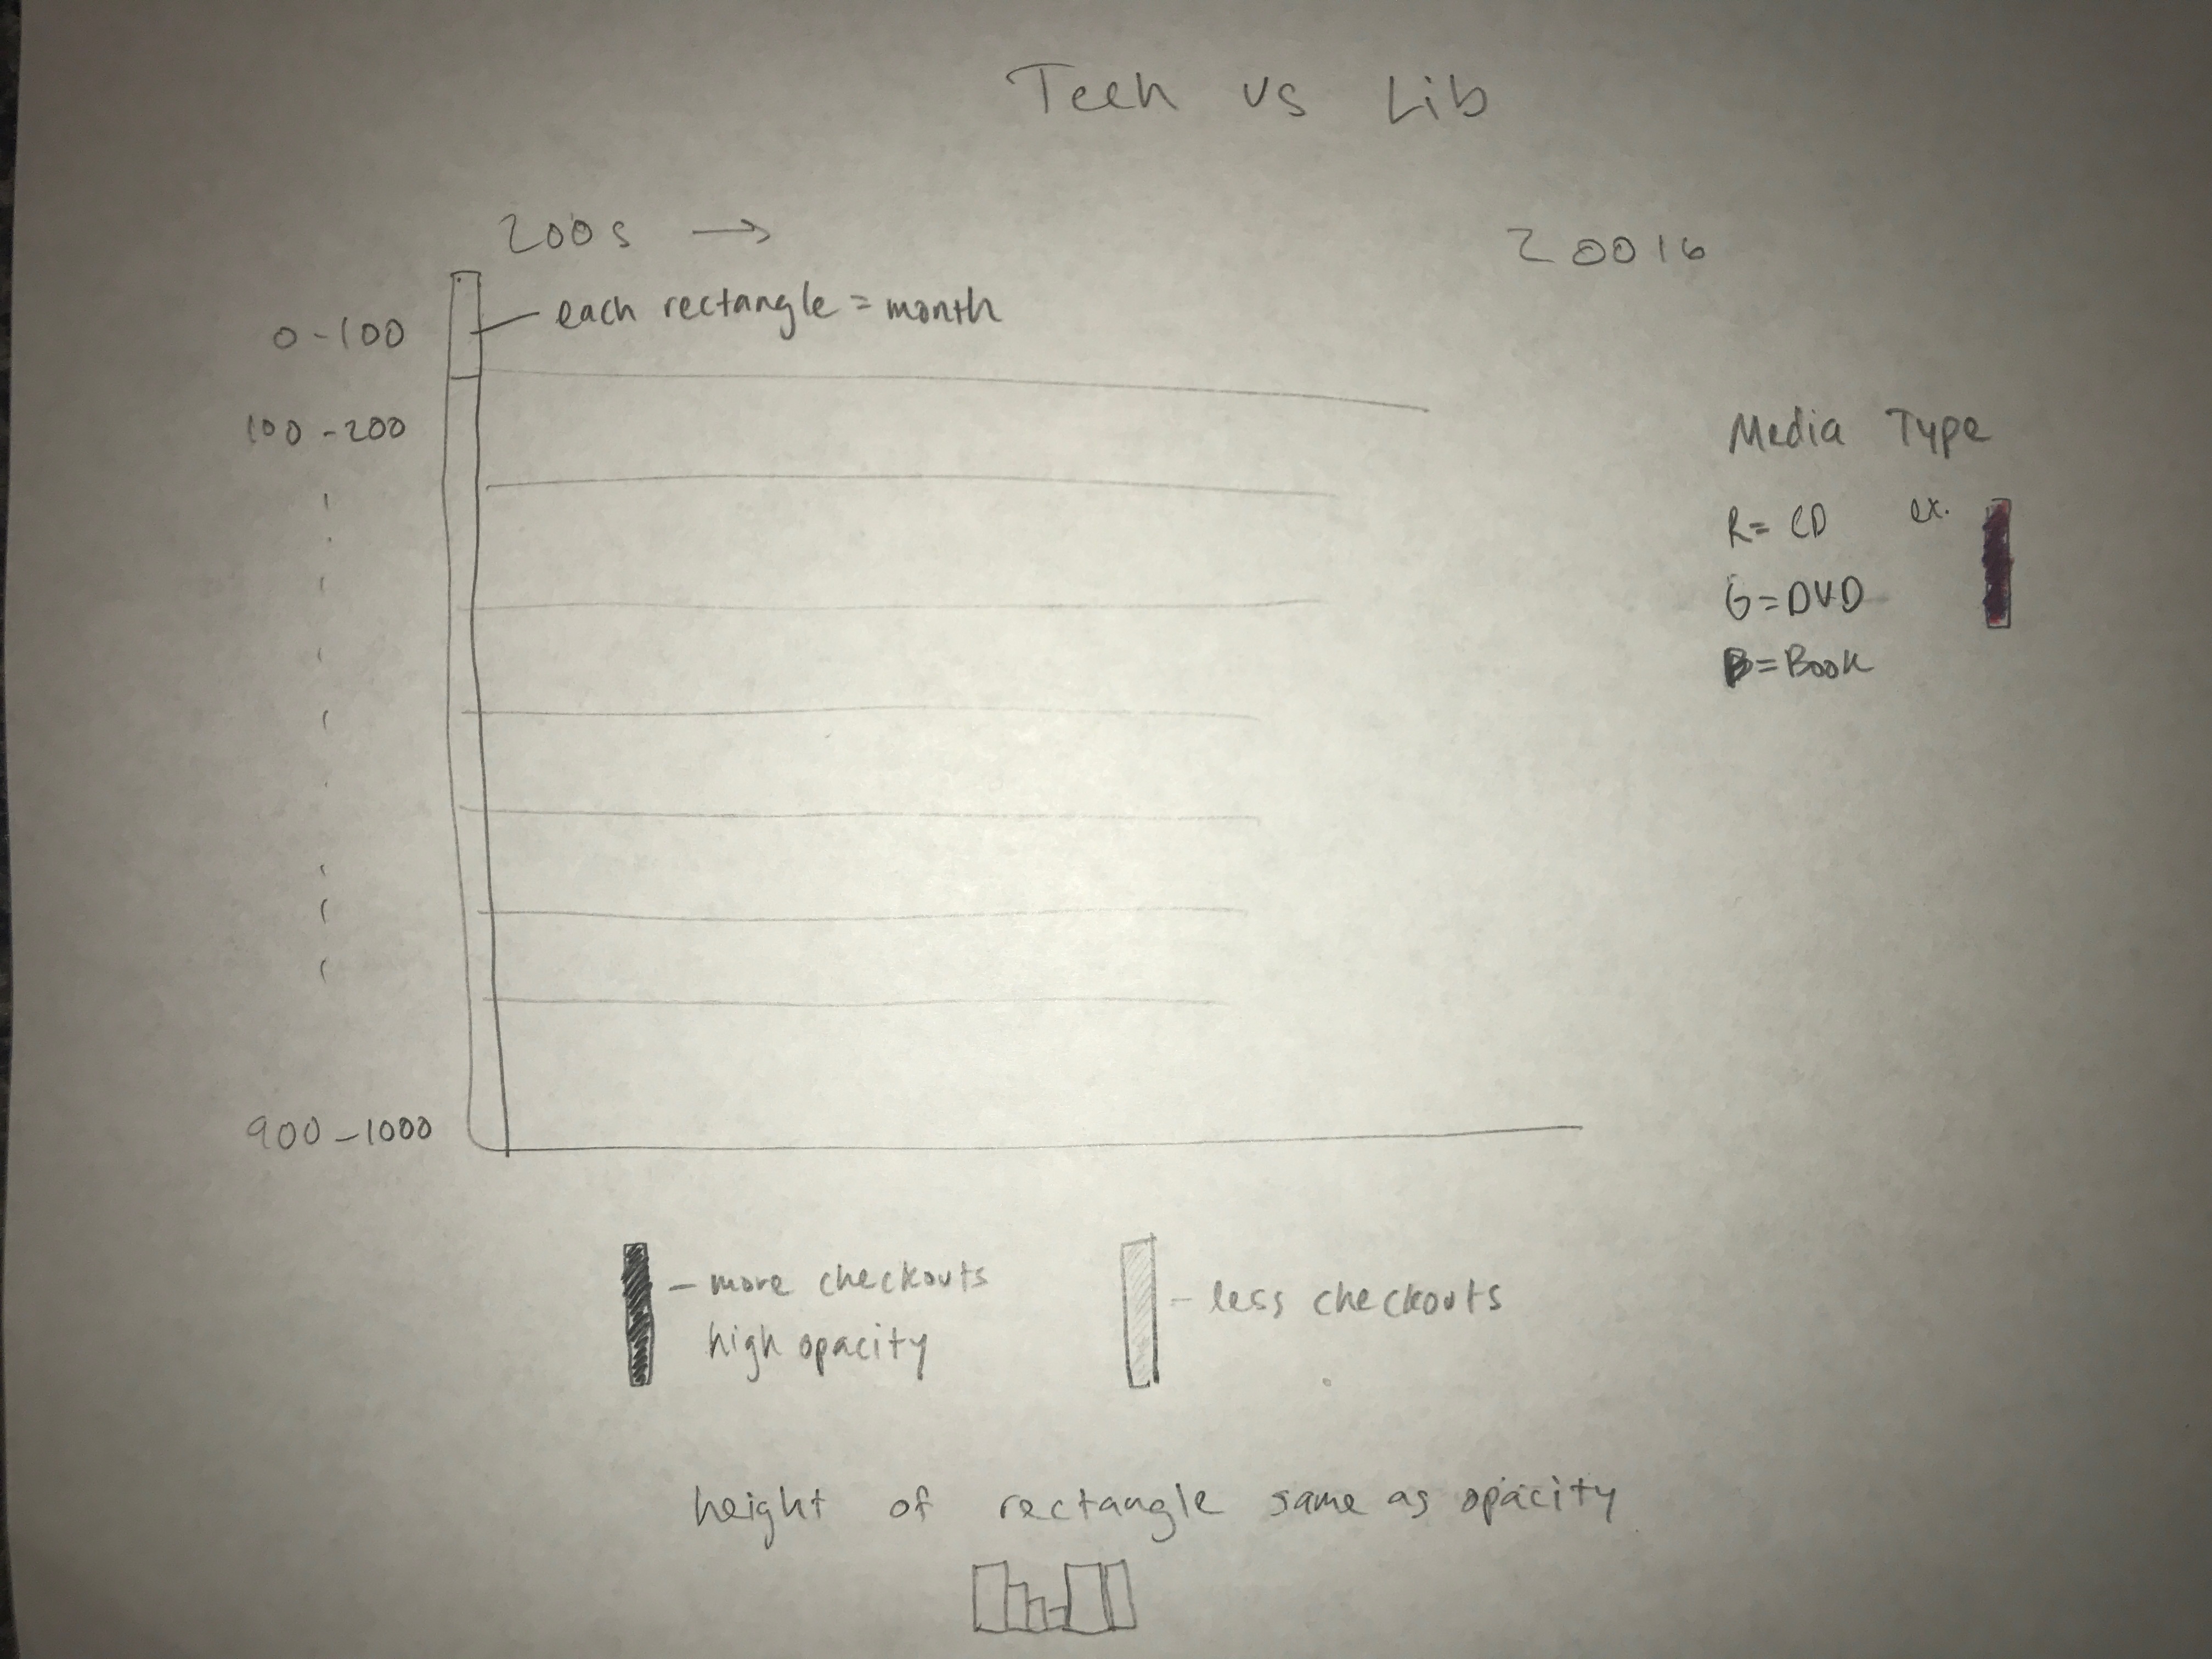
To visualize the information I wanted to use the same rectangular format and change the opacity and color to show more information. Because the opacity did not show enough information as I wanted, I decided to change the heights of the rectangle to illustrate more. The color choice is not very clear in the sketch, but I wanted to combine the rgb colors with red representing CD's, green representing DVD's, and blue representing books.
Process
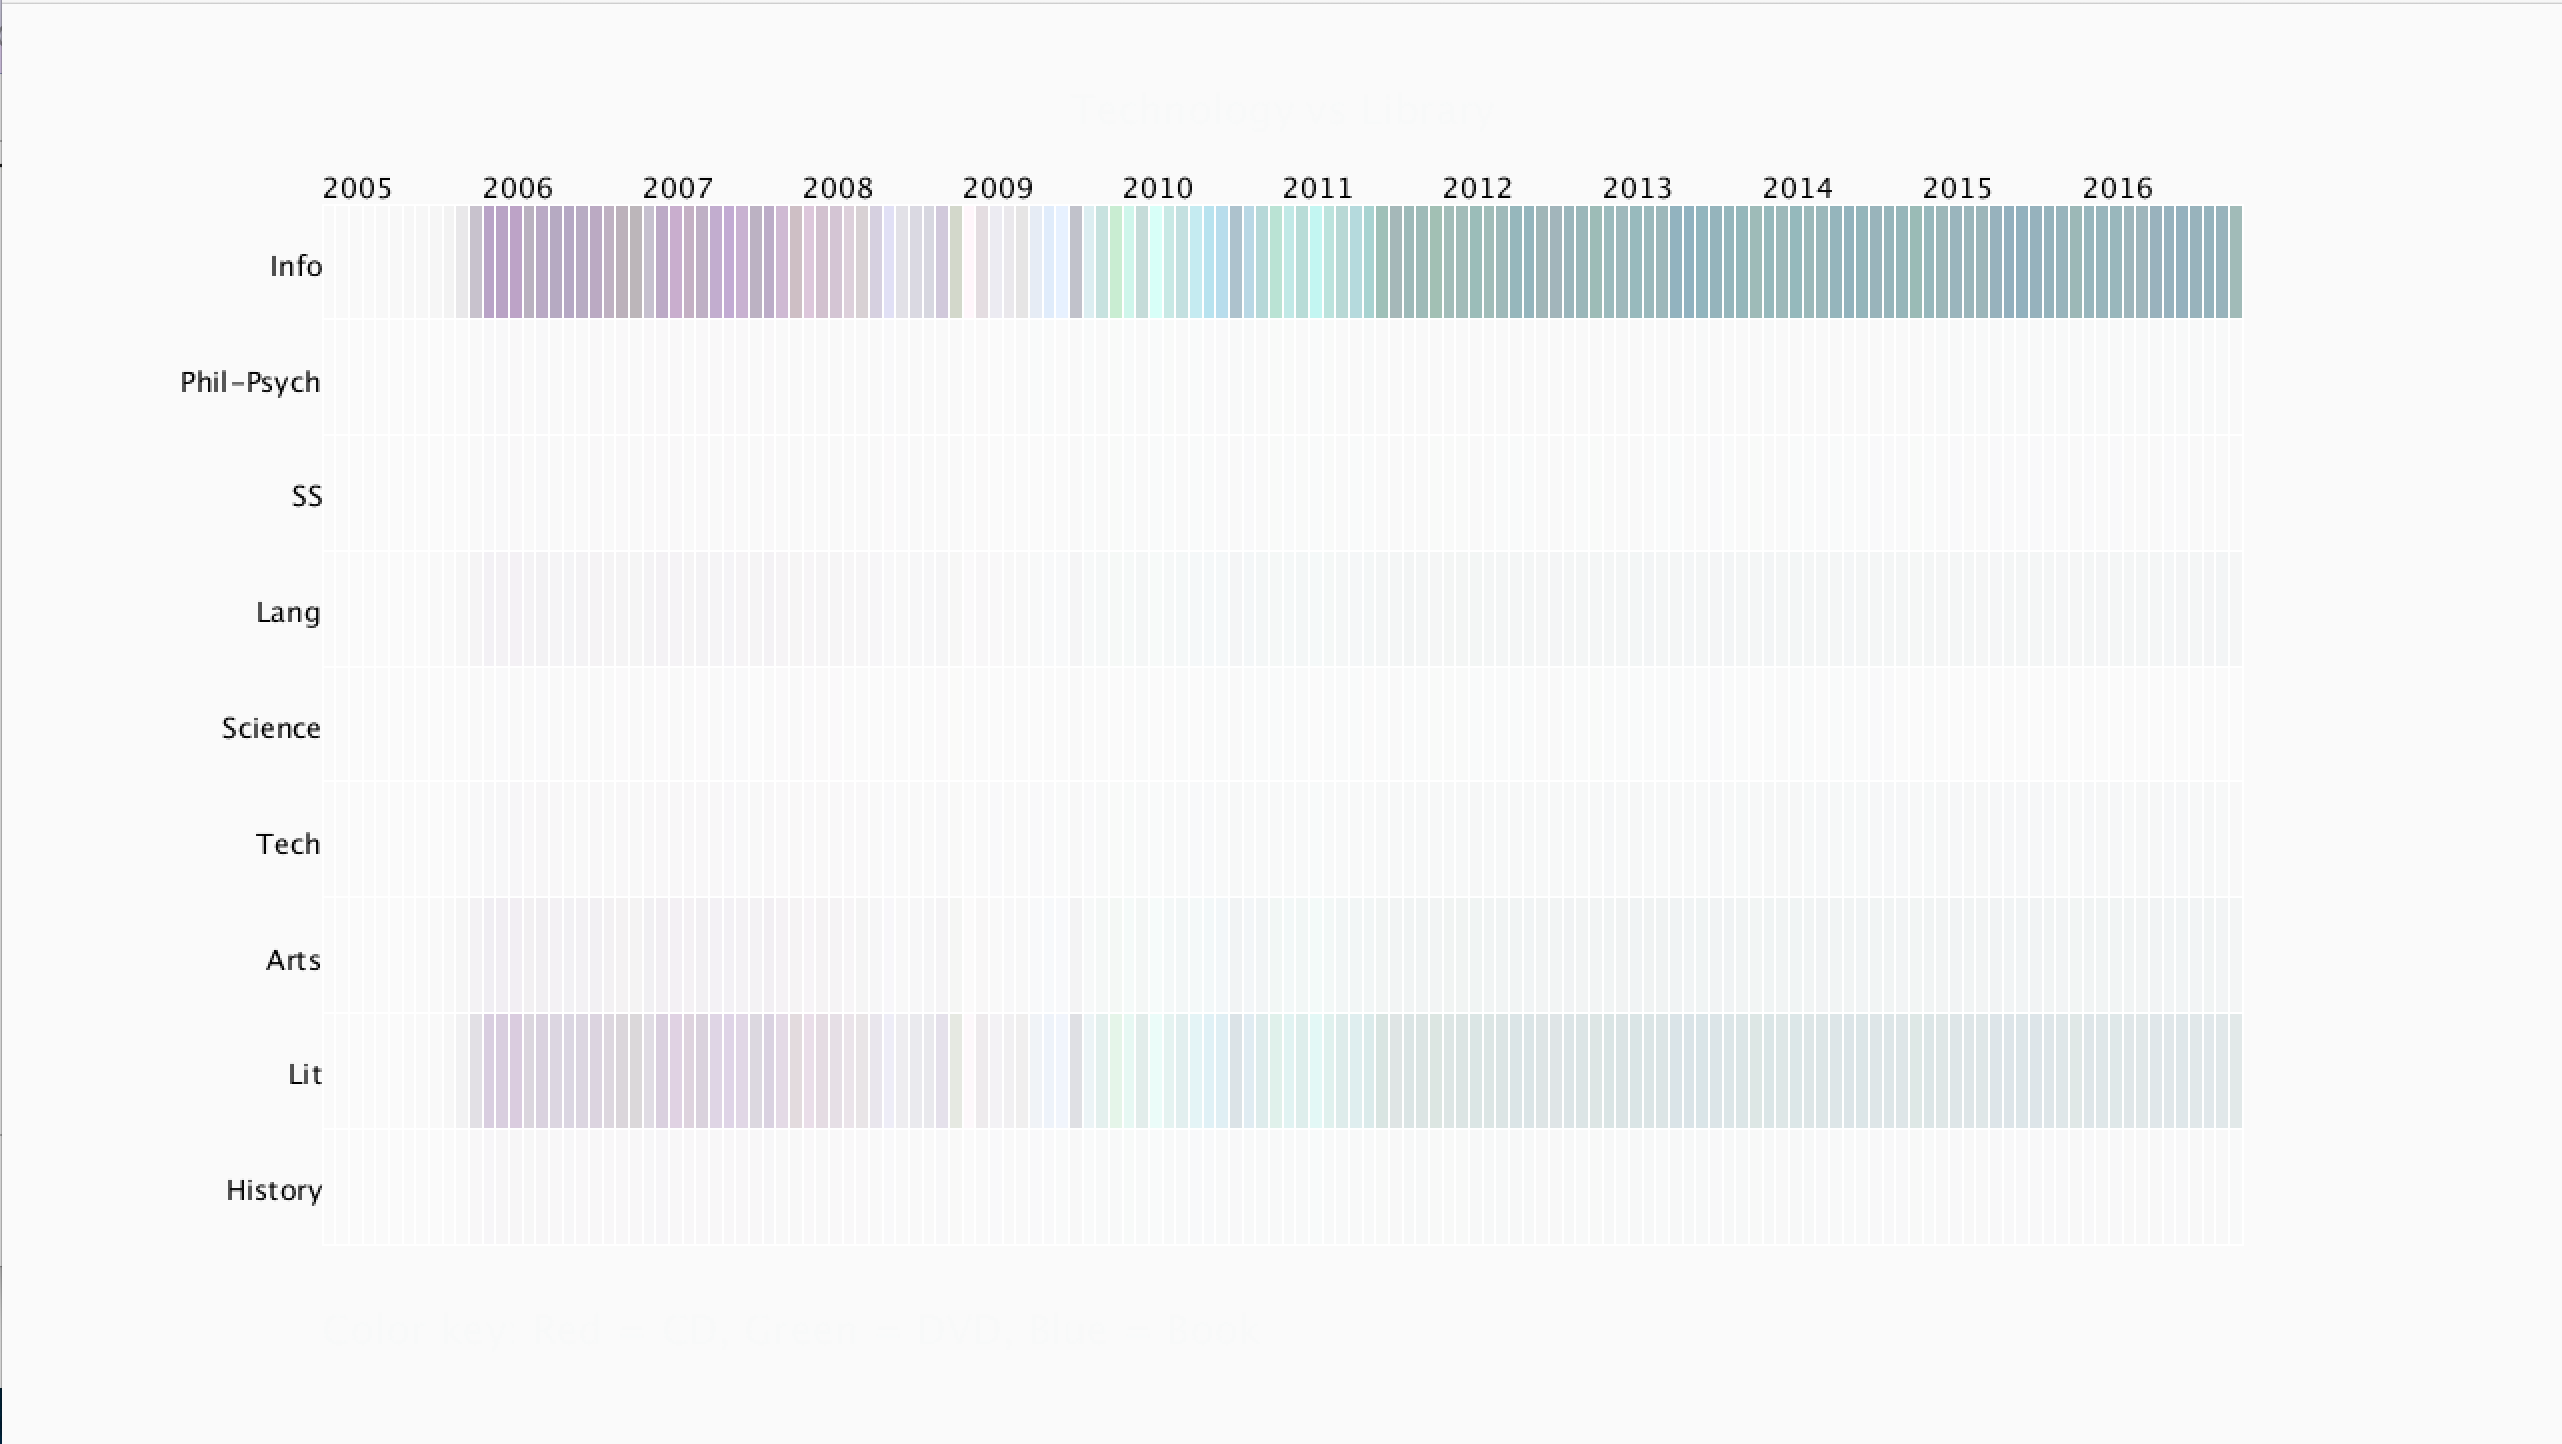
The screenshot below illustrates how I first began the project. Becausue every item was being compared to all the rest of the items, the opacity of the Info and Lit dewey classes was much greater than the rest of the dewey class's. To distribute it more evenly I was able to take the naturual log of all the data to acheive a greater opacity from the other data. Also, the data is still unclear with the different opacities, so instead of the rectangles all being the same height, my final project makes each rectangle a certain length compared to the amouunt of checkouts it has for each dewey class from that month.
Final result
Finally, one can see that the natural log of all the data can clearly show all of the information. The opacity illustrates the popularity of the item and the color describes what type of items were getting checked out. The purple, for example shows that CD's and Book's were the items most often getting checked out.
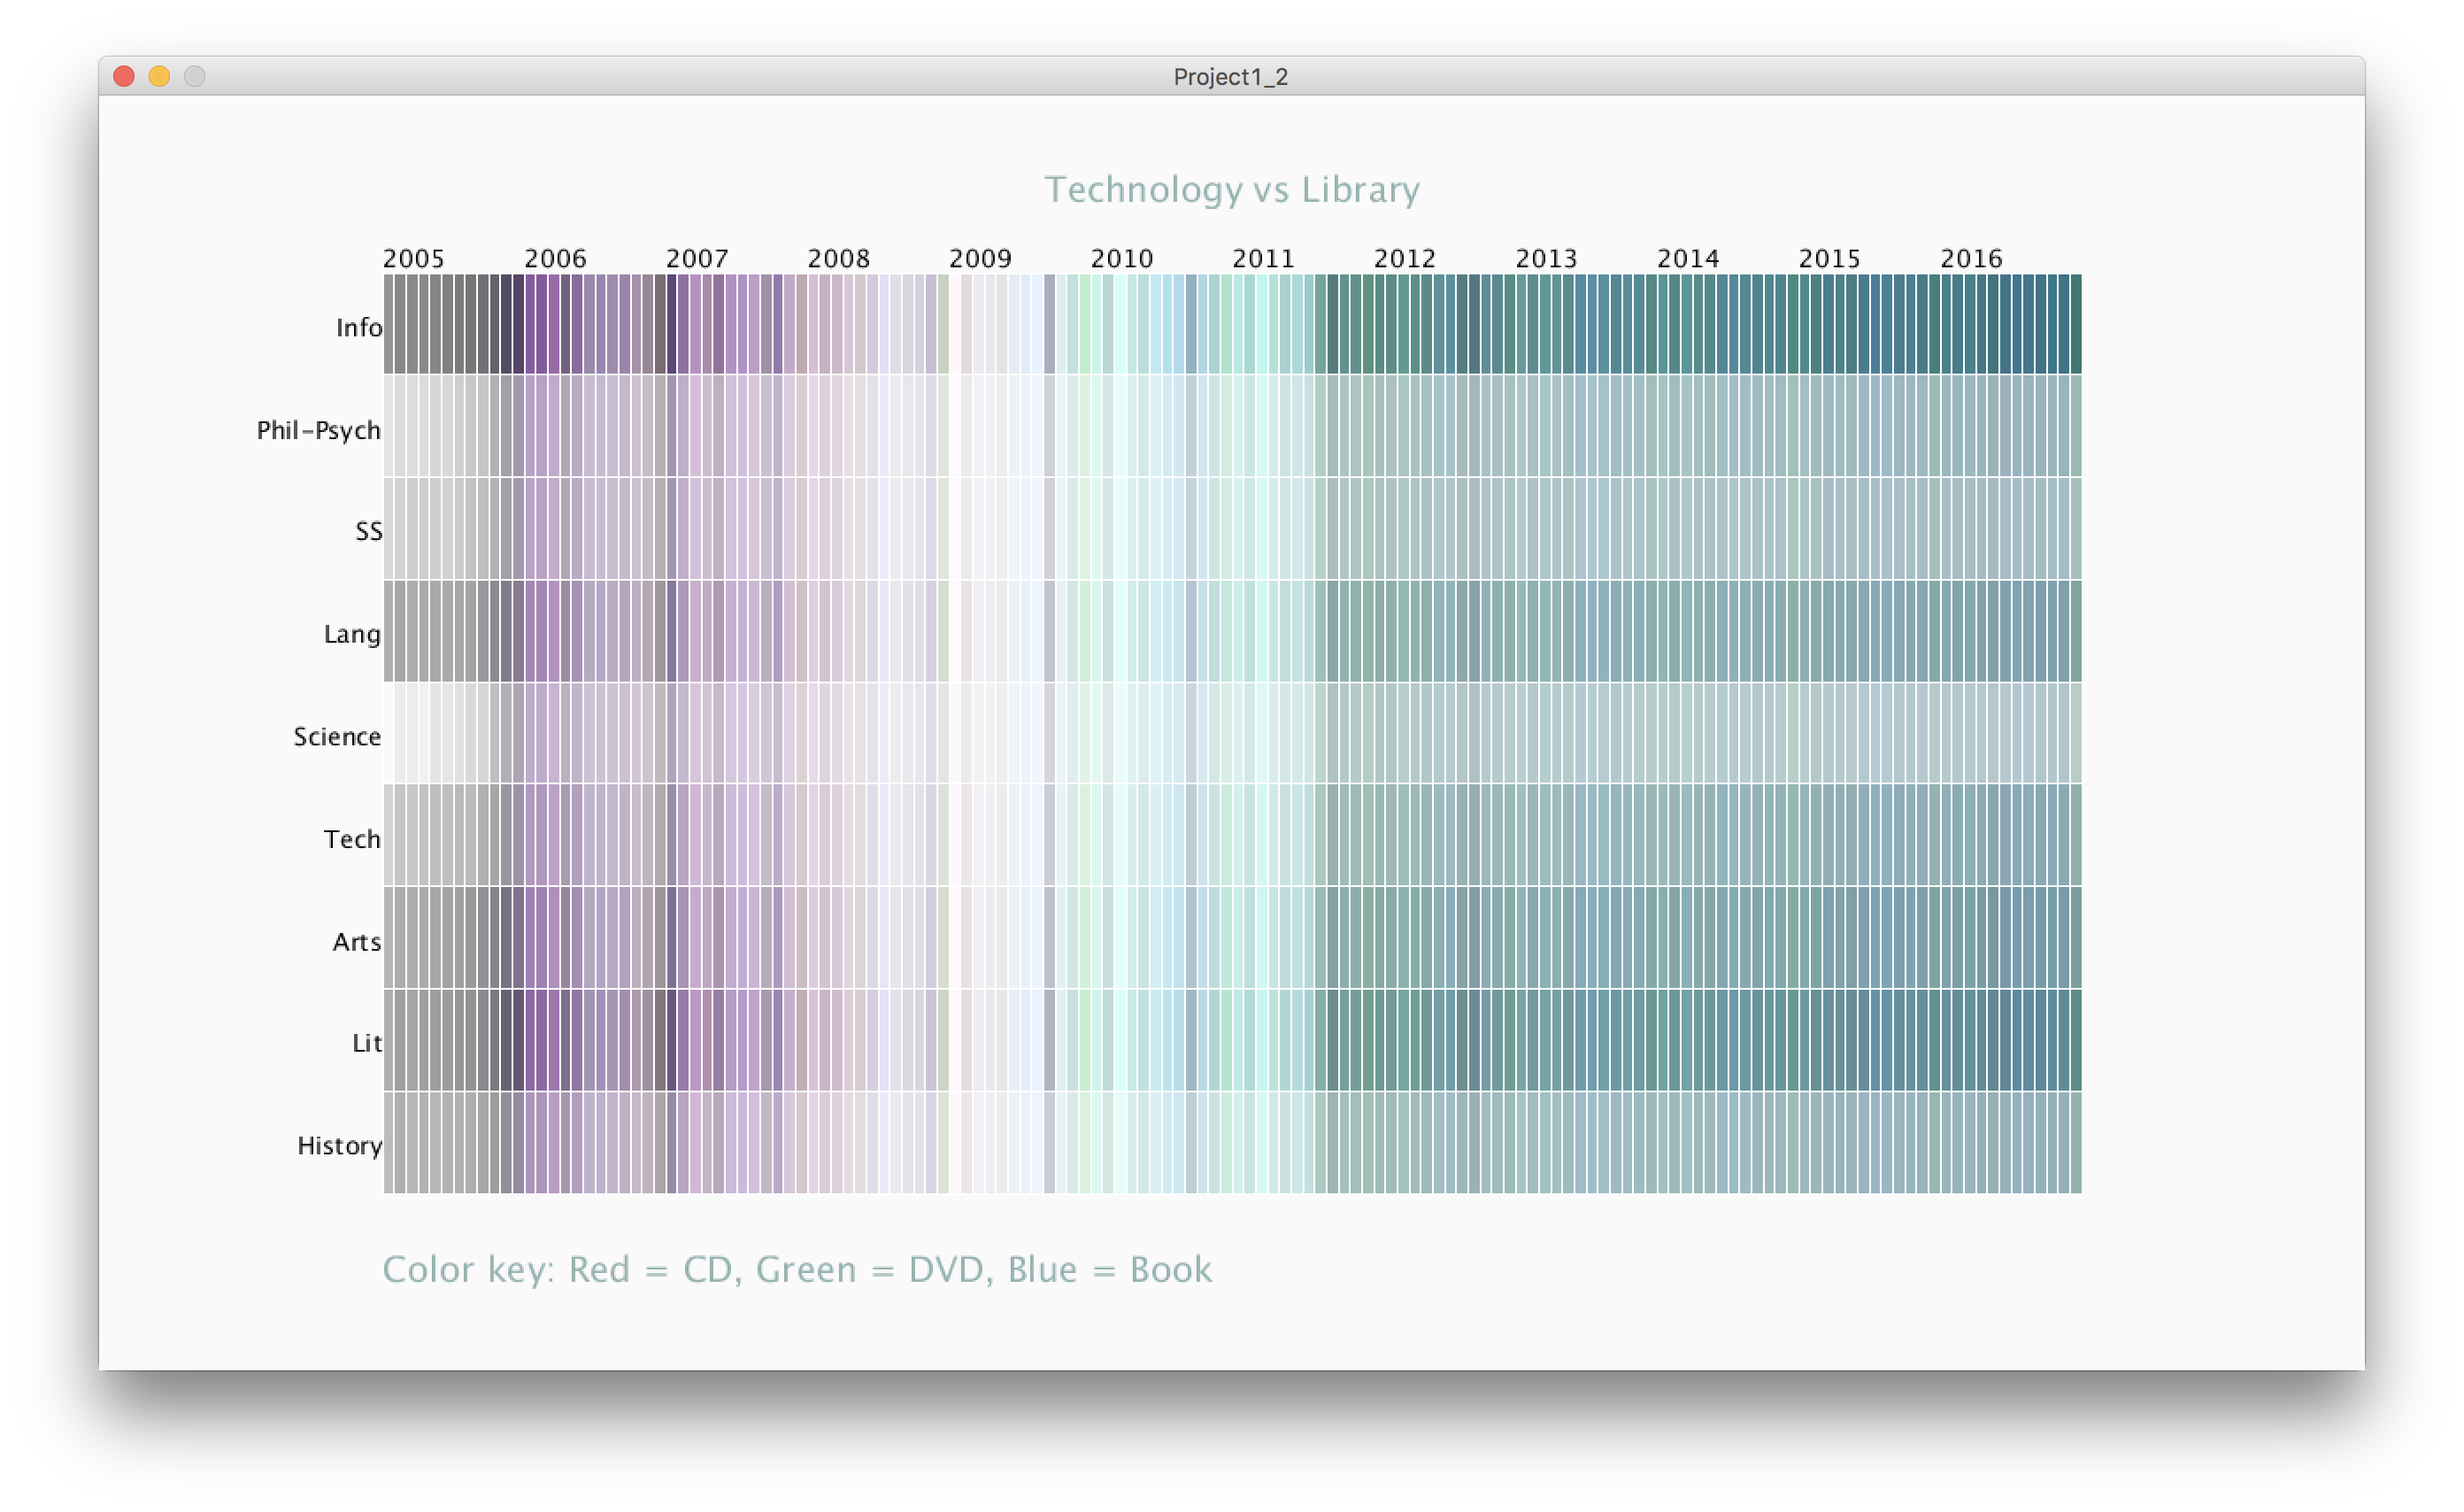
The second picture also includes the rectangles representing the populartiy of checkouts. By pressing the up arrow on the keyboard it maps the information to the top of graphs for each row.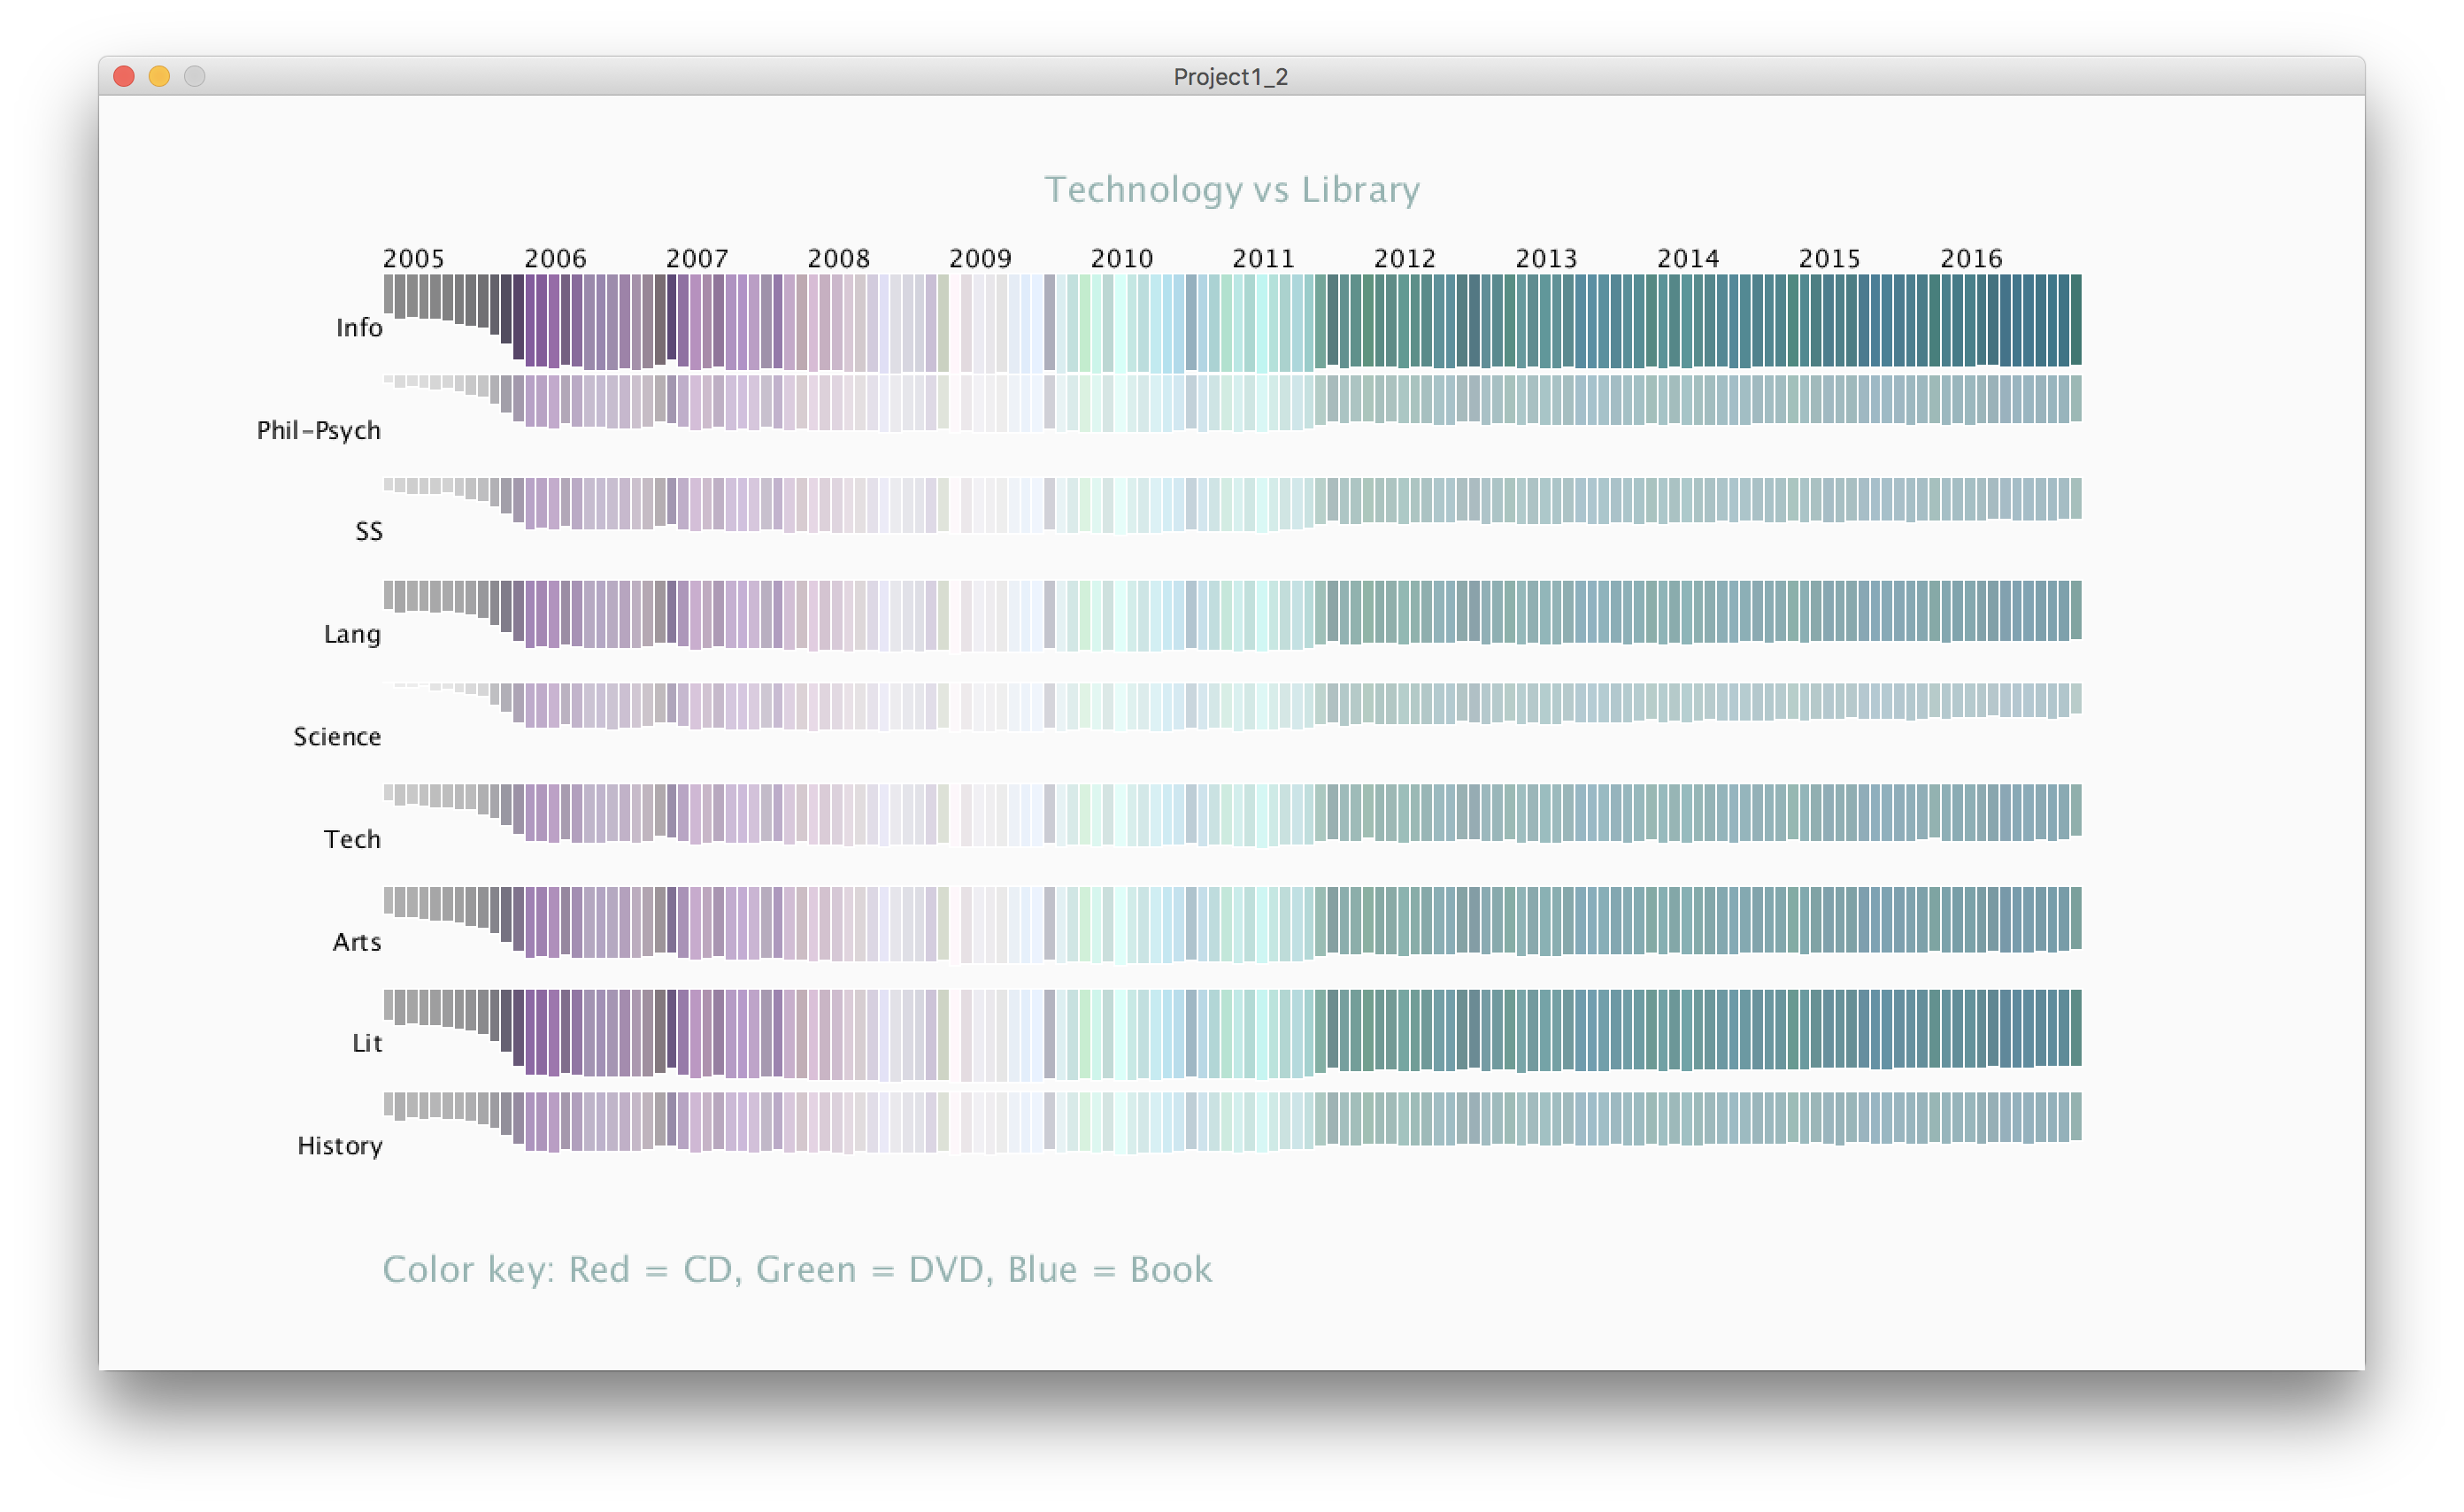
The third picture is very similar to the previous image, but instead of mapping the info to the top of each row, the information is centered. This gives a different visualization of how to show the same information.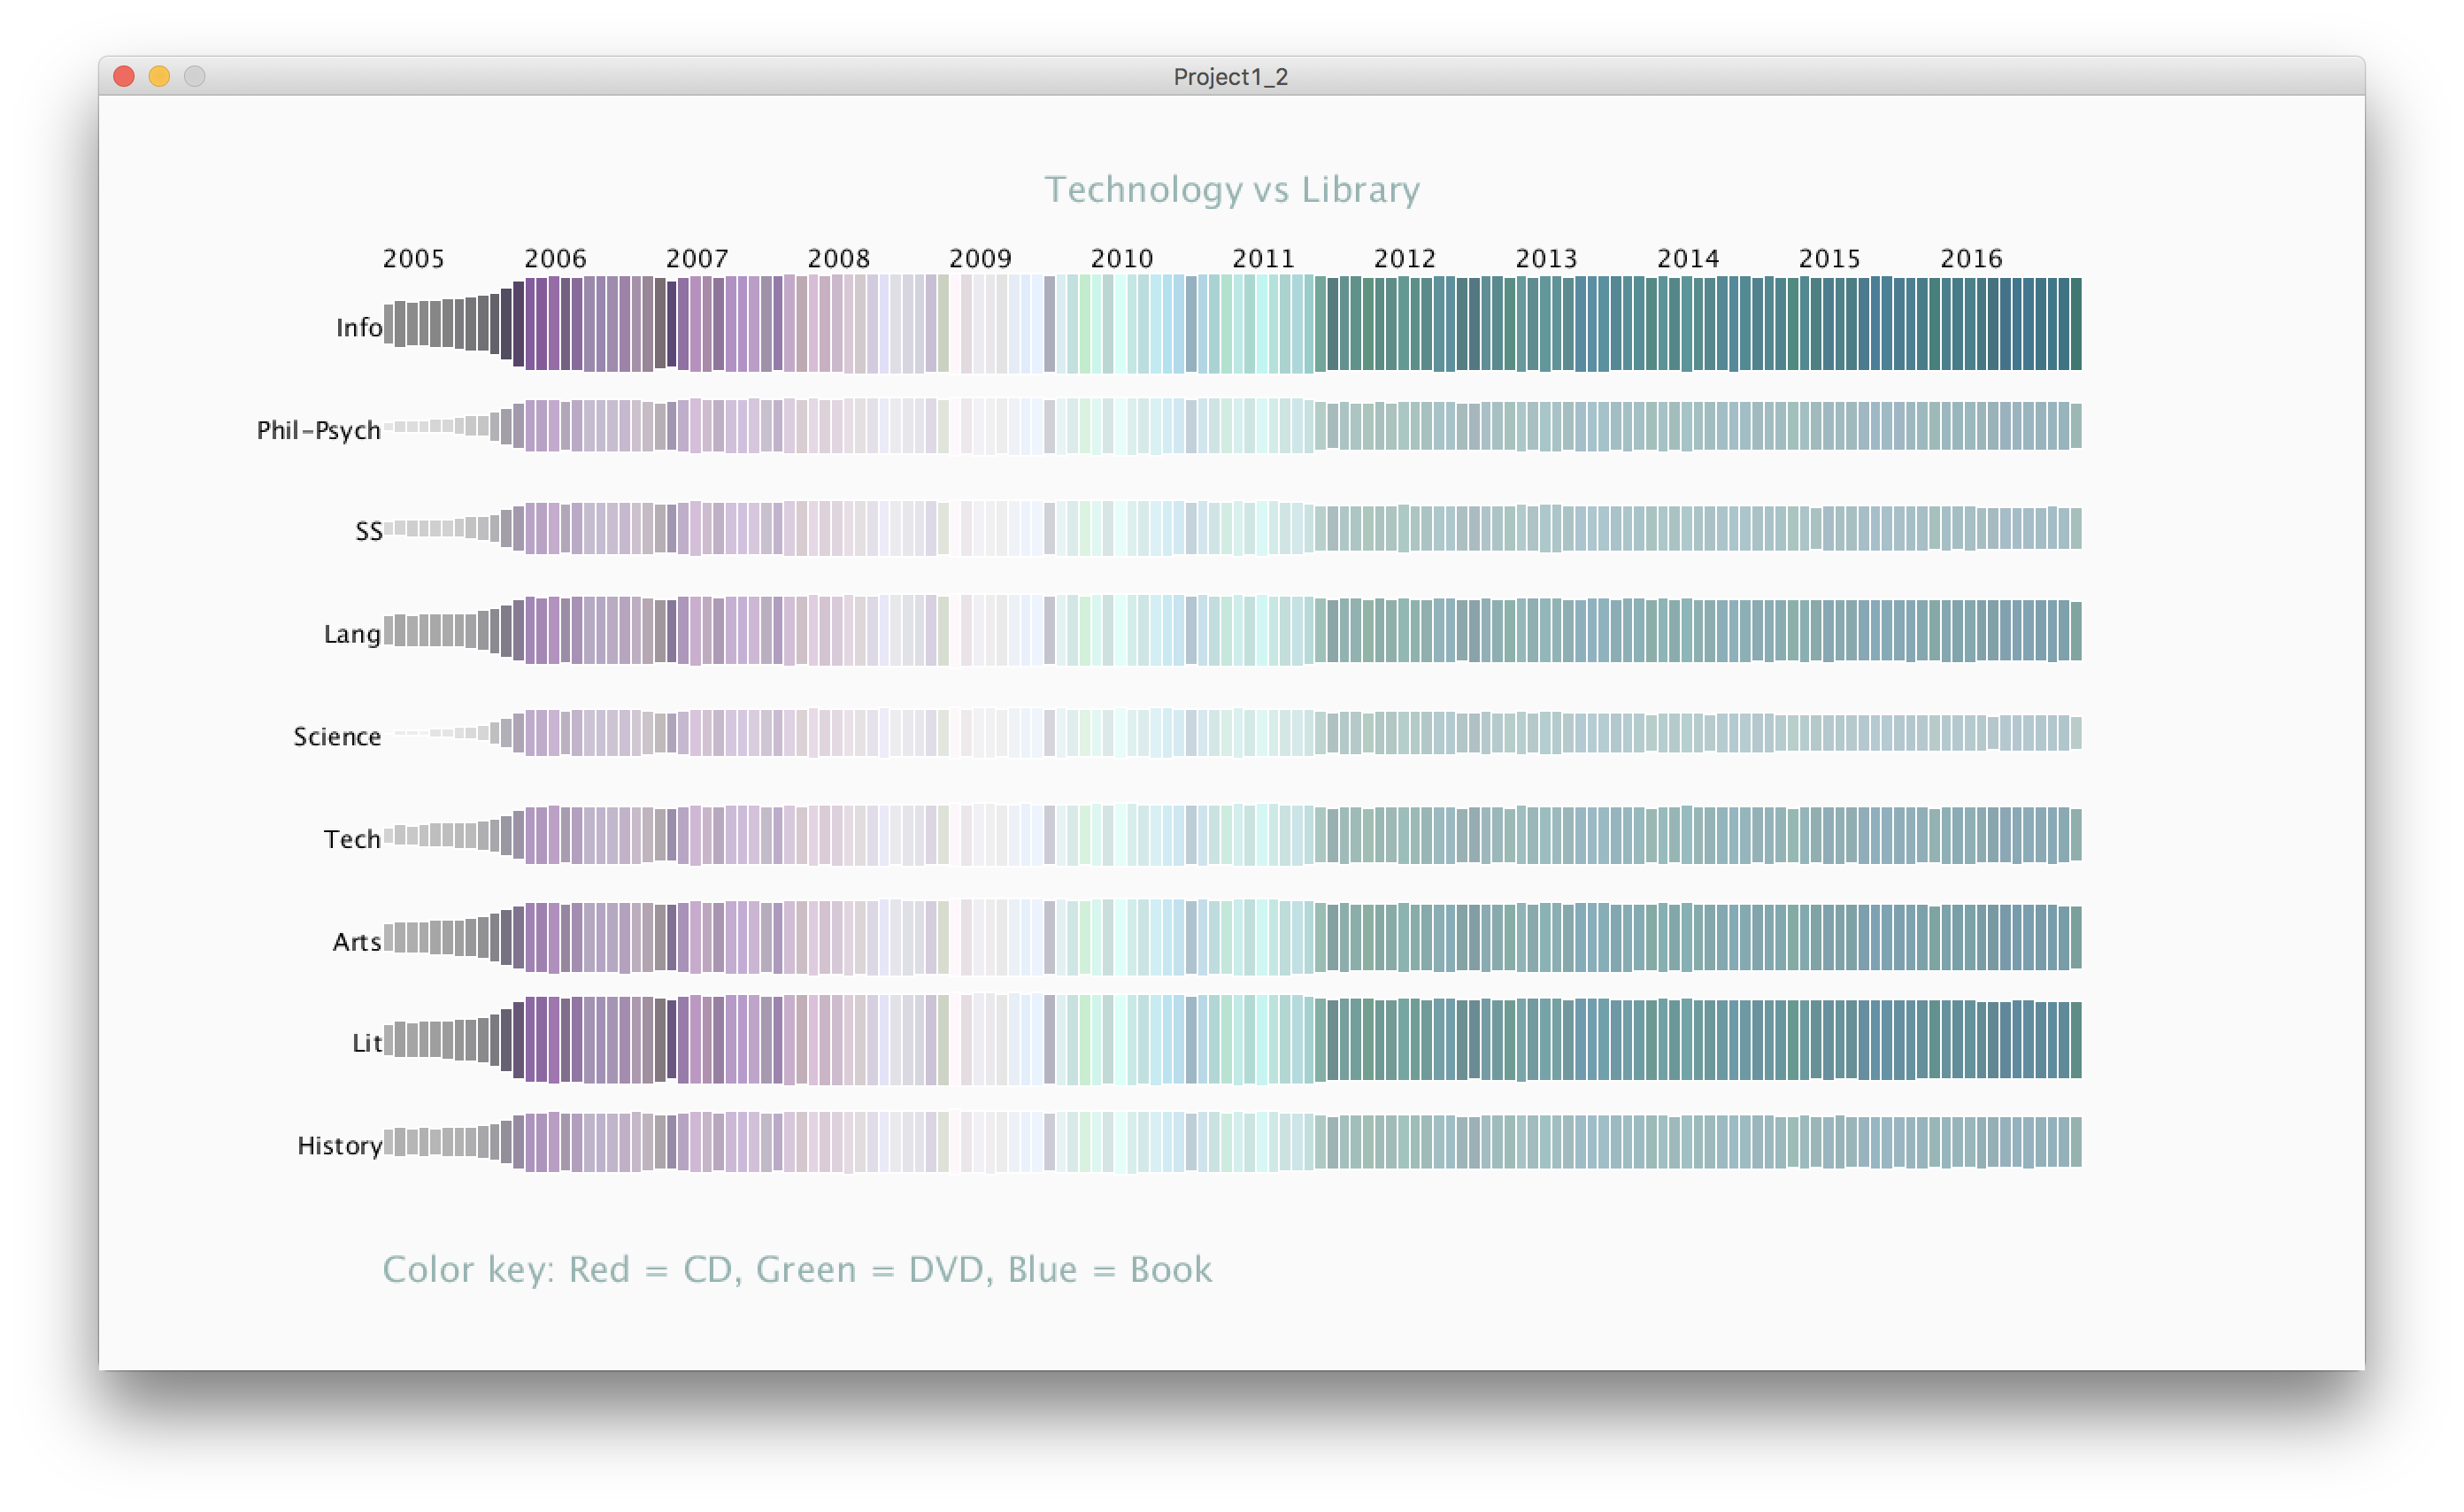
Evaluation/Analysis
My question was asking whether or not technology has effected the items being checked out from the Seattle Public Library. Looking just at the dewey classes, we can see that it seems like the Info and Lit classes consistently since 2005 are the items that are the most checked out. Also, the opacity gets lower and the length of the rectangles gets smaller right after 2009 and 2010. I thought this was really interesting because during this similar time a lot of technology advancements were being made, such as the app store. The stock market in companies such as amazon and google all started to begin increasing during this time period. Amazon and google both created their own ebooks, which I assume detracted from people going to the library. The color is also significant in how technology has changed people usage of media types being checked out at the library. One can see how that any color of red, which represents CD's, disappears after 2009. DVD's also became less popular, but not as evident at CD's. Books on the other hand are still consistenly being checked out. Because of advancements such as itunes and spotify people are no longer in need of CD's and streaming servives like Netflix make it less necessary for people to have to checkout DVD's.
Code