The S&P 500
MAT 259, 2016
Jordan Hughes
Concept
For my final project for the course I wanted to implement some kind of real time visualization of the stock market. Starting from that, I decided to work with the S&P 500. The S&P500 is what is known as a stock index. It is a list of 500 (505 to be exact) companies that make up a very large percentage (70-80%) of the total market capitalization of American exchanges. I decided I wanted to used some kind of a space or planetary metaphor for the actual visualization.
Data
The first step in gathering the data was to get a list of the S&P500. I found one an appropriate list here. After that, I needed to find an API that would work for getting real time quotes for those securities. I went with the TradeKing API which has many endpoints and can be queried for quotes at a rate of 60 per second. The full API is located here. Below is a sample of the data that I can query on a per second basis.
            //A Sample Data Query
{ "response":{ "@id":"385eca86-7b6b-4c30-b9b2-02472bab7850", "elapsedtime": "0", "quotes":{"quote":{"adp_100":"21.9758","adp_200":"21.6211","adp_50":"21.3420","adv_21":"4150403","adv_30":"4328619","adv_90":"4592093","ask":"21.110","ask_time":"13:09","asksz":"23","basis":"na","beta":"1.5578","bid":"21.100","bid_time":"13:09","bidsz":"21","bidtick":"d","chg":"0.2350","chg_sign":"d","chg_t":"na","cl":"21.340","contract_size":"na","cusip":"na","date":"2016-03-15","datetime":"2016-03-15T13:09:00-04:00","days_to_expiration":"na","div":"0.1500","divexdate":"20160226","divfreq":"Q","divpaydt":"20160315","dollar_value":"30807571.625","eps":"1.0900","exch":"NYSE","exch_desc":"New York Stock Exchange","hi":"21.290","iad":"0.6000","idelta":"na","igamma":"na","imp_volatility":"na","incr_vl":"100","irho":"na","issue_desc":"na","itheta":"na","ivega":"na","last":"21.105","lo":"21.100","name":"INTERPUBLIC GROUP OF COMPANIES INC.","op_delivery":"na","op_flag":"1","op_style":"na","op_subclass":"na","openinterest":"na","opn":"21.210","opt_val":"na","pchg":"1.10","pchg_sign":"na","pcls":"21.340","pe":"19.5780","phi":"21.420","plo":"21.190","popn":"21.220","pr_adp_100":"21.9854","pr_adp_200":"21.6056","pr_adp_50":"21.3420","pr_date":"2016-03-14","pr_openinterest":"na","prbook":"4.360","prchg":"0.120","prem_mult":"na","put_call":"na","pvol":"2828648","qcond":"0","rootsymbol":"na","secclass":"0","sesn":"na","sho":"406348000","strikeprice":"na","symbol":"IPG","tcond":"54","timestamp":"1458061756","tr_num":"8261","tradetick":"e","trend":"na","under_cusip":"na","undersymbol":"na","vl":"1452523","volatility12":"0.2297","vwap":"21.209","wk52hi":"23.8000","wk52hidate":"20151230","wk52lo":"18.1600","wk52lodate":"20150901","xdate":"na","xday":"na","xmonth":"na","xyear":"na","yield":"2.8116"}}, "error": "Success" } }
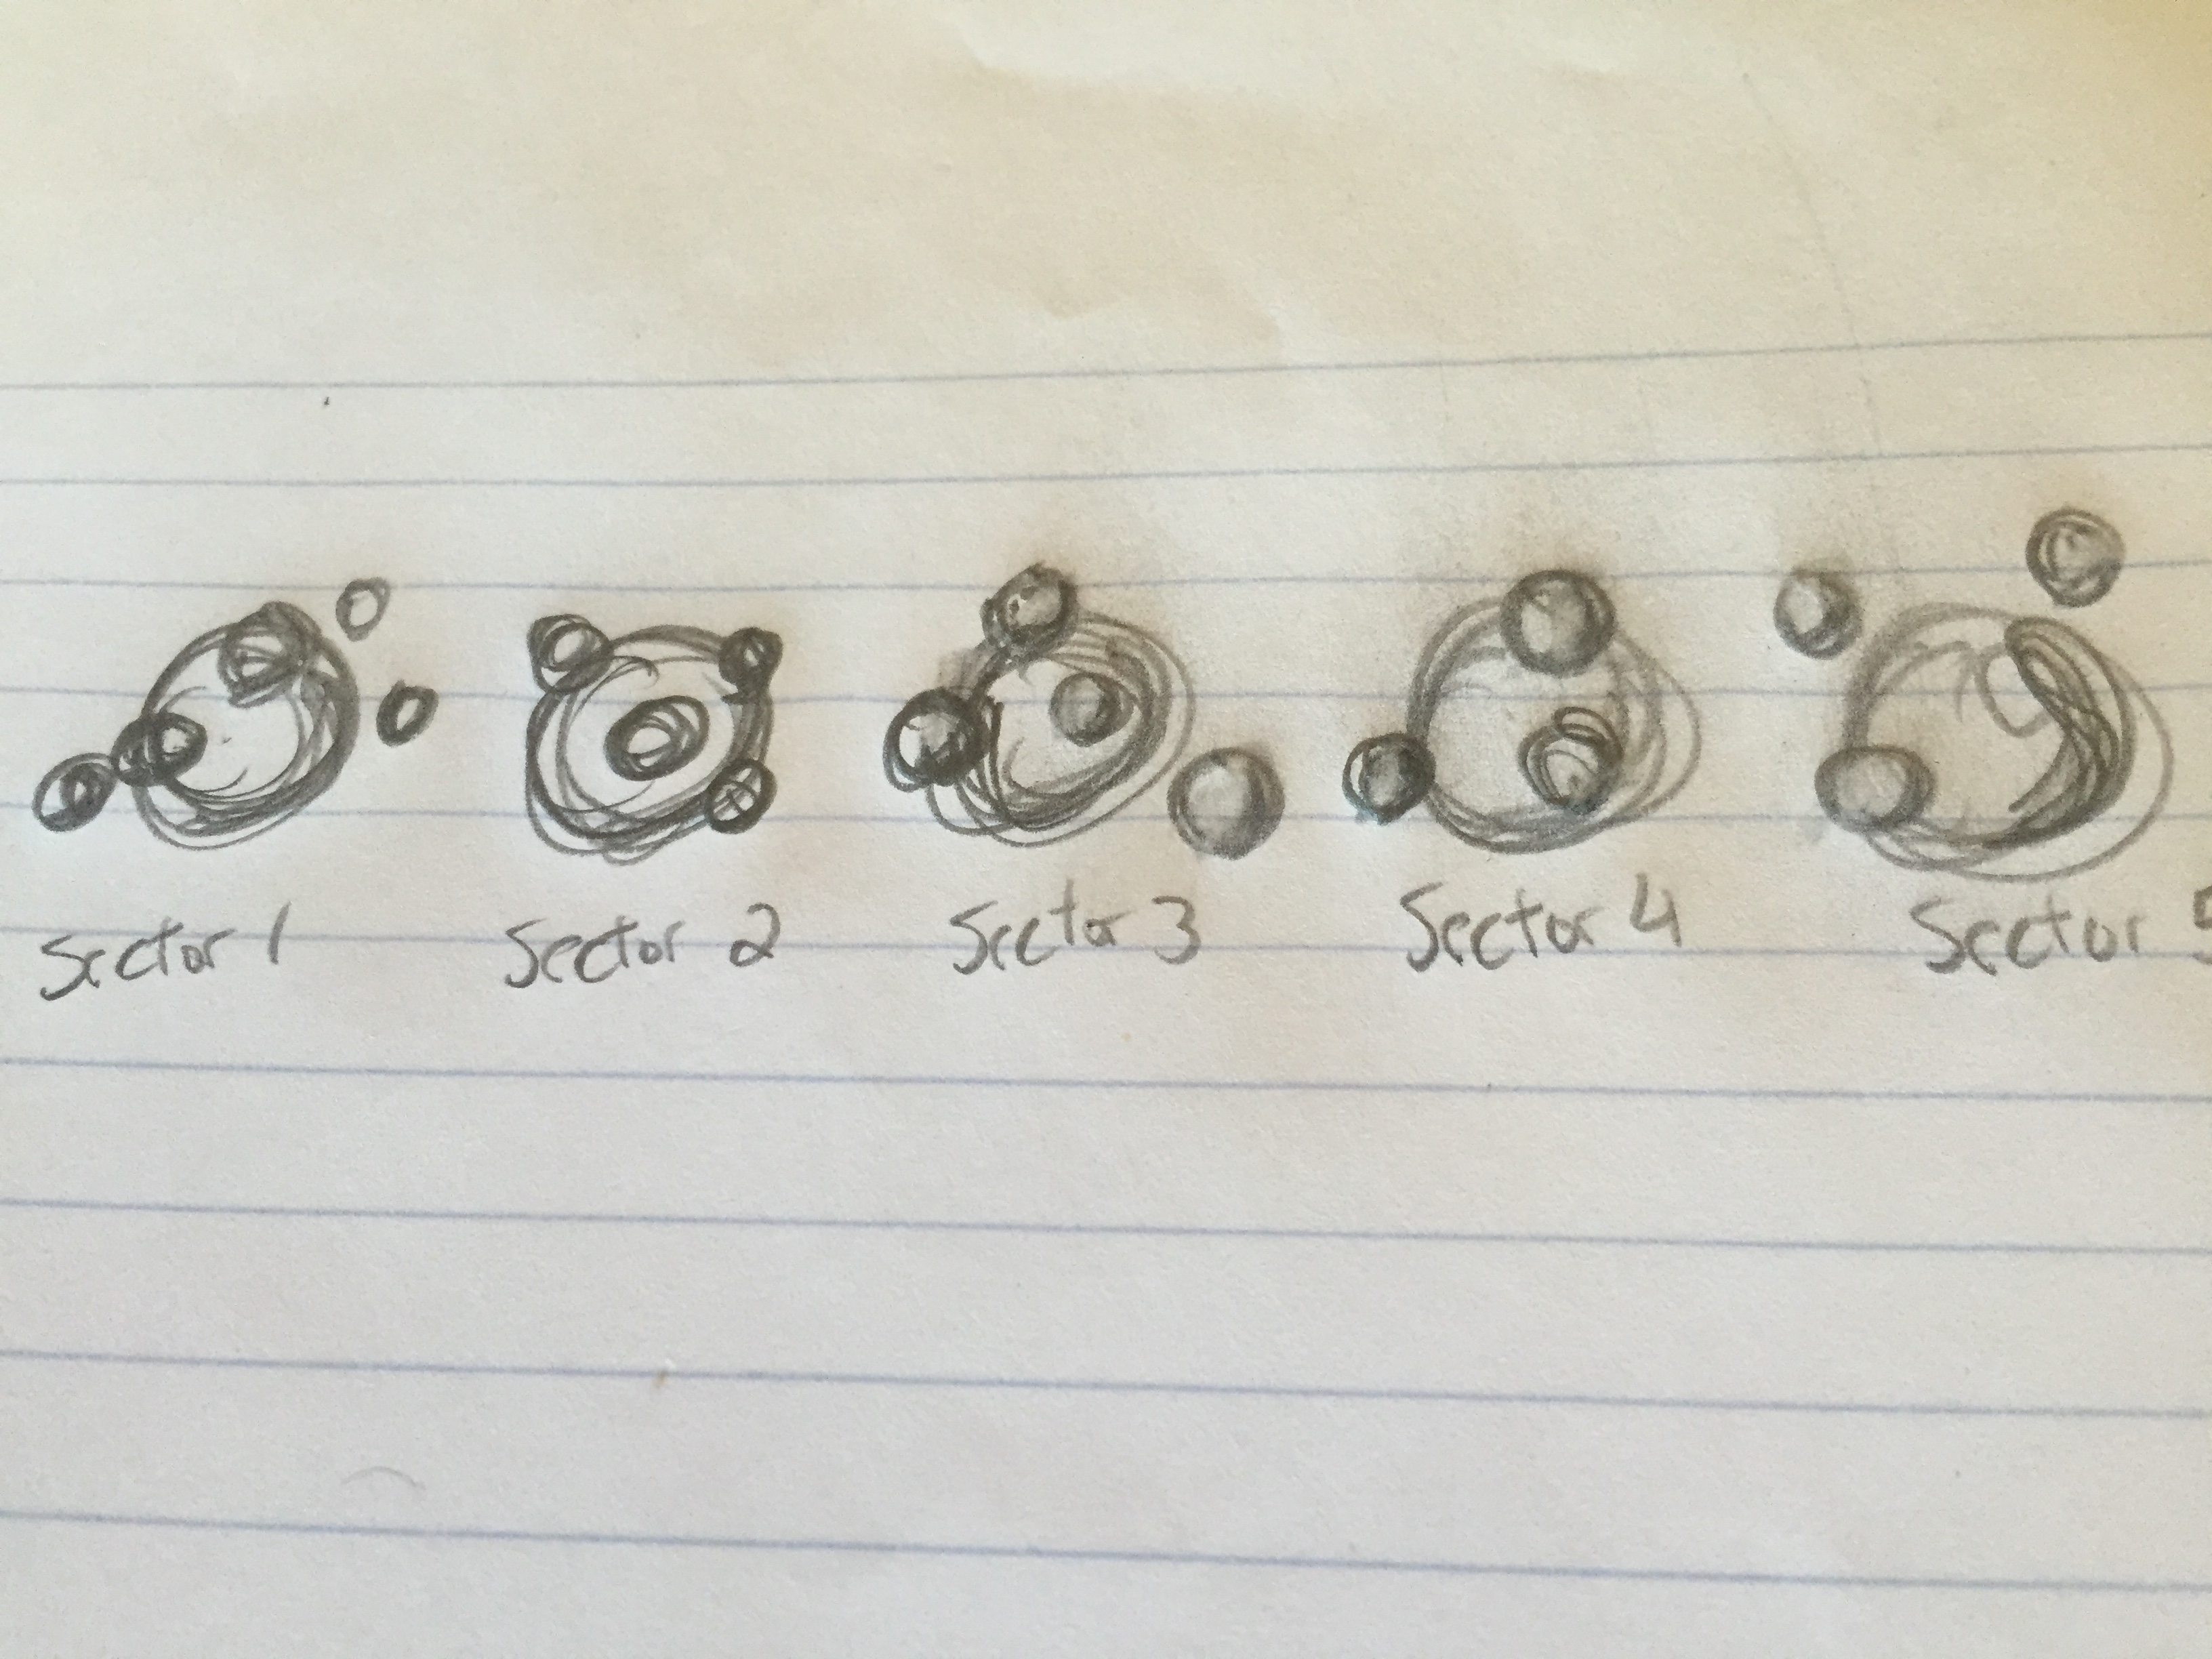
Preliminary sketches
Initially, the idea was simply to have spheres based on sectors.
Process
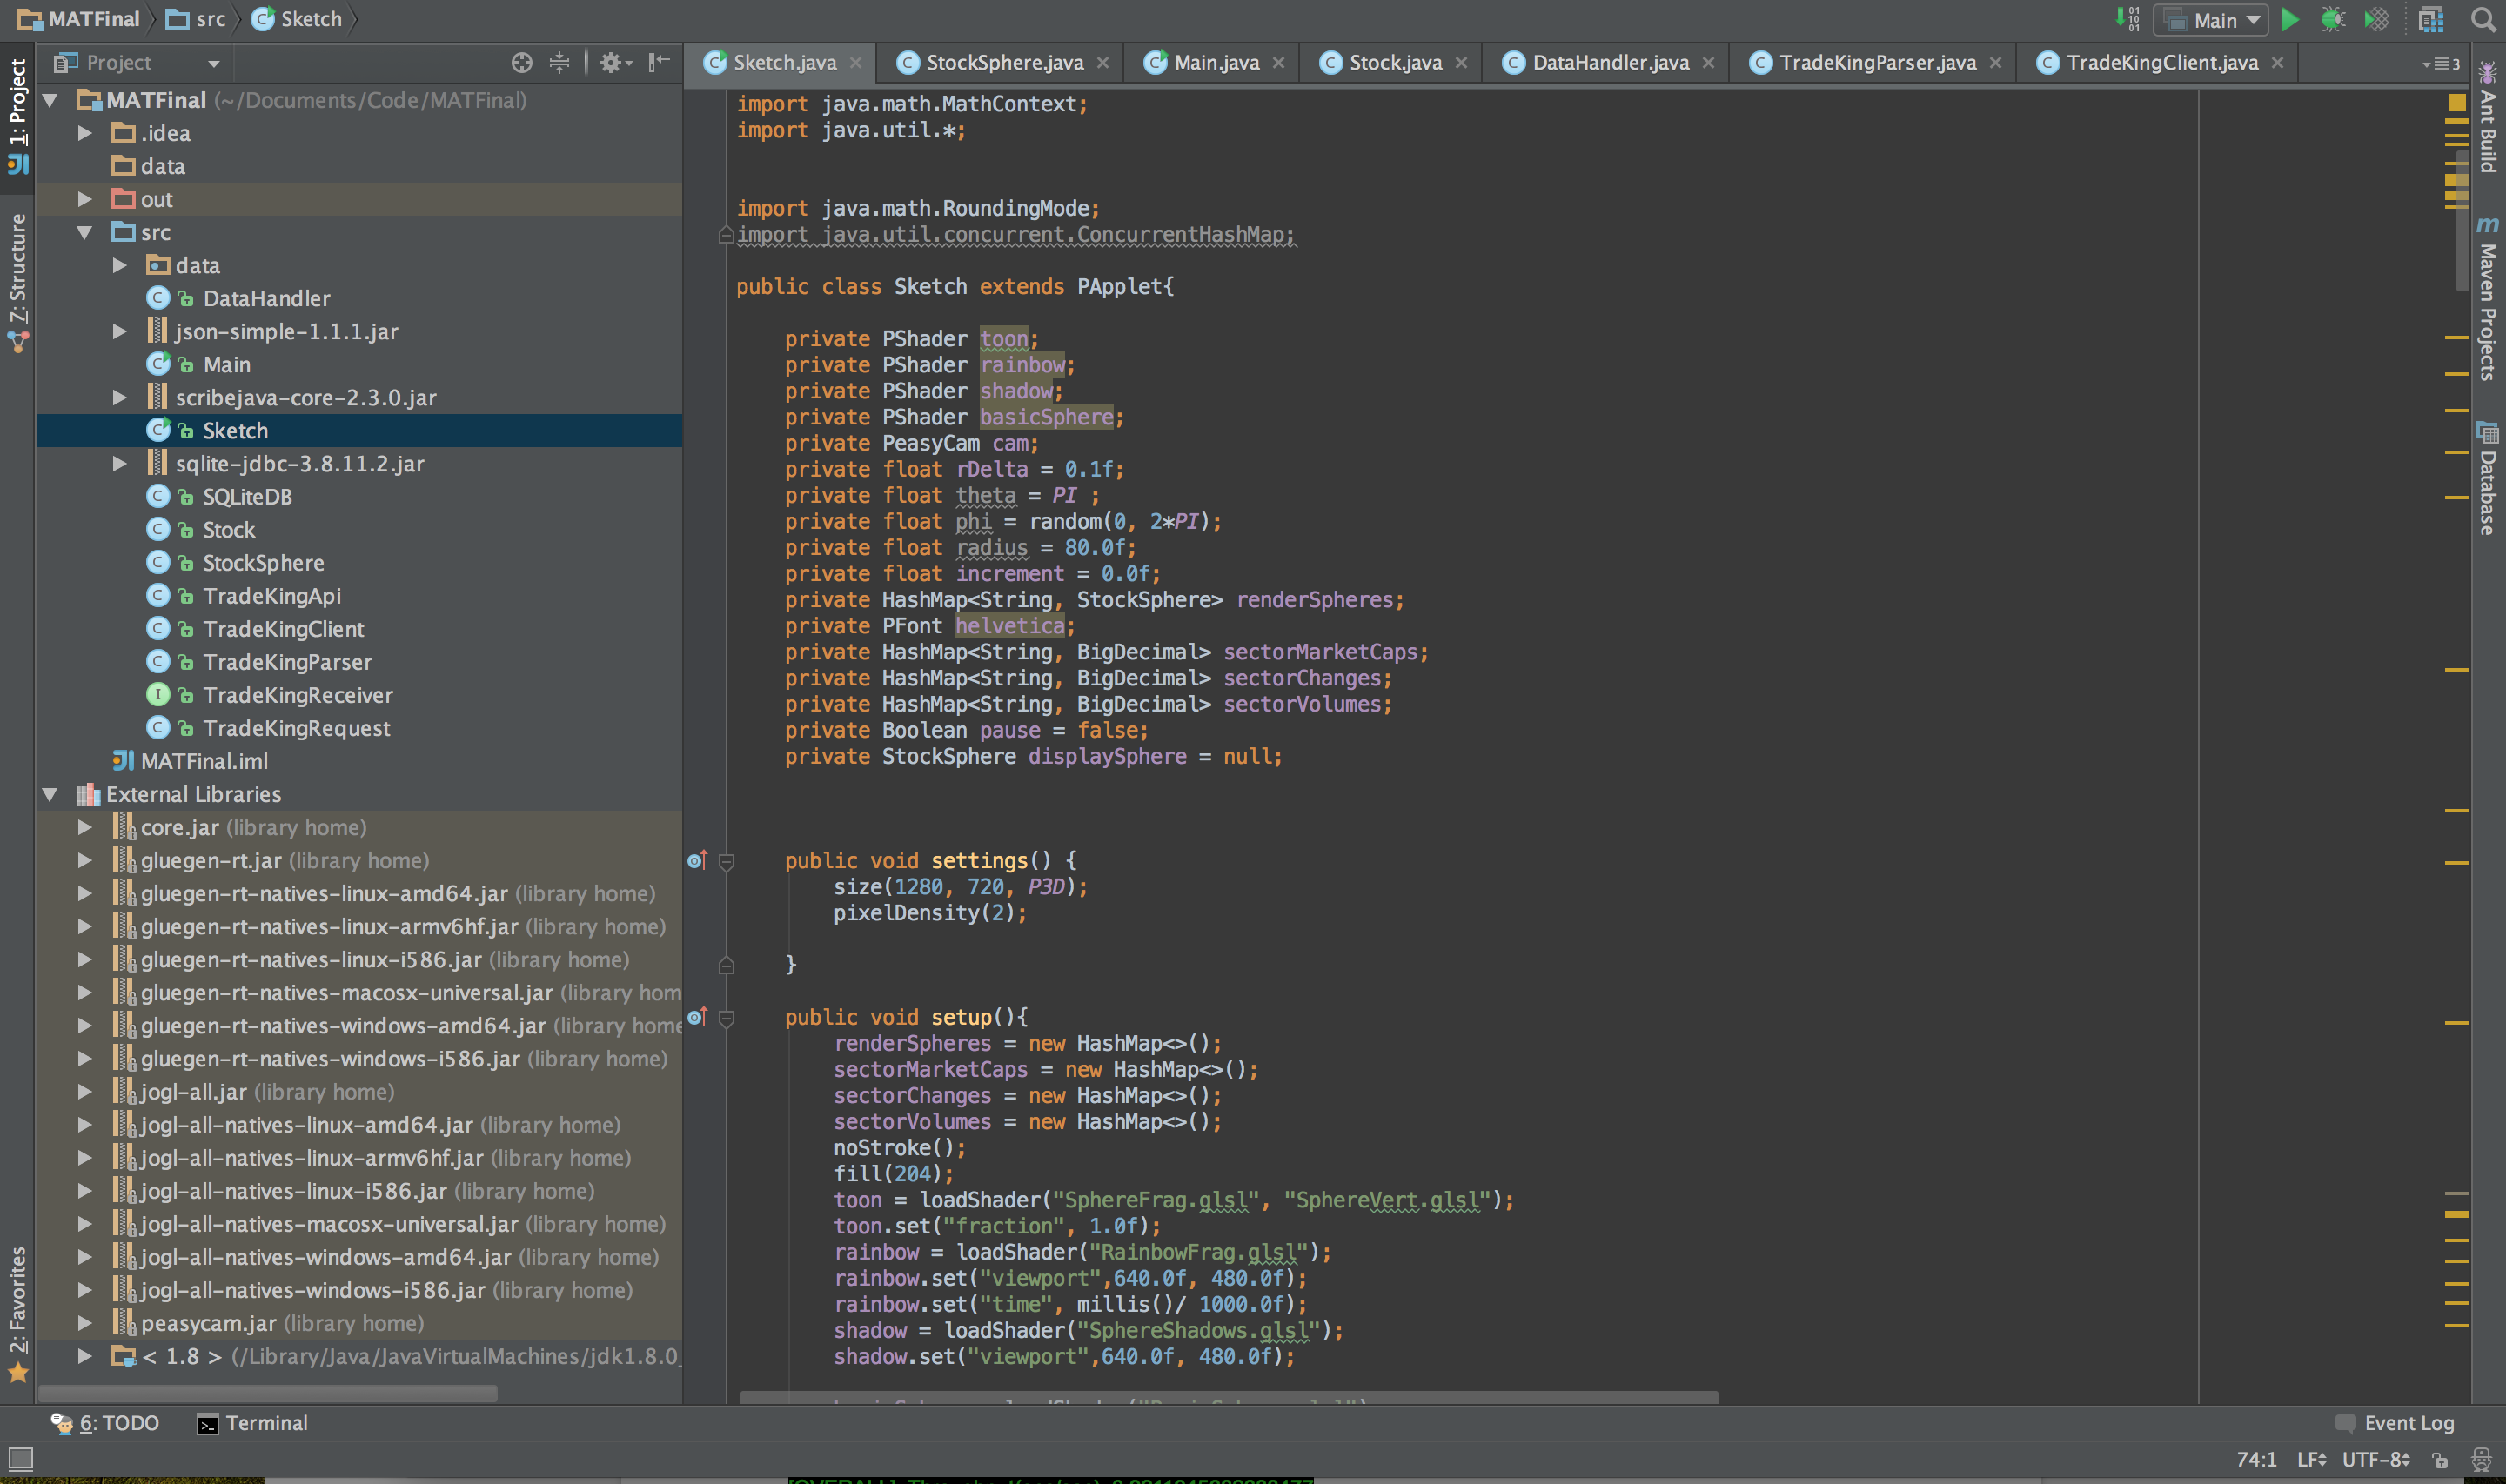
I ended up pulling the Processing libraries into a separate IDE called intellij for this project so there were essentially two aspects of building the code. The first was creating a means to query the data and store the relevant data for the visualization. I created a background thread to loop through and query the data at a constant rate, which means the visualization is built in realtime with corresponding data. The visualization aspect involved creating a new Processing sketch within the IDE (shown below).
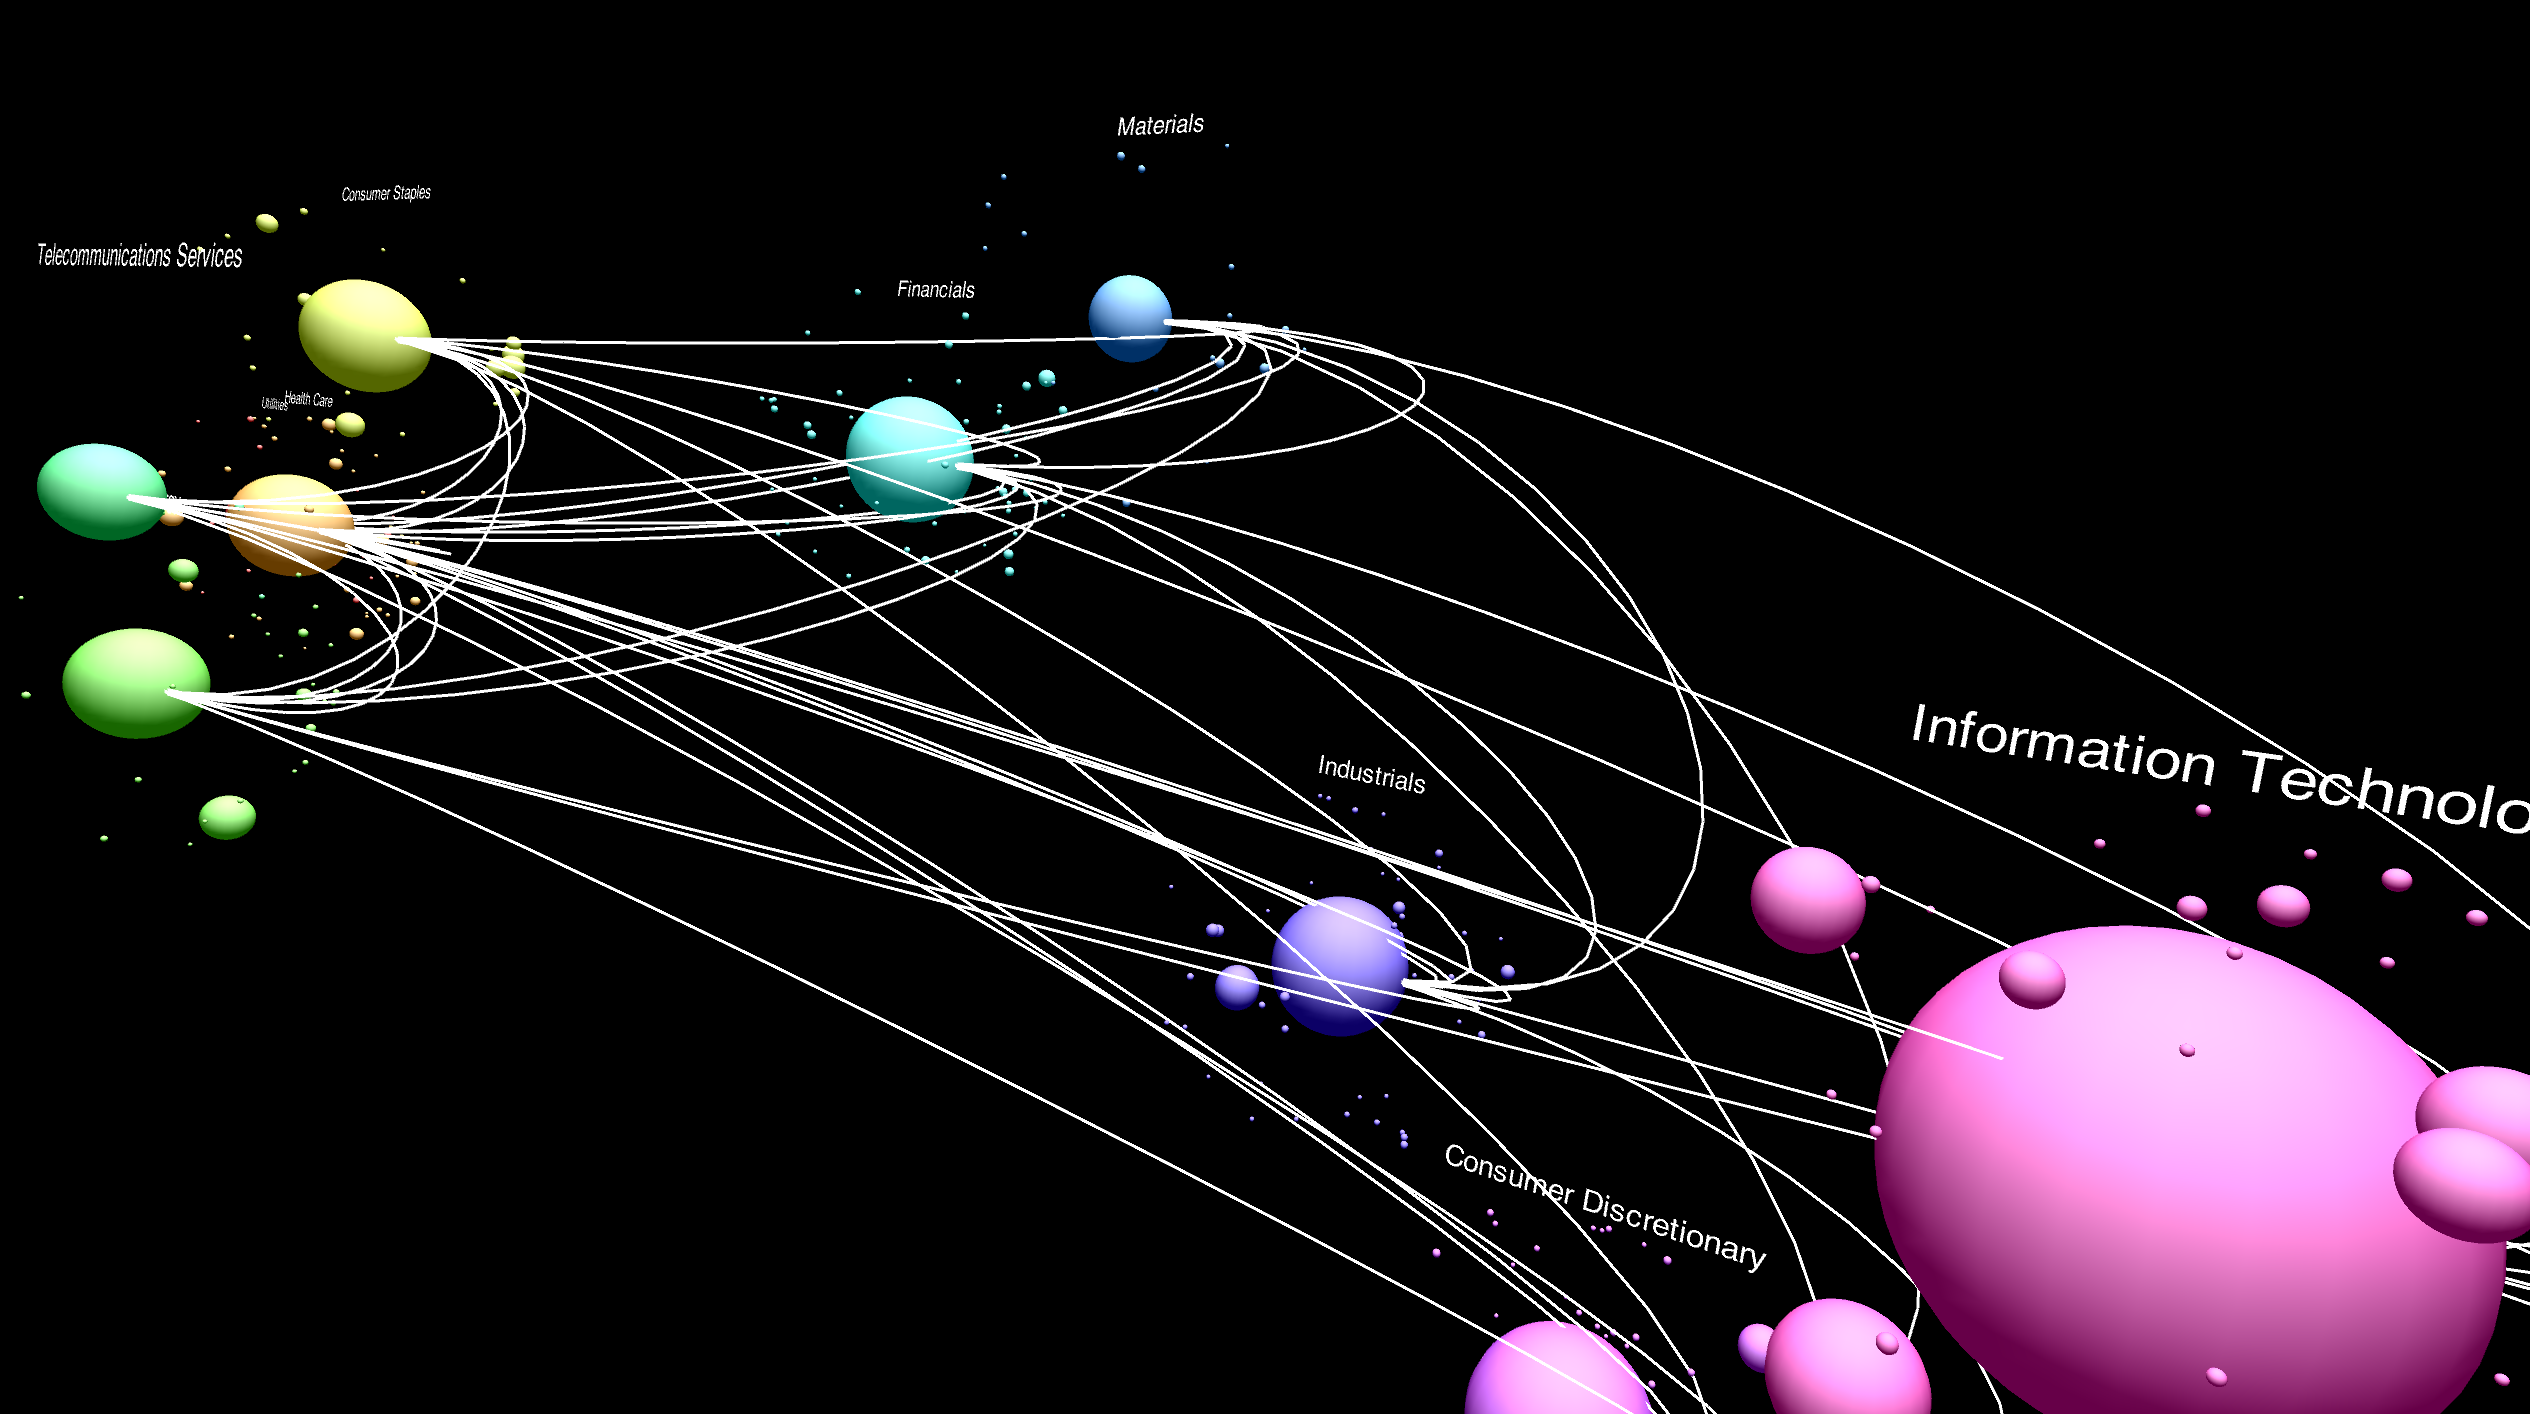
I decided to structure the sketch by using the sectors that each stock was in as a basis for its orbit. So I created a sphere for each of the 10 sectors. From there, I rotated the stock spheres around their corresponding sector sphere. The rotational speed is based on the amount of current volume relative to the volume of the stock for the last three weeks. Faster stock spheres mean there is more relative volume. The scale of each sphere is related to its market capitalization-- a measure of how much total money is held in each stock. Finally, the position vertically indicates whether the sector is up or down on the day, and the depth position is a a measure of average market capitalization of the stock in that sector.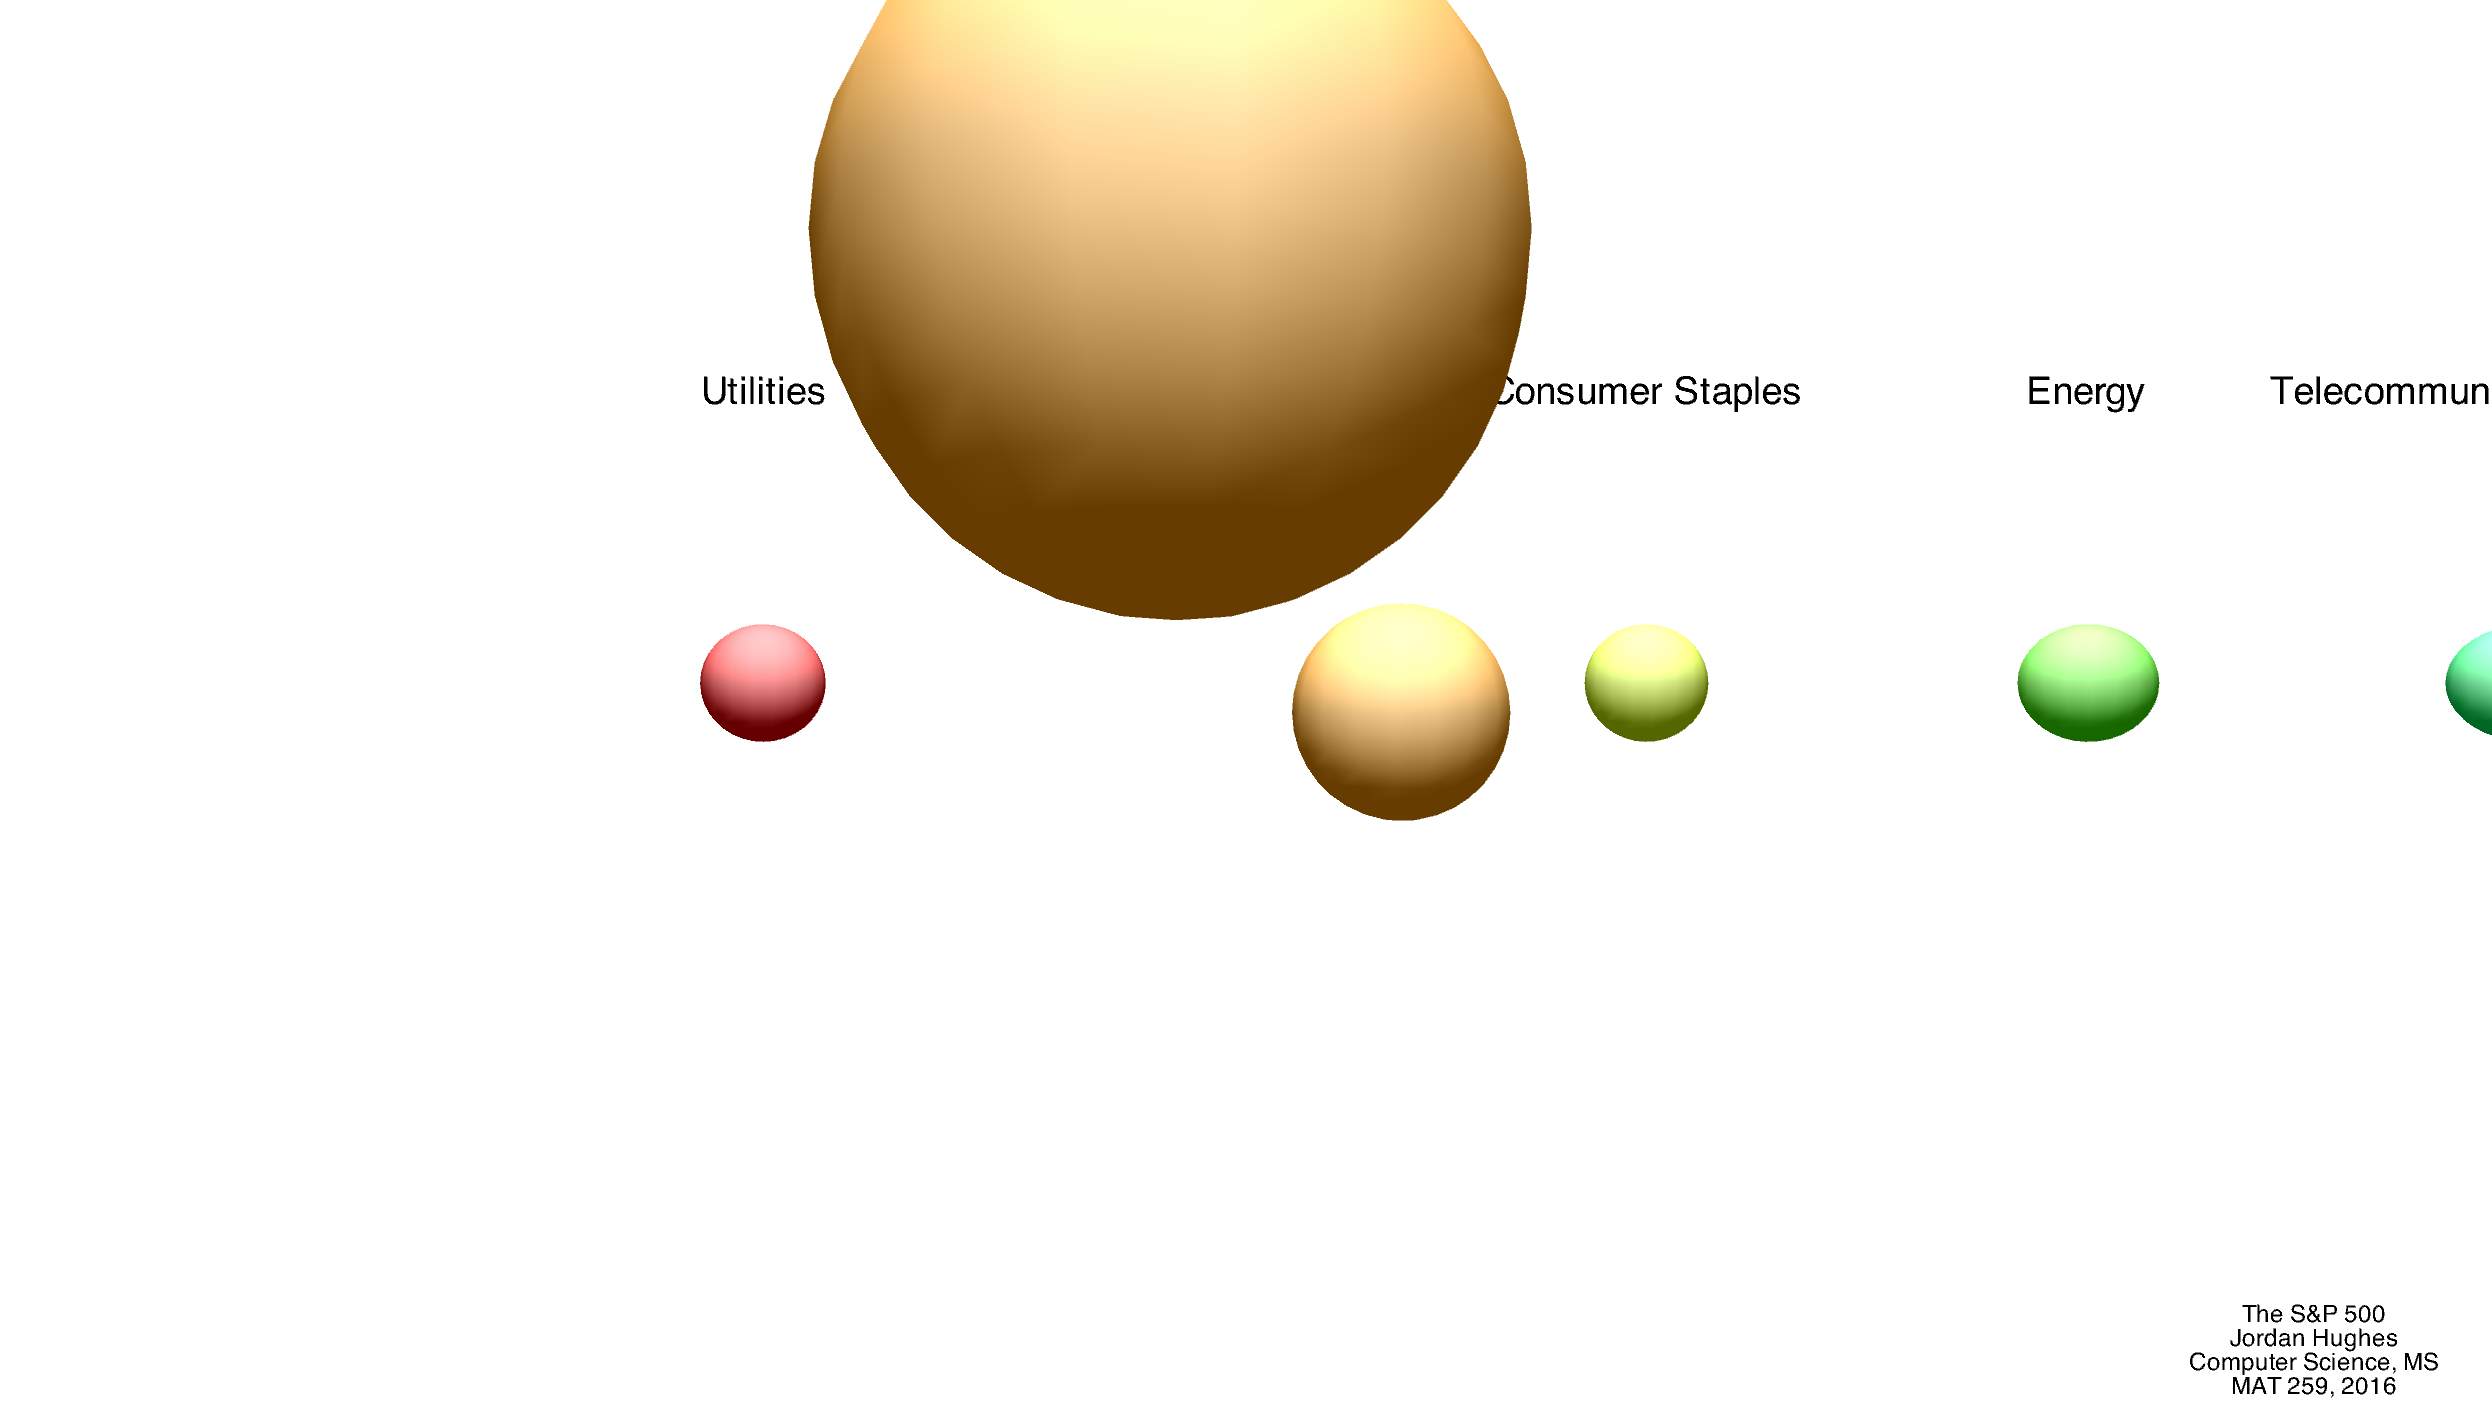
I decided to structure the sketch by using the sectors that each stock was in as a basis for its orbit. So I created a sphere for each of the 10 sectors. From there, I rotated the stock spheres around their corresponding sector sphere. The rotational speed is based on the amount of current volume relative to the volume of the stock for the last three weeks. Faster stock spheres mean there is more relative volume. The scale of each sphere is related to its market capitalization-- a measure of how much total money is held in each stock. Finally, the position vertically indicates whether the sector is up or down on the day, and the depth position is a a measure of average market capitalization of the stock in that sector.
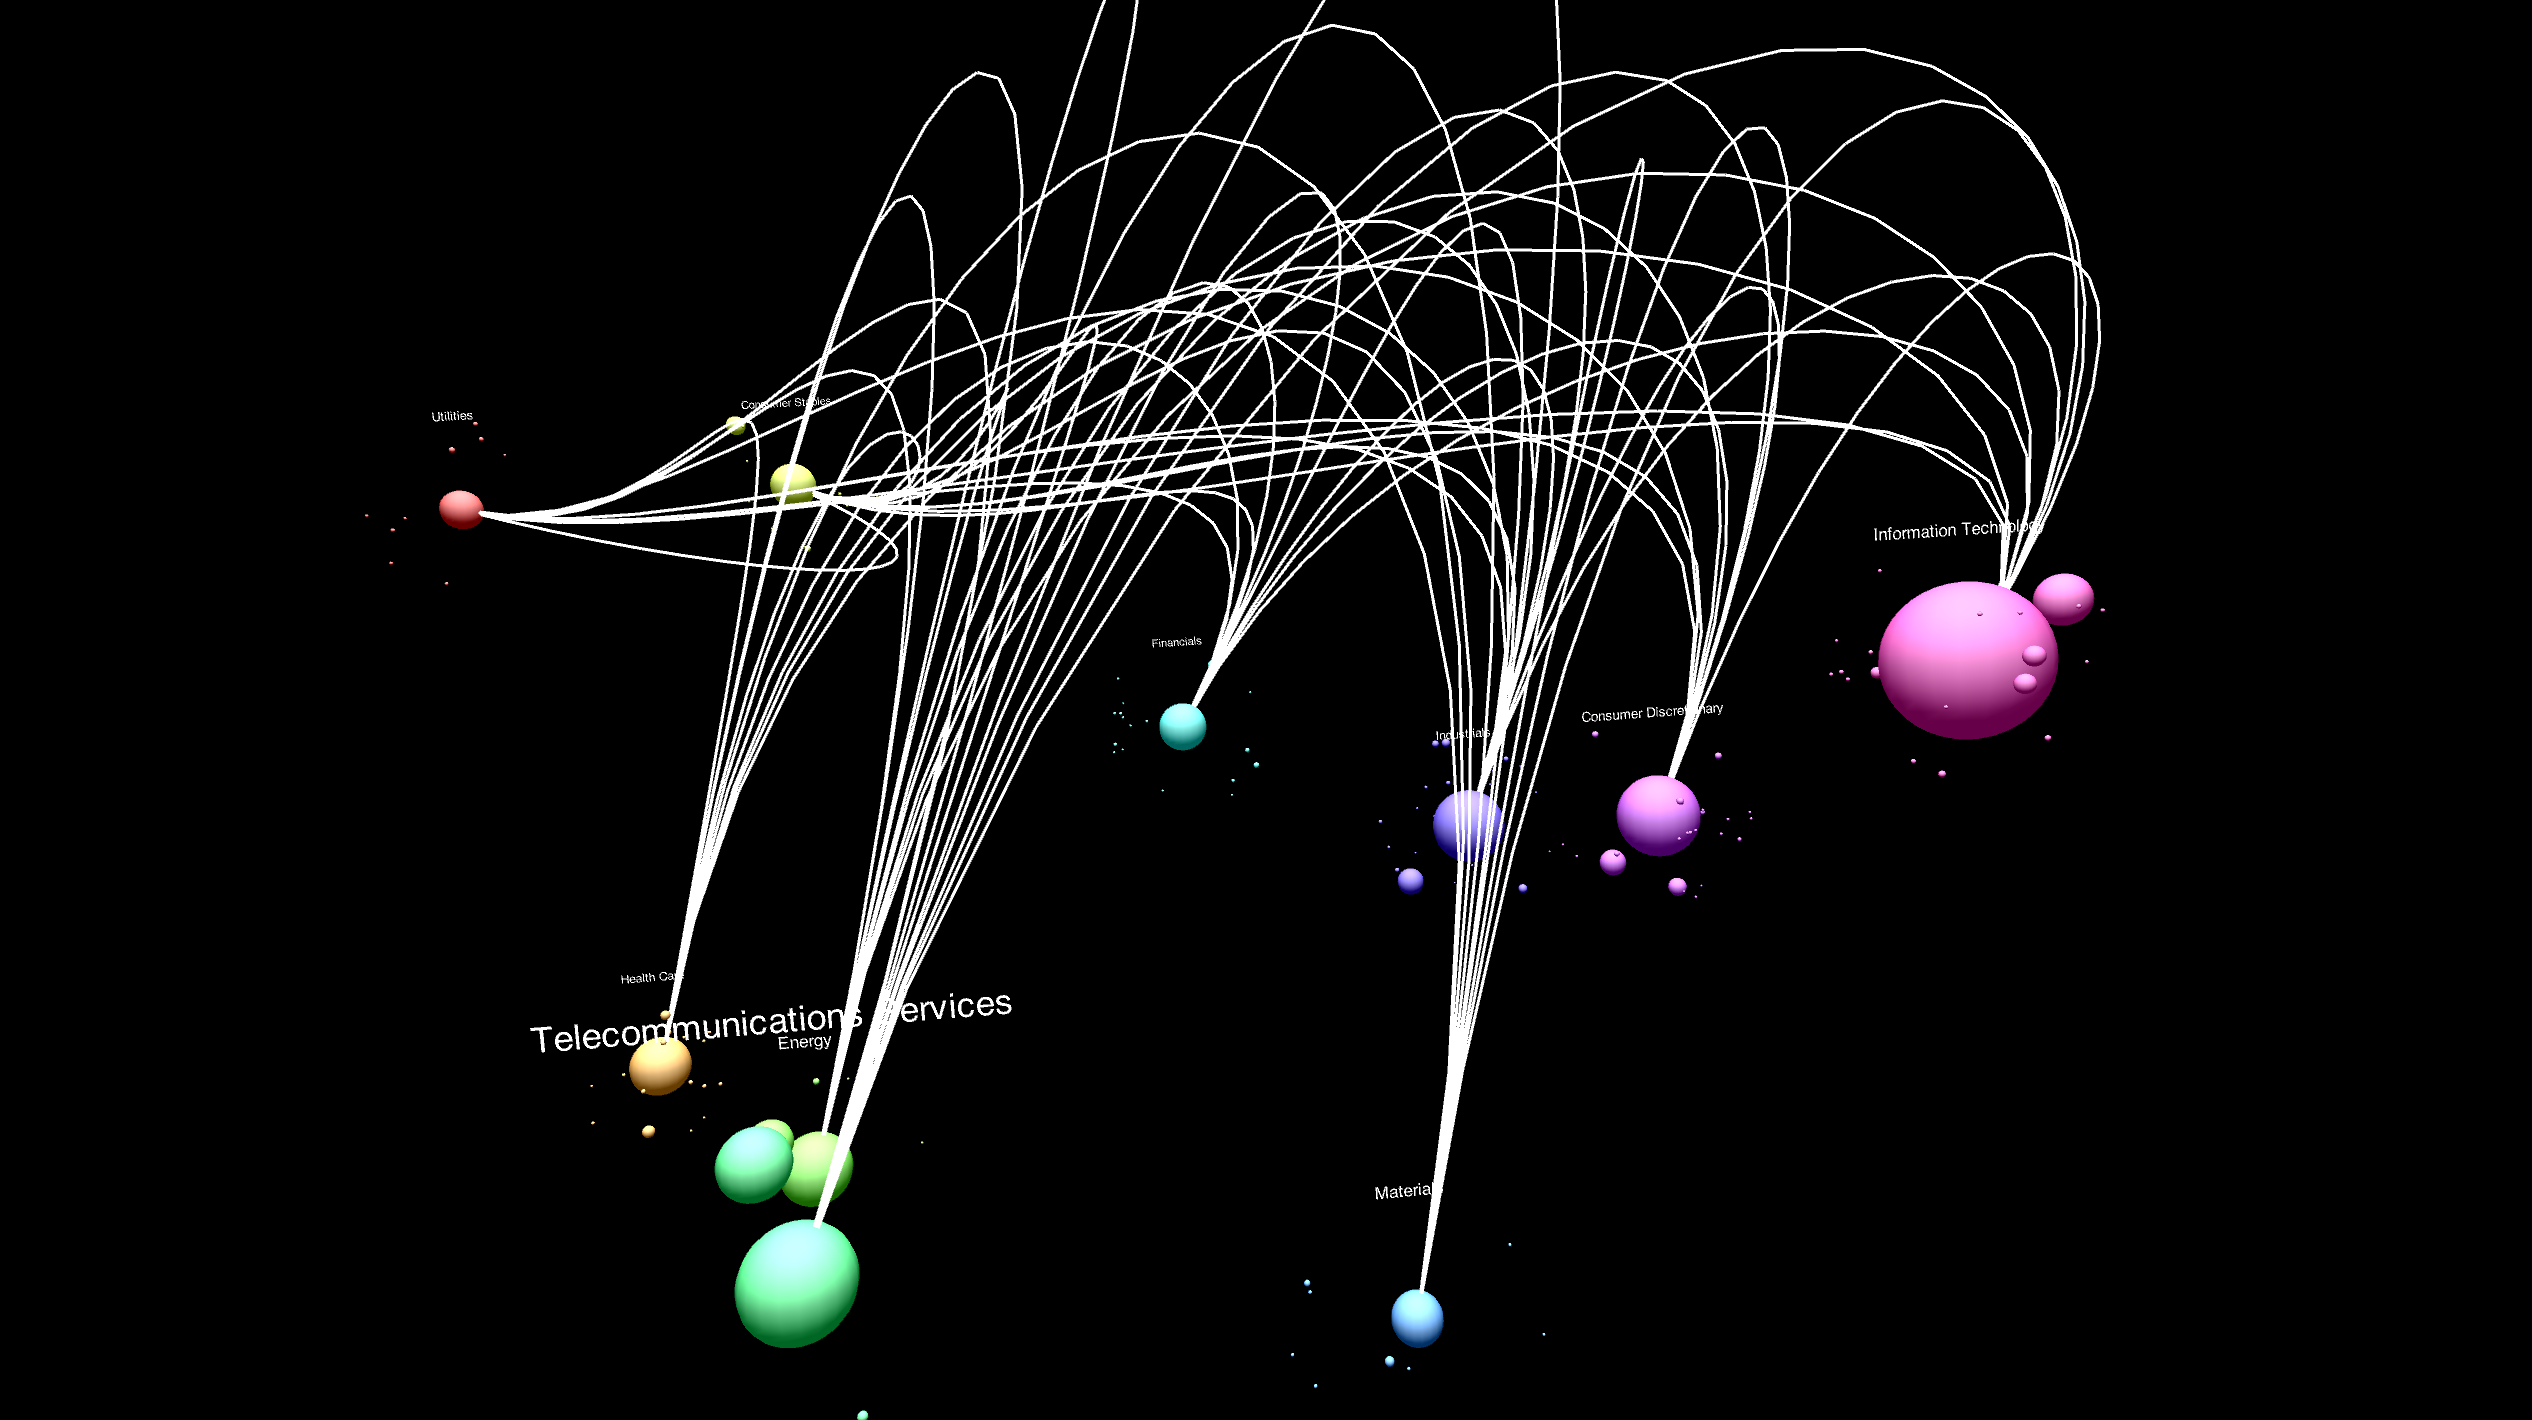
Final result
In the final iteration, I added bezier curves to give a greater sense of depth and position relative to each sector for the spheres.
Code